4728
Combining Extreme Narrowing and Slow Motion Regime in a Simple Motional Model for Sodium NMR Environment.1Medical Faculty Mannheim, Heidelberg University, Mannheim, Germany, 2National High Magnetic Field Laboratory, Tallahassee, FL, United States
Synopsis
Keywords: Non-Proton, Non-Proton, Sodium, X-Nuclei, Very-High B-Field
This study investigates a model of ion motion that is compatible with 23Na T1 and T2 mechanism of relaxation and even works with quasi mono-exponential T1. We compare this model with the commonly used Debye model using agar as a tissue model system at 9.4T and 21.1T.
Introduction
Slow modulations of the electric field gradient and the quadrupole interactions are causing biexponential 23Na T1 and T2 MR relaxation. Recently, we presented a sequence to determine reliably1 the T1s and T1f components of the relaxation times.It was previously shown that the Debye model does not adequately describe sodium interactions2-4. The T1 differences are much smaller than expected from the Debye model. However, the model is still widely used4-6, since alternative models2-4,7 usually use too many parameters or are limited to specific situations like anisotropic environment.
This study investigate an alternative model of sodium interactions based on the Debye model that is simple, yet providing more compatibility with the experimental T1 and T2 relaxation times. We compare and discuss the parameters of this model for several samples at 9.4T and 21.1T.
Materials and Methods
The 23Na relaxation times are calculated by4$$T_{1s}=\frac{1}{2J_1},\;T_{1f}=\frac{1}{2J_2}\\T_{2s}=\frac{1}{J_1+J_2},\;T_{2f}=\frac{1}{J_0+J_1},$$
where Jm are the spectral densities that carry the information about interactions of the sodium nucleus with its environment.
The most general model for describing the spectral densities uses a distribution of correlation times $$$p(\tau_c)$$$ and time dependent interaction strength $$$\omega_Q(\tau_c)$$$:
$$J_m=\int_{0}^{\infty}p(\tau_c)\cdot\omega_Q^2(\tau_c)\frac{\tau_c}{1+(m\omega_0\tau_c)^2}d\tau_c$$
Assumptions about $$$p(\tau_c)$$$ and $$$\omega_Q(\tau_c)$$$ are necessary to simplify $$$J_m$$$ for application in experiments.
The Debye model uses a Delta distribution for $$$p(\tau_c)$$$ at single correlation time $$$\tau_c$$$ and interaction strength $$$\omega_Q$$$ to describe the spectral densities:
$$J_m=\omega_Q^2\frac{\tau_c}{1+(m\omega_0\tau_c)^2}$$
There are two relevant motional regimes, the extreme narrowing regime with $$$\omega_0\tau_c\ll1$$$ that causes mono-exponential decay and the slow-motion regime that causes biexponential relaxation. Both regimes can occur simultaneously, e.g. by Bull exchange8. Therefore, a model of sodium interactions should consider the influence of both regimes.
We propose a $$$p(\tau_c)$$$ consisting of two delta distributions, one for each motional regime leading to spectral densities of the form
$$J_m=\omega_{Q,en}^2\tau_{c,en}+\frac{\tau_c}{1+(m\omega_0\tau_c)^2}=J_{en}+\frac{\tau_c}{1+(m\omega_0\tau_c)^2}$$
where $$$J_{en}=\omega_Q^2\tau_{c,en}$$$ is the spectral density in the extreme narrowing regime and $$$\tau_c$$$ and $$$\omega_Q$$$ are the effective correlation time and interactions strength, respectively.
To decouple T1 and T2, we introduce B0-inhomogeneities in the model. Local frequency shifts of the Lamor frequency $$$\omega_{shift}$$$ change the transfer functions according to9
$$f_{ij,shift}^q(t)=f_{ij}^q(t)\exp(-iq\omega_{shift}t)$$
Typically, B0 deviations follow a Lorentz distribution9,10, such that the transfer functions become
$$f_{ij,B0}^q(t)=f_{ij}^q(t)\int_{-\infty}^{\infty}p(\omega_{shift})\exp(-iq\omega_{shift}t)d\omega_{shift}=f_{ij}^q(t)\exp(-qR_{B0}t)$$
The last step uses that the integral has the form of a Fourier transform (FT) and the FT of the Lorentzian is an exponential function. Therefore, the relaxation rates are effectively
$$R_{i,B0}=R_i+q\cdot{}R_{B0}$$
With q=0 for T1, q=1 for T2 and $$$R_{B0}$$$ being the influence of B0-inhomogeneities on the relaxation times.
In total, the model has four intrinsic parameters, $$$J_{en}$$$, $$$\tau_c$$$, $$$\omega_Q$$$ and $$$R_{B0}$$$ and four measurement parameters, $$$T_{1s}$$$, $$$T_{1f}$$$, $$$T_{2s}$$$ and $$$T_{2f}$$$. To calculate the model intrinsic parameters from the measurement parameters, we use an optimization algorithm that minimizes the difference between the measurement parameters and the relaxation times calculated from the model parameters.
Measurement data was acquired at a 9.4T preclinical MRI (Bruker Biospec 94/20) using a linear 1H/23Na Bruker volume coil and at the 21.1T preclinical MRI scanner at the NHML (Tallahassee, Florida, USA)11 equipped with a custom-built 1H/23Na volume coil12. The samples consisted of [2,4,6]% w/w agarose with 154mM. The T2 and T1 relaxation times were obtained using the TQTPPI13 and the IRTQTPPI sequences1, respectively. T1f is determined using T1s from a biexponential fit and T1m from a mono-exponential fit of the FID.
Results/Discussion
Fig.1 shows the relaxation times that were used to calculate the Debye and 2xDebye model parameters. All input and model parameters are summarized in Tab.1 for 9.4T and in Tab.2 for 21.1T.Fig.2 shows the Debye model parameters determined with T1 and T2 at 9.4T and 21.1T. The parameters substantially deviate from each other. This indicates that the model does not adequately describe the sodium-environment interaction and provides space for a more sophisticated model.
The model parameters for the new model proposed in this study for 9.4 T and 21.1T are also presented in Fig.2. By design, the model parameters are consistent with the measured relaxation times. However, the parameters differ between 9.4T and 21.1T since this model is still an approximation. The model parameters vary as expected when considering a more sophisticated $$$p(\tau_c)$$$ as indicated in the results of others3. Since $$$\omega_0\tau_c\sim1$$$ for smaller $$$\tau_c$$$, the slow motion regime includes faster interactions. This causes the effective $$$\tau_c$$$ to decrease and the average $$$\omega_Q$$$ to increase, since the fraction in the slow motion regime increases. $$$J_{en}$$$ decreases as the fraction in the extreme narrowing regime decreases.
The value of RB0 (the inhomogeneity parameter) is negative for all samples, which is unphysical. This indicates that T2s is too large relative to T1s and T1f. The relaxation times depend on the temperature and sometimes change in the 1-3ms range during measurement. Such small difference can shift to positive values. Moreover, T1f makes only 20% of the signal, which may vause inaccurate fit values.
Conclusion
This study presents a simple model of sodium interactions with environment that includes contribution of both the extreme narrowing as well as the slow motion regimes in presence of B0 inhomogeineities. The model parameters are easy-to-compute and inherently provide relaxation times closer to the experiment and even works with almost mono-exponential T1.Acknowledgements
A portion of this work was performed at the National High Magnetic Field Laboratory, which is supported by the National Science Foundation Cooperative Agreement No. DMR-1644779 and the State of Florida.References
1. Reichert S, Kleimaier D, Schad L. Comparison of Double Quantum (DQ) Suppression Methods for Inversion Recovery TQTPPI (IRTQTPPI) Sequence Proc Intl Soc Mag Reson Med. 2022;30.
2. Rooney WD, Springer CS. A comprehensive approach to the analysis and interpretation of the resonances of spins 3/2 from living systems. NMR Biomed. 1991;4(5):209-226.
3. Rooney WD, Springer Jr CS. The molecular environment of intracellular sodium: 23Na NMR relaxation. NMR Biomed. 1991;4(5):227-245.
4. Madelin G, Lee J-S, Regatte RR, Jerschow A. Sodium MRI: Methods and applications. Progress in Nuclear Magnetic Resonance Spectroscopy. 2014;79:14-47.
5. Kleimaier D, Schepkin V, Hu R, Schad LR. Protein conformational changes affect the sodium triple-quantum MR signal. NMR Biomed. 2020;33(10):e4367.
6. van der Maarel JRC. Thermal relaxation and coherence dynamics of spin 3/2. I. Static and fluctuating quadrupolar interactions in the multipole basis. Concepts in Magnetic Resonance. 2003;19A(2):97-116.
7. Payne GS, Styles P. Multiple-quantum-filtered 23Na NMR spectroscopy in model systems. Journal of Magnetic Resonance (1969). 1991;95(2):253-266.
8. Bull TE. Nuclear magnetic relaxation of spin-32 nuclei involved in chemical exchange. Journal of Magnetic Resonance (1969). 1972;8(4):344-353. 9. Tanase C, Boada FE. Triple-quantum-filtered imaging of sodium in presence of B0 inhomogeneities. J Magn Reson. 2005;174(2):270-278.
10. Kratzer FJ, Flassbeck S, Nagel AM, et al. Sodium relaxometry using 23Na MR fingerprinting: A proof of concept. Magn Reson Med. 2020;84(5):2577-2591.
11. Fu R, Brey WW, Shetty K, et al. Ultra-wide bore 900MHz high-resolution NMR at the National High Magnetic Field Laboratory. J Magn Reson. 2005;177(1):1-8.
12. Qian C, Masad IS, Rosenberg JT, et al. A volume birdcage coil with an adjustable sliding tuner ring for neuroimaging in high field vertical magnets: Ex and in vivo applications at 21.1T. J Magn Reson. 2012;221:110-116.
13. Schepkin VD, Neubauer A, Nagel AM, Budinger TF. Comparison of potassium and sodium binding in vivo and in agarose samples using TQTPPI pulse sequence. J Magn Reson. 2017;277:162-168.
Figures
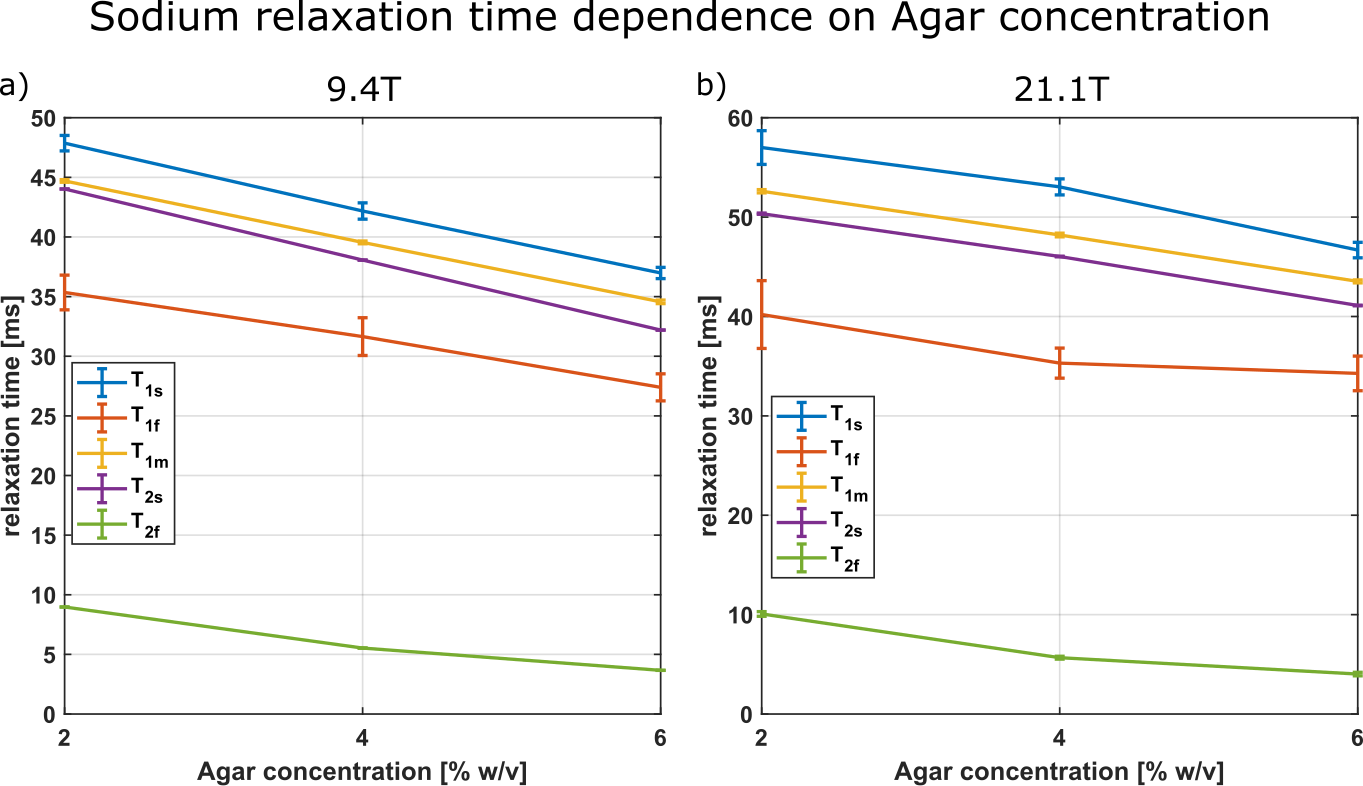
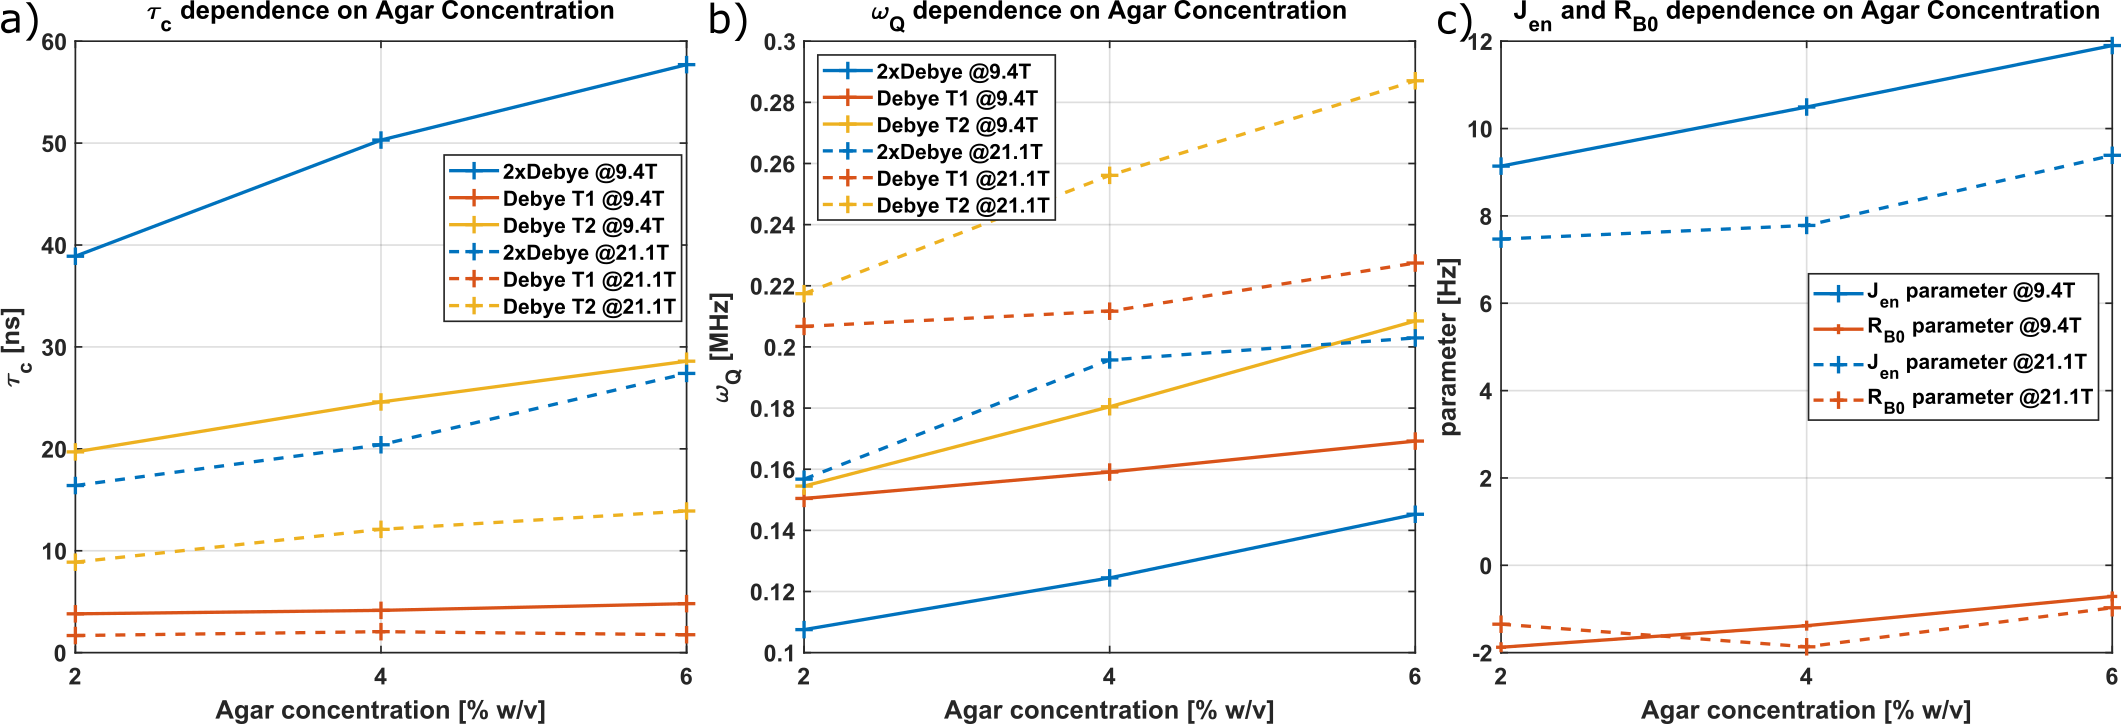
Fig.2: Comparison of the parameters of the Debye and the proposed (2xDebye) at 9.4T (solid lines) and 21.1T (dashed lines). a) shows the correlation time $$$\tau_c$$$, b) the quadrupole interaction strength $$$\omega_Q$$$ and c) Jen and RB0 parameters of the 2xDebye model. The Debye model parameters, correlation time $$$\tau_c$$$ and quadrupole interaction strength parameter $$$\omega_Q$$$ can be determined using T1 and T2 relaxation times, respectively. Both sets of parameters deviate stronger with increasing agar concentration.
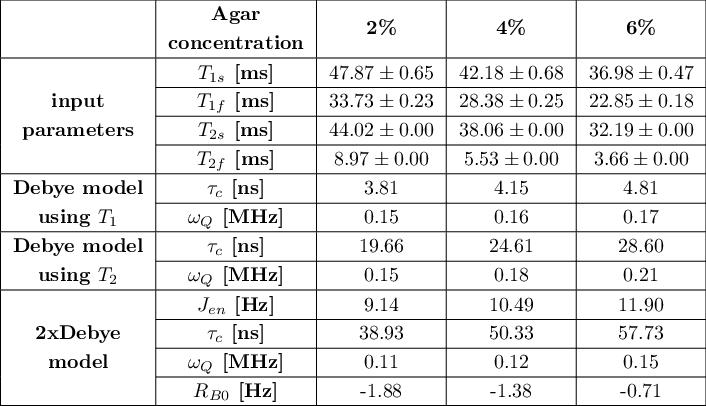
Tab.1: Summary of input parameters T1s, T1f, T2s, T2f and model parameters of the Debye model and 2xDebye model at 9.4T. The Debye parameters can be calculated using the T1 and the T2 relaxation times but the set of parameters are inconsistent with the experimental relaxation times. The model parameters of the 2xDebye model are inherently consistent with the experimental data.
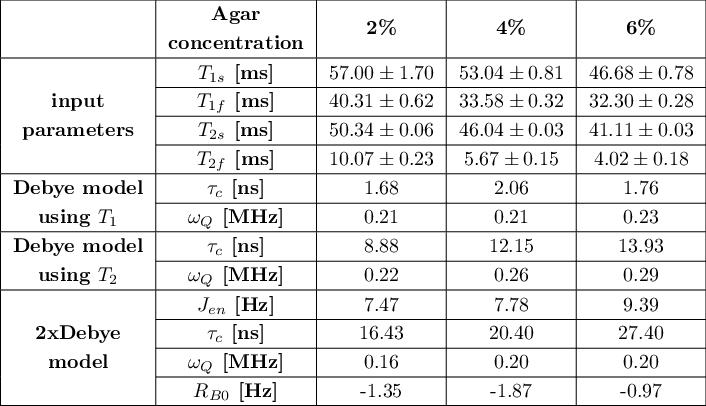
Tab.2: Summary of input parameters T1s, T1f, T2s, T2f and model parameters of the Debye model and 2xDebye model at 21.1T. The Debye parameters can be calculated using the T1 and the T2 relaxation times but the set of parameters are inconsistent with the experimental relaxation times. The model parameters of the 2xDebye model are inherently consistent with the experimental data.