4726
Metabolic imaging of response to therapy in pediatric diffuse midline gliomas1University of California, San Francisco, San Francisco, CA, United States
Synopsis
Keywords: Non-Proton, Metabolism, preclinical, animals, brain, spectroscopy, deuterium
Diffuse midline gliomas (DMGs) are lethal pediatric brain tumors. DMG patients are typically treated with radiation in combination with an experimental agent in clinical trials. ONC206 is a novel drug with promising efficacy in preclinical models. Successful clinical translation and deployment of ONC206 requires the identification of companion biomarkers of treatment response. Therefore, the goal of this study was to identify magnetic resonance spectroscopy (MRS)-detectable biomarkers of response to ONC206 in preclinical DMG models. Our studies identify a combination of 1H- and 2H-MRS-detectable biomarkers that serve as imaging biomarkers of early response to ONC206 in mice bearing intracranial DMG xenografts.INTRODUCTION
Diffuse midline gliomas (DMGs) are universally lethal pediatric tumors1,2. Radiotherapy, which is standard of care, does not significantly enhance long-term outcome1,2. Novel therapies are sorely needed for DMG patients. The imipridone drug ONC206 has demonstrated anti-tumor activity in preclinical cancer models, including DMGs and has shown promise in pilot studies in DMG patients3-7.Magnetic Resonance Imaging (MRI) is the gold standard for DMG imaging8. However, MRI does not adequately assess response to therapy8. Since studies suggest that ONC206 alters DMG metabolism3,4, magnetic resonance spectroscopy (MRS)-based metabolic imaging has the potential to provide a readout of response to therapy. 1H-MRS detects steady-state metabolite levels while 2H-MRS detects dynamic metabolic activity9-11. Therefore, the goal of this study was to identify MRS-detectable biomarkers of response to ONC206 in preclinical DMG models.
METHODS
Cell models: We performed studies on patient-derived DMG models (SF7761 and SF8628). Cell lines were maintained as described previously12. SF7761 cells were treated with 2μM ONC206 for 72h.1H-MRS in cells: Metabolites were extracted using the dual-phase methanol-chloroform extraction method13. 1H-MR spectra were recorded using a Bruker 500MHz spectrometer equipped with a triple resonance cryoprobe. Data was analyzed using MestRenova. Peak integrals were corrected for saturation and normalized to an external reference of known concentration and to cell number13.
2H-MRS in live cells: Cells were incubated with media containing 10mM [U-2H]-pyruvate for 72h14. 2H-MR spectra were acquired from a suspension of live cells using a 16mm 2H single loop surface coil on a Bruker 3T scanner and a pulse-acquire sequence (TR=506.361ms, NA=1000, complex points=256, spectral width=512.8Hz). Data analysis was performed using MestReNova. Peak integrals were corrected for saturation and converted to mM concentration using the natural abundance semi-heavy water peak (HDO, 4.75ppm) as an internal reference (12.8mM as quantified from a vial containing saline)14.
Animal Studies: SF8628 cells were intracranially implanted as described previously13,14. MRI and 1H-MRS studies were performed on a 14.1T Varian spectrometer using a 1H volume coil. Axial T2-weighted MR images were recorded using a spin-echo sequence (TE/TR=20/1200ms, FOV=30x30mm, 256x256, ST=1mm, NA=2). Once tumors reached a volume of ~20mm3, this timepoint was considered day 0 and mice were treated intraperitoneally with 25mg/kg ONC206 in saline every day for 5 days per week. This treatment regimen was chosen based on prior studies demonstrating extended survival in preclinical DMG models3-5. 1H-MR spectra were acquired from an 8mm3 voxel using a point resolved spectroscopy (PRESS) sequence at day 0 and day 7. Data was analyzed using LCModel13.
In vivo 2H-MRS: Data was acquired using a 16mm 2H surface coil on a 14.1T Varian spectrometer14. Following injection of a bolus of [U-2H]-pyruvate (450mg/kg) via a tail-vein catheter, non-localized 2H-MR spectra were acquired with a pulse-acquire sequence (TR=500ms, averages=500, complex points=512, flip angle=64, spectral width=2kHz, temporal resolution=4min 10s). Absolute metabolite concentrations were determined by correcting peak integrals for saturation and normalizing to pre-injection HDO (estimated to be 10.12mM10,11,15).
Statistical analysis: All results are expressed as mean ± standard deviation. Unpaired two-tailed Welch's t-test was used to assess the statistical significance of differences (p<0.05 considered significant).
RESULTS AND DISCUSSION
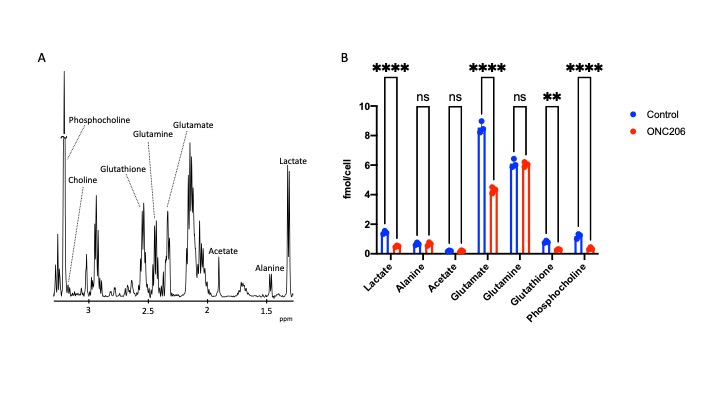
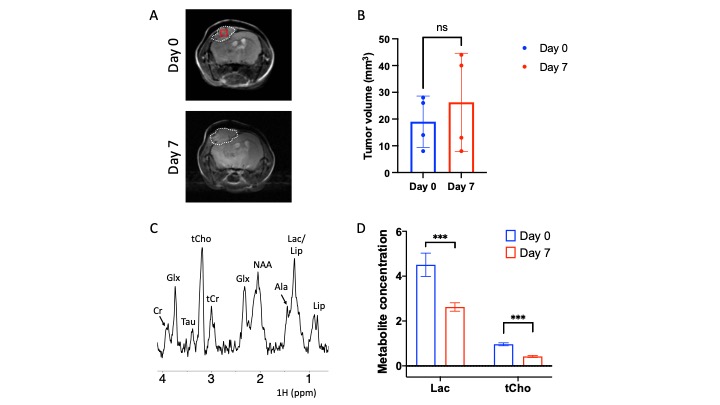
ONC206 alters 1H-MRS-detectable metabolite levels in DMG cells and orthotopic tumors: To begin with, we examined the ability of 1H-MRS to assess response to ONC206 in SF7761 cells. Fig. 1A shows a representative 1H-MR spectrum from SF7761 cells. Our results indicate that ONC206 significantly reduces steady-state levels of lactate, glutamate, glutathione and phosphocholine (Fig. 1B), pointing to inhibition of glycolysis, oxidative phosphorylation, redox and phosphatidylcholine biosynthesis.We then performed in vivo 1H-MRS before (day 0) and after (day 7) treatment with ONC206 in mice bearing orthotopic SF8628 tumors. This treatment regimen has previously been shown to significantly improve survival in DMG-bearing mice3-5. As shown in Fig. 2A-2B, there was no significant difference in tumor volume between day 0 and day 7, consistent with previous studies3-5. Importantly, 1H-MRS-detectable lactate and total choline (merged signal from choline, phosphocholine and glycerophosphocholine) were significantly reduced at day 7 of ONC206 treatment relative to day 0 (Fig. 2C-2D). Collectively, these results indicate that 1H-MRS can monitor response to ONC206 in vivo.
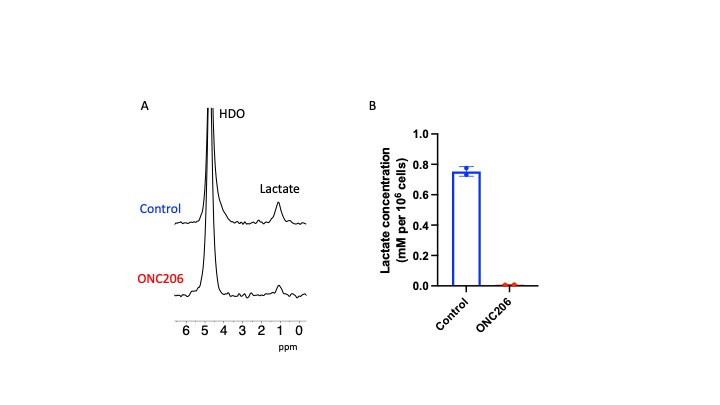
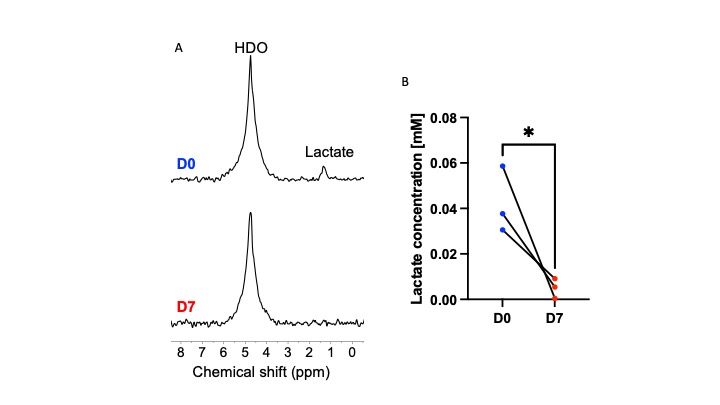
ONC206 alters 2H-MRS-detectable lactate production in DMG cells and tumors: Since the 1H-MRS data above indicated that ONC206 reduced steady-state lactate, we questioned whether ONC206 reduced dynamic 2H-MRS-detectable flux to lactate. As shown in Fig. 3A-3B, treatment with ONC206 abrogated lactate production from [U-2H]-pyruvate in SF7761 cells. Importantly, examination of mice bearing orthotopic SF8628 tumors indicated that lactate production from [U-2H]-pyruvate was significantly reduced at day 7 of ONC206 treatment relative to day 0 (Fig. 4A-4B), at a timepoint when no change was observed by T2-weighted MRI (see Fig. 2A-2B). These results suggest that 2H-MRS following administration of [U-2H]-pyruvate has the potential to monitor response to ONC206 in vivo.
CONCLUSIONS
Our study, for the first time, identifies a combination of 1H- and 2H-MRS-detectable metabolic biomarkers of DMG response to ONC206. 1H-MRS is used in the clinic and the feasibility of 2H-MRS has been established in adult glioma patients9,10. Our biomarkers, therefore, have the potential to be translated to the clinic, where they will enable accurate and early assessment of treatment response in DMG patients.Acknowledgements
This study was supported by NIH R01CA239288.References
1. Fangusaro J, Bandopadhayay P. Advances in the classification and treatment of pediatric brain tumors. Curr Opin Pediatr. 2021; 33(1):26-32.
2. Fangusaro J. Pediatric high grade glioma: a review and update on tumor clinical characteristics and biology. Frontiers in oncology. 2012; 2:105.
3. Bonner ER, Waszak SM, Grotzer MA, Mueller S, Nazarian J. Mechanisms of imipridones in targeting mitochondrial metabolism in cancer cells. Neuro-oncology. 2021; 23(4):542-556.
4. Przystal JM, Cosentino CC, Yadavilli S, et al. Imipridones affect tumor bioenergetics and promote cell lineage differentiation in diffuse midline gliomas. Neuro-oncology. 2022.
5. Wagner J, Kline CL, Ralff MD, et al. Preclinical evaluation of the imipridone family, analogs of clinical stage anti-cancer small molecule ONC201, reveals potent anti-cancer effects of ONC212. Cell Cycle. 2017; 16(19):1790-1799.
6. Kawakibi AR, Tarapore R, Gardner SL, et al. Clinical efficacy of ONC201 in thalamic H3 K27M-mutant glioma. Journal of Clinical Oncology. 2020; 38(15_suppl):3617-3617.
7. Prabhu VV, Morrow S, Rahman Kawakibi A, et al. ONC201 and imipridones: Anti-cancer compounds with clinical efficacy. Neoplasia (New York, N.Y.). 2020; 22(12):725-744.
8. Cooney TM, Cohen KJ, Guimaraes CV, et al. Response assessment in diffuse intrinsic pontine glioma: recommendations from the Response Assessment in Pediatric Neuro-Oncology (RAPNO) working group. Lancet Oncol. 2020; 21(6):e330-e336.
9. Gillies RJ, Morse DL. In vivo magnetic resonance spectroscopy in cancer. Annual review of biomedical engineering. 2005; 7:287-326.
10. De Feyter HM, Behar KL, Corbin ZA, et al. Deuterium metabolic imaging (DMI) for MRI-based 3D mapping of metabolism in vivo. Sci Adv. 2018; 4(8):eaat7314.
11. Lu M, Zhu XH, Zhang Y, Mateescu G, Chen W. Quantitative assessment of brain glucose metabolic rates using in vivo deuterium magnetic resonance spectroscopy. Journal of cerebral blood flow and metabolism : official journal of the International Society of Cerebral Blood Flow and Metabolism. 2017; 37(11):3518-3530.
12. Hashizume R, Smirnov I, Liu S, et al. Characterization of a diffuse intrinsic pontine glioma cell line: implications for future investigations and treatment. J Neurooncol. 2012; 110(3):305-313.
13. Batsios G, Viswanath P, Subramani E, et al. PI3K/mTOR inhibition of IDH1 mutant glioma leads to reduced 2HG production that is associated with increased survival. Sci Rep. 2019; 9(1):10521.
14. Batsios G, Taglang C, Tran M, et al. Deuterium metabolic imaging reports on TERT expression and early response to therapy in cancer. Clinical cancer research : an official journal of the American Association for Cancer Research. 2022.
15. Kreis F, Wright AJ, Hesse F, Fala M, Hu DE, Brindle KM. Measuring Tumor Glycolytic Flux in Vivo by Using Fast Deuterium MRI. Radiology. 2020; 294(2):289-296.
Figures