4725
Optimisation of Simultaneously Acquired Single and Triple Quantum Filtered Sodium MRI for Relaxometry at 7T1Institute of Neuroscience and Medicine - 4, Forschungszentrum Jülich GmbH, Jülich, Germany, 2Faculty of Medicine, RWTH Aachen University, Jülich, Germany, 3Institute of Neuroscience and Medicine - 11, Forschungszentrum Jülich GmbH, Jülich, Germany, 4Faculty of Medicine, RWTH Aachen University, Aachen, Germany, 5JARA-BRAIN - Translational Medicine, Jülich-Aachen Research Alliance, Aachen, Germany
Synopsis
Keywords: Non-Proton, Relaxometry, Sodium, Multiple Qunatum Filtering
Sodium relaxometry has great potential value for research and clinical practice. Enhanced Simultaneously Acquired Single and Triple Quantum Filtered Imaging of Sodium (eSISTINA) can yield information on both fast and slow transversal relaxation times. The eSISTINA sequence is optimised by adding an early echo in the multiple-quantum-filtered readout train using FLORET k-space trajectories. The optimised sequence is compared and verified against a conventional, Cartesian multi-echo gradient echo based enhanced eSISTINA sequence on a group of four healthy volunteers. The experimental results show that the optimised sequence has better in vivo relaxometry performance than the conventional sequence.Introduction
Sodium plays an essential role in human metabolism and is a proficient biomarker for various pathological conditions.1 Due to the spin-3/2 dynamics of sodium nuclei,2 sodium ions situated in an anisotropic environment exhibit a typical bi-exponential transversal relaxation behaviour, with a fast component (T2f) between 0.5ms and 5ms, and a slow component (T2s) between 15ms to 30ms.1 Sodium relaxometry has been shown to have the potential to provide valuable information for the assessment of some pathologies such as brain tumours.3 However, it is challenging to discriminate fast and slow relaxing components using conventional sodium magnetic resonance imaging (MRI). Fortunately, Enhanced Simultaneous Single Quantum and Triple Quantum Filtered Imaging of 23Na (eSISTINA) yields information on T2f and T2s through the acquisition of single quantum (SQ) and triple quantum (TQ) filtered signals.4,5 The eSISTINA sequence comprises three radiofrequency pulses with two separate readout trains: the ultrashort echo time (UTE) readout train after the first pulse providing information on T2f and the multiple quantum filtered (MQF) readout train following the third pulse yielding information about T2f and T2s.5 Here, the eSISTINA sequence is optimised to improve its bi-exponential relaxometry performance by applying 3D spiral-based centre-out FLORET6 k-space trajectories.Methods
A conventional eSISTINA sequence (eS1) with five FLORET UTE readouts and six Cartesian MQF readouts (Fig.1A) suffers from a relatively long dead time of 6.2ms between the third RF pulse and the first MQF readout. Typically, the first Cartesian MQF echo is placed at the peak of the TQ signal (at 10.5ms) and MQF sampling commences on the falling part of the TQ signal. To improve the relaxometry performance of eSISTINA, an optimised version (eS2) was implemented, which replaces the Cartesian MQF readouts with FLORET MQF readouts and adds an early readout capturing the rising part of the TQ signal and the early SQ decay (see Fig.1) with a dead time of just 1.37ms. Imaging was performed on four healthy volunteers (two females, 37±11.6 years) with both sequences using a dual-tuned 1H/23Na transmit/receive coil (RAPID Biomedical, Germany) on a Siemens Terra 7T scanner (SIEMENS Healthineers, Erlangen, Germany) using the parameters in Tab.1. FLORET raw data were reconstructed using the non-uniform fast Fourier transform provided by Jeff Fessler’s Michigan Image Reconstruction Toolbox (MIRT).7The segmentation of white matter was performed in FSL software (FMRIB, Oxford, UK) with the aid of anatomical information from MP2RAGE hydrogen images. Two methods were used to investigate the relaxometry performance in white matter of both sequences. In method 1, T2f was deduced from the fitting of the UTE signal decay, and feeding this value into the fitting routine of the TQ signal decay to obtain T2s. In method 2, TQ decay was used to obtain both T2f and T2s.8 A smaller fitting error was considered to indicate a better relaxometry performance. The average T2f and T2s estimates were comparted to literature values.9
Results
In vivo experiments show high intensity cerebrospinal fluid and vitreous humour in case of UTE and SQ, while structured regions are generating pronounced signal in TQ images. UTE images are weighted towards total sodium content, while SQ (TQ) images are weighted towards non-restricted (restricted) sodium (Fig.2). The early MQF readout of eS2 produces an additional SQ weighted image with higher SNR while adding an additional TQ image with lower SNR. The relaxation dynamics of white matter for one individual is shown in Fig.3. It is apparent that the additional early readout in eS2 can benefit relaxometry performance significantly. White matter relaxometry in the subjects is seen in Tab. 2 including the root-mean-square (RMS) of the fit errors.Discussion
In vivo results show the expected weightings in both image sets and the parameter estimates agree well with the literature regardless of the relaxometry method used.9 Nevertheless, judging by the RMS fitting error, relaxometry based on eS2 outperforms eS1 in this group of subjects, if both T2f and T2s are obtained from TQ signal: a fourfold reduction of the RMS fitting error is observed for T2f, (twofold for T2s) in this subject group (Tab.2). The additional echo in eS2 not only offers one additional SQ/TQ image with significantly greater SQ signal, but also has a positive impact on the possible outcome of data fitting to SQ and TQ images, in particular since this readout can be located well before the emerging peak of the TQ signal. Combining eS2 and relaxometry method 2 potentially improves any compartmental sodium quantification method based thereupon. Additionally, the FLORET scheme in the MQF signal enables the use of acceleration techniques such as compressed sensing.Conclusion
An optimised eSISTINA sequence consisting of two sets of FLORET readouts with an early MQF echo for optimal relaxometry has been implemented, verified and compared to a conventional multi-echo gradient echo based eSISTINA sequence in four volunteers. While in this case, both sequences produce convincing relaxation parameter estimates with both fitting methods, the optimised sequence in conjunction with fitting method 2 is the better choice for relaxometry investigations.Acknowledgements
No acknowledgement found.References
1. Madelin G, Lee JS, Regatte RR, Jerschow A. Sodium MRI: methods and applications. Prog Nucl Magn Reson Spectrosc. 2014;79:14-47.
2. Rooney WD, Springer CSJ. A comprehensive approach to the analysis and interpretation of the resonances of spins 3/2 from living systems. NMR Biomed. 1991;4:209-226.
3. Nagel AM, Bock M, Hartmann C, et al. The potential of relaxation-weighted sodium magnetic resonance imaging as demonstrated on brain tumors. Invest Radiol. 2011;46(9):539-547.
4. Fiege DP, Romanzetti S, Mirkes CC, Brenner D, Shah NJ. Simultaneous single-quantum and triple-quantum-filtered MRI of 23Na (SISTINA). Magn Reson Med. 2013;69(6):1691-1696.
5. Worthoff WA, Shymanskaya A, Shah NJ. Relaxometry and quantification in simultaneously acquired single and triple quantum filtered sodium MRI. Magn Reson Med. 2019;81:303-315.
6. Pipe JG, Zwart NR, Aboussouan EA, Robison RK, Devaraj A, Johnson KO. A new design and rationale for 3D orthogonally oversampled k-space trajectories. Magn Reson Med. 2011;66(5):1303-1311.
7. Fessler JA, Sutton BP. Nonuniform fast Fourier transforms using min-max interpolation. IEEE Trans Signal Process. 2003;51(2):560-574.
8. Worthoff WA, Shymanskaya A, Lindemeyer J, Langen KJ, Shah NJ. Relaxometry and quantification in sodium MRI of cerebral gliomas: A FET-PET and MRI small-scale study. NMR Biomed. 2020;33(10):e4361.
9. Blunck Y, Josan S, Taqdees SW, et al. 3D-multi-echo radial imaging of 23Na (3D-MERINA) for time-efficient multi-parameter tissue compartment mapping. Magn Reson Med. 2018;79(4):1950-1961.
Figures
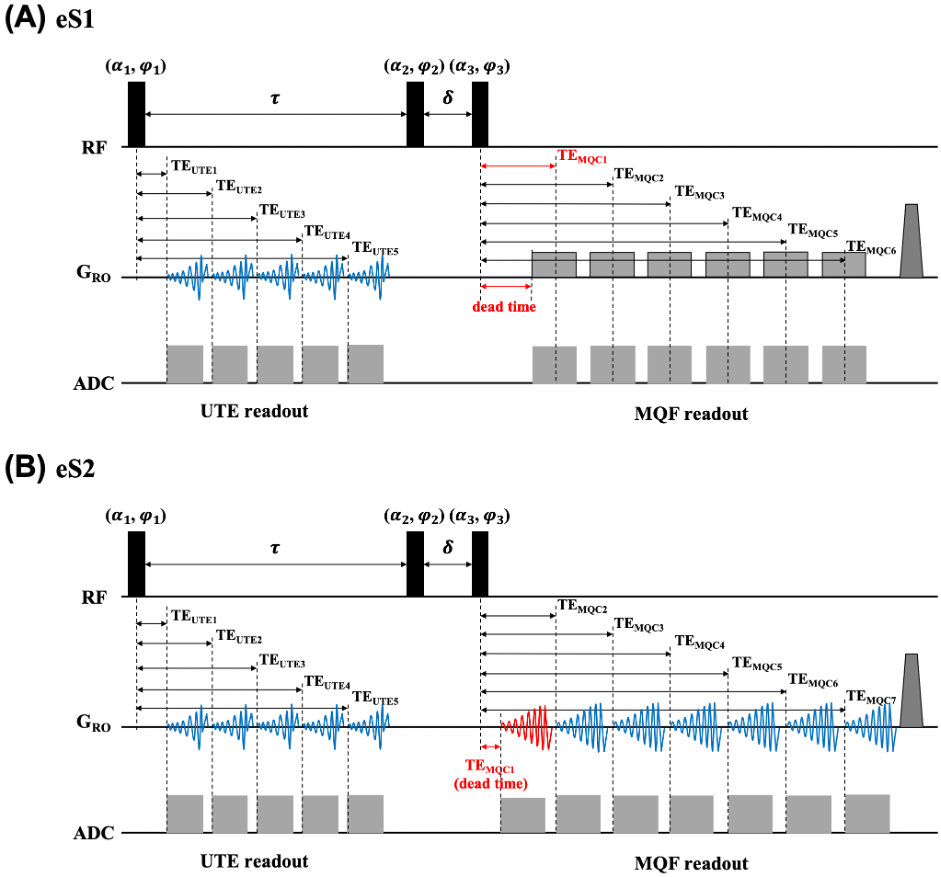
FIG. 1: Diagrams of two eSISTINA sequences. (A) conventional eSISTINA sequence with six-echo Cartesian MQF readouts (eS1). (B) optimised eSISTINA sequence with seven-echo FLORET MQF readouts (eS2).
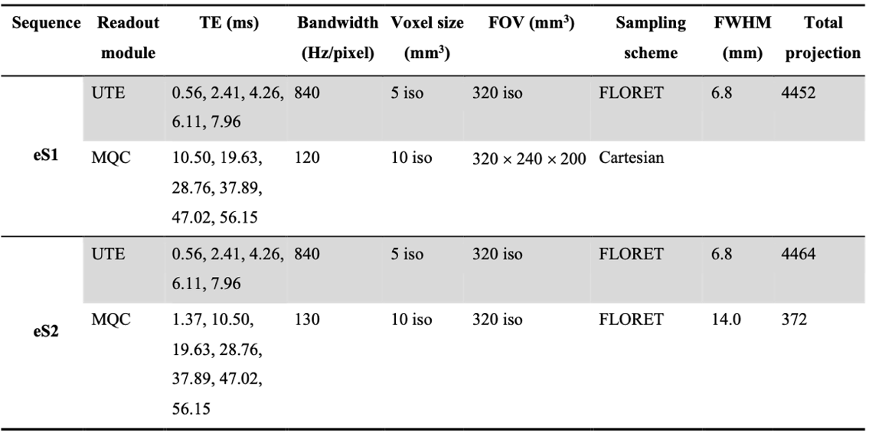
TAB. 1: Parameters of conventional eSISTINA sequence (eS1, repetition time = 150 ms, total acquisition time = 11 min 8 s) and optimised eSISTINA sequence (eS2, repetition time = 150 ms, total acquisition time = 11 min 10 s). FWHM = full-width-half-maximum.
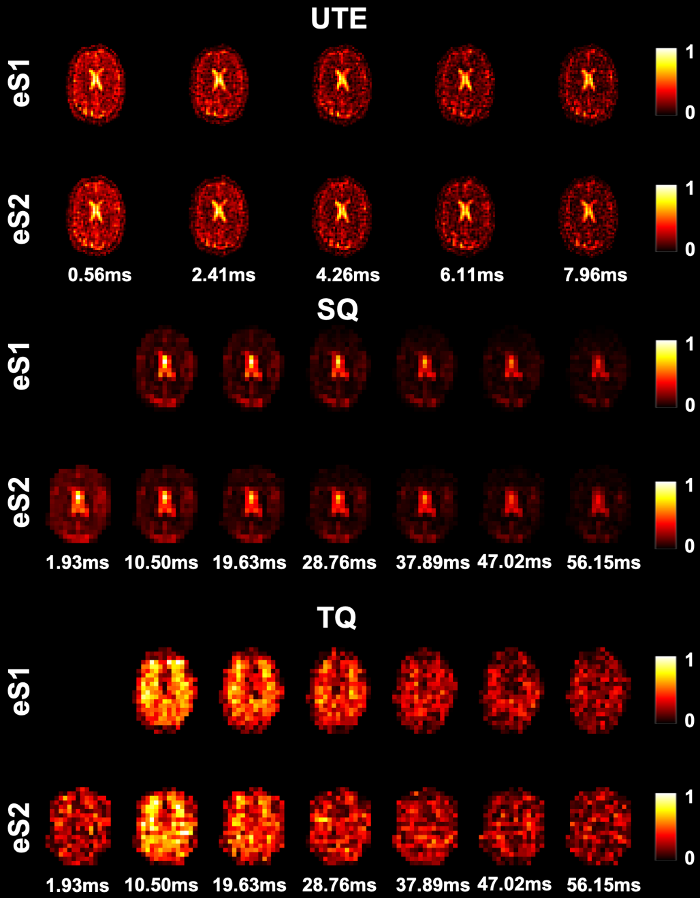
FIG. 2: SISSTINA images obtained from conventional (eS1) and optimised (eS2) eSISTINA sequences. The images were acquired from the brain of a 51-year-old male subject.
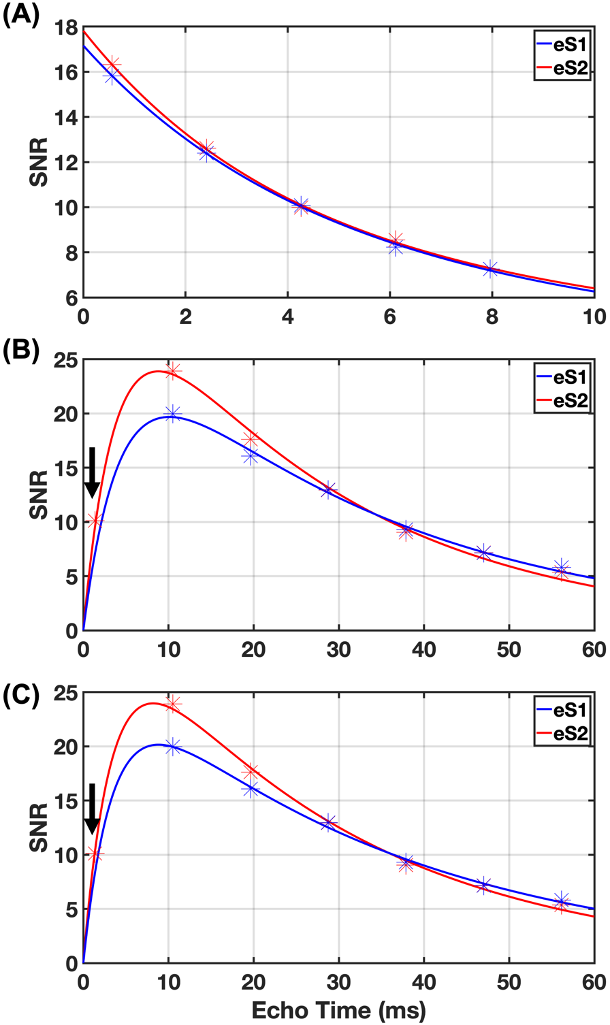
FIG. 3: Fitting of UTE and TQ signal decays in white matter of a 51-year-old male subject with conventional (eS1, blue curve) and optimised (eS2, red curve) eSISTINA sequences. In Method 1, (A) UTE signal decay was used to obtain a T2f value, which was used in the TQ fit (B) to obtain the T2s value. In Method 2, only (C) TQ signal decay was used to fit both T2f and T2s values. The arrow points to additional data point obtained from the early FLORET MQF readout.
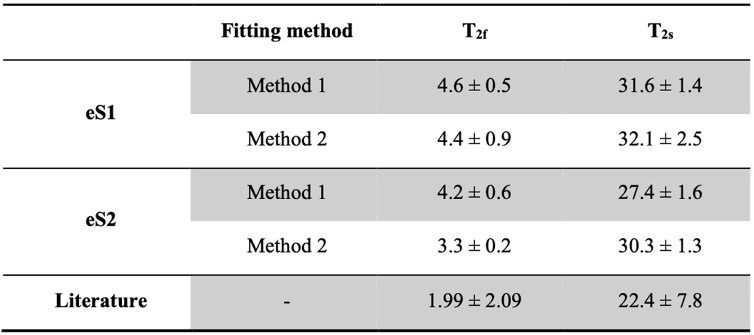
TAB. 2: Relaxometry results in white matter and literature values. The mean ± error values obtained from conventional (eS1) and optimised (eS2) eSISTINA sequences indicate the average fitting value of fast (T2f) and slow (T2s) transversal relaxation times and the RMS of the fit errors. In Method 1, both UTE and TQ signal decays were used to fit T2f and T2s. In Method 2, only TQ signal decay was used to obtain T2f and T2s. The literature values are taken from Blunck et al, 2018.9