4724
Skin Sodium Concentration Measurement Increased with Surface-Coils, Higher Resolution Voxel Reshaping, and Lower Flip-Angles1Biomedical Engineering, University of Alberta, Edmonton, AB, Canada
Synopsis
Keywords: Non-Proton, Body
Non-proton (23Na) MRI studies have measured greater body tissue (skin) sodium concentration in disorders such as hypertension, diabetes, and chronic kidney disease, but literature values of ~15 mM are well below the 77 mM from atomic absorption spectroscopy. Previous studies have used gradient-echo imaging with long TE=2 ms, knee volume-coils, and large 3×3×30=270 mm3 voxels. Here, short TE=0.1 ms twisted projection imaging is used, and signal loss is progressively lowered with surface coil imaging, reshaped 0.4x4x4 = 6.4 mm3 voxels, and lower 60o flip-angle excitation, ultimately yielding 42 mM calf skin measurement in 10 young adults.
Introduction
Sodium (23Na) MRI of the human calf has measured greater skin sodium in pathologies such as aldosteronism1, hypertension2, type 2 diabetes3, and chronic kidney disease with left ventricular hypertrophy4. Skin sodium differences in controls with sex1 and age2 has also been observed. However, these studies used 2D gradient echo imaging with long TE=2 ms and knee volume-coils limiting signal-to-noise ratio (SNR) and large 3×3×30 = 270 mm3 voxels yielding low resolution sodium images not ideal for thin skin (1-2 mm thick). The purpose here was to improve the measurement of skin sodium concentration using 3D twisted projection imaging (TPI) with ultra-short TE~0.1 ms, voxel size reduction (aided by greater SNR efficiency of surface coils5), voxel reshaping (tailored to thin skin), and lower flip-angle excitation (for suspected residual quadrupole splitting in skin6).Methods
Sodium images of calf skin were acquired in 10 healthy young adults (5 female, 24±1 years; 5 male, 25±3 years) on a Varian Inova 4.7T using either a home-built birdcage knee volume-coil (17.8 cm diameter, 10 cm length) or a home-built transmit-receive 5 cm diameter surface-coil. The calf was rested on a flat surface 0.5 cm above the surface-coil while a 60 mM sodium, 5% agar calibration phantom (filling a 90 mm diameter, 15 mm thick Petri dish) was placed 0.5 cm below the coil. Symmetric B1 was verified using two agar phantoms (above and below). 23Na volume images were acquired with the calf resting on a platform within the knee-coil; the same calibration phantom was placed 0.3 cm below the platform (with close proximity to skin for B1 equivalency). Proton images were acquired with a T1-weighted fat-saturated gradient-echo sequence (0.2×0.2×5 mm3 resolution, TR=7.4 ms, TE=3.0 ms, 6o flip-angle, 4 min scan) on a Siemens 3T Prisma to measure skin thickness. Each leg was marked and aligned to iso-center for consistent imaging locations.Each participant underwent four (one volume-coil and three surface-coil) 23Na scans with 6000 TPI trajectories of 9 ms duration, TR=120 ms, TE~0.1 ms, and 12 min scan time (Table 1). The typical ‘baseline’ scan VolCoilPen90 used 1.5×1.5×15=34 mm3 (‘pencil’) voxels with flip-angle=90o. The SurfCoilPen90 protocol also had ‘pencil-like’ voxels albeit 5x smaller (0.8×0.8×10=6.4 mm3) with flip-angle=90o. The SurfCoilPan90 protocol had ‘pancake-like’ voxels (0.4×4×4=6.4 mm3) with thinner dimensions across the skin and flip-angle=90o, while SurfCoilPan60 used a flip-angle=60o.
All sodium images were zero-filled to a 320 isotropic matrix to facilitate manual region of interest (ROI) analysis. A custom tool (MATLAB) was used to create thin angled box ROIs centered on the skin. The same ROI was used for the 3 surface-coil images, while the ROI was redrawn for the volume-coil images. Similar ROIs were used to measure signal in the agar phantom at the B1 equivalent surface for calculating apparent Tissue Sodium Concentration (aTSC). A mixed-design repeated-measures analysis of variance followed-up by Bonferroni post hoc tests examined the difference between protocols (within-subjects) and sex (between-subjects).
Results
The average skin thickness was 1.4±0.2 mm. A representative volume coil sodium image of the lower leg from a 23-year-old male yielded aTSC=22.5 mM in skin (Figure 1). The use of a surface coil enabled ~5x smaller ‘pencil’ voxels (0.8 mm voxels across skin) with much better depiction of skin with similar SNR (10.9) as the volume coil (12.1), but yielded a much greater aTSC=34.5 mM in the same volunteer (Figure 2A). Voxel reshaping (same volume) for ‘pancakes’ (0.4 mm voxels across skin) yielded even higher aTSC=39.6 mM (Figure 2B), while excitation flip-angle reduction from 90o to 60o yielded the highest aTSC=44.8 mM (Figure 2C).The above aTSC pattern was also evident over all 10 volunteers: VolCoilPen90 = 19.4±2.4 mM; SurfCoilPen90 = 30.6±4.0 mM; SurfCoilPan90 = 33.9±3.9 mM; SurfCoilPan60 = 42.0±4.5 mM (F3,26=91.6, p < 0.003) (Figure 3). There was no aTSC difference between young adult males and females for any of the four protocols in this preliminary study of 10 volunteers (Figure 4).
Discussion and Conclusions
This abstract demonstrates that skin sodium measurement is highly dependent on imaging protocol. Given the mean skin thickness of 1.4 mm, 1.5 mm thick voxels are partial-volume-averaged with adjacent air and low sodium adipose tissue yielding the lowest value of 19 mM, similar to reported values of~15 mM using 3 mm thick voxels2,7. These errors are reduced with novel 0.4 mm thick ‘pancake’ shaped voxels, narrow across the skin, but bigger along the skin to recover SNR. SNR was also enhanced here by using 4.7T, surface coil, and TPI trajectory for ultra-short TE. Greater aTSC for 60o excitation relative to 90o points to residual quadrupole splitting in skin (as shown in8), which may be expected if sodium ions are held (‘bound’) in a non-osmotic manner in skin9. The most optimized 23Na protocol used the surface coil, 0.4×4×4 mm3 ‘pancake’ voxels, and a 60o excitation to yield 2× higher skin aTSC of 42±5 mM (similar to the 42 mM measured with a surface coil in5). However, this is still substantially below 77±16 mM by atomic absorption spectroscopy of skin samples1. Further investigation of sodium signal loss in skin will verify that pathology-measured aTSC variations reflect sodium concentration and not anatomy (skin thickness) or sodium environment (relaxation/splitting).Acknowledgements
No acknowledgement found.References
1. Kopp C, Linz P, Wachsmuth L, et al. Na-23 magnetic resonance imaging of tissue sodium. Hypertension. 2012;59(1):167-172.
2. Kopp C, Linz P, Dahlmann A, et al. 23Na magnetic resonance imaging-determined tissue sodium in healthy subjects and hypertensive patients. Hypertension. 2013;61(3):635-640.
3. Kannenkeril D, Karg M, Bosch A, et al. Tissue sodium content in patients with type 2 diabetes mellitus. Journal of Diabetes and Its Complications. 2019;33(1):485-489.
4. Schneider M, Raff U, Kopp C, et al. Skin Sodium Concentration Correlates with Left Ventricular Hypertrophy in CKD. J Am Soc Nephrol. 2017;28(6);1867-18765.
5. Linz P, Santoro D, Renz W, et al. Skin sodium measured with 23Na MRI at 7.0 T. NMR Biomedcine. 2014;28(1):54–62.
6. Stobbe R, Beaulieu C. Residual quadrupole interaction in brain and its effect on quantitative sodium imaging. NMR in Biomedicine. 2016;29(2):119–128.
7. Wang P, Deger MS, Kang H, et al. Sex differences in sodium deposition in human muscle and skin. Magn Reson Imaging. 2017;36(1):93-97.
8. Kordzadeh A, Duchscherer J, Beaulieu C, Stobbe R. Radiofrequency excitation–related 23Na MRI signal loss in skeletal muscle, cartilage, and skin. Magnetic Resonance in Medicine, 2019;83(6):1992–2001.
9. Heer M, Baisch, F, Kropp, J, et al. High dietary sodium chloride consumption may not induce body fluid retention in humans. American Journal of Physiology-Renal Physiology. 2000;278(4):F585-95.
Figures
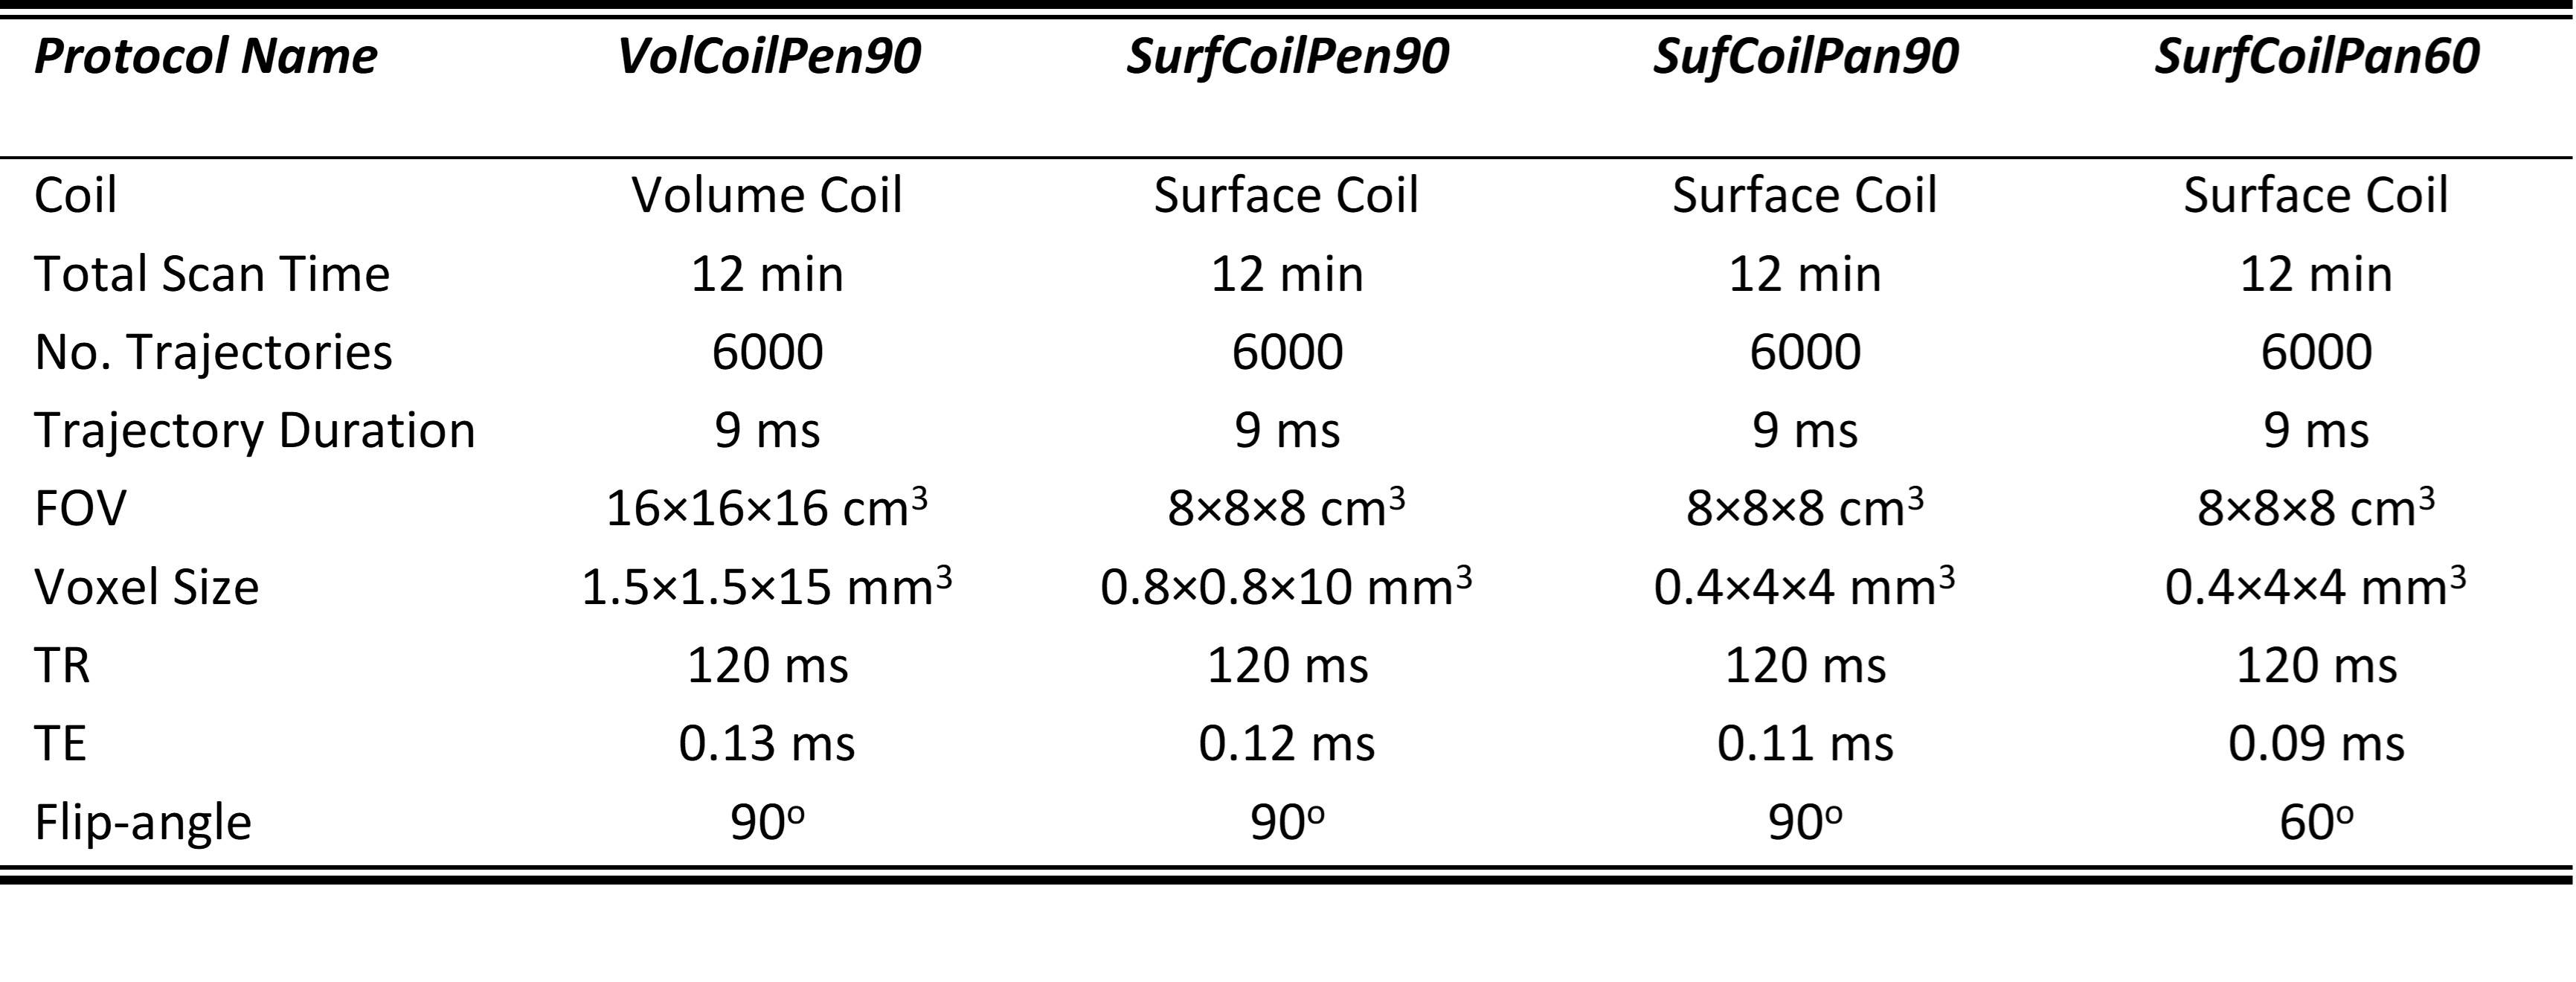
Table 1: A summary of four sodium MRI protocols used for imaging the skin.
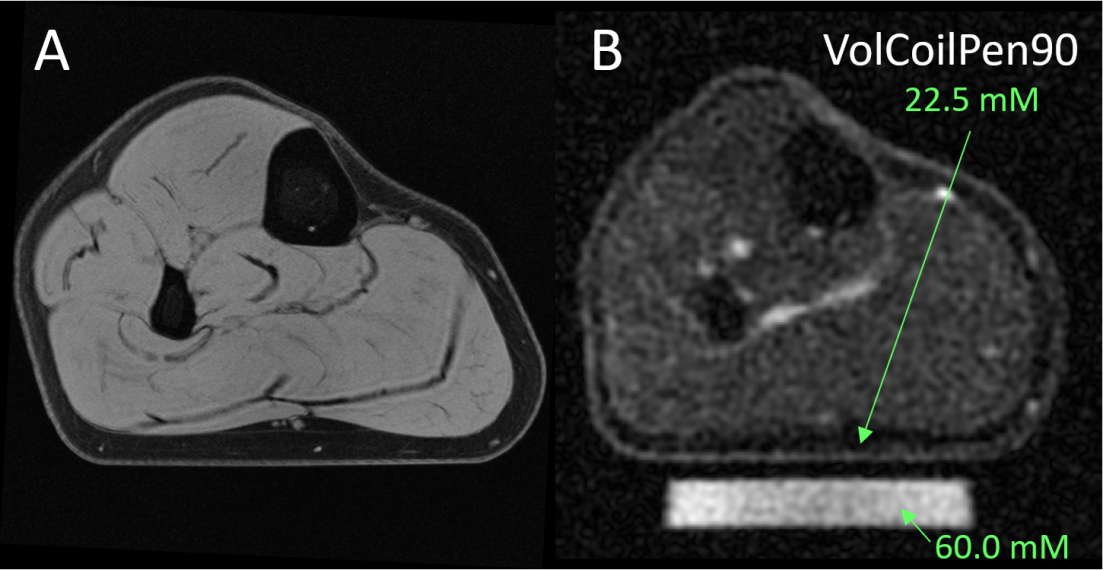
Figure 1: (A) A 1H image from a 23 year old male volunteer yields a skin thickness of 1.4 mm across the pressed flat bottom of the calf. (B) 23Na MRI acquired with the volume RF coil from the same volunteer with the VolCoilPen90 protocol (1.5 mm ‘pencil’ voxels across skin) depicts higher signal in the skin than adjacent fat. The aTSC in in the flat portion of the skin was 22.5 mM relative to the 60 mM sodium agar phantom.
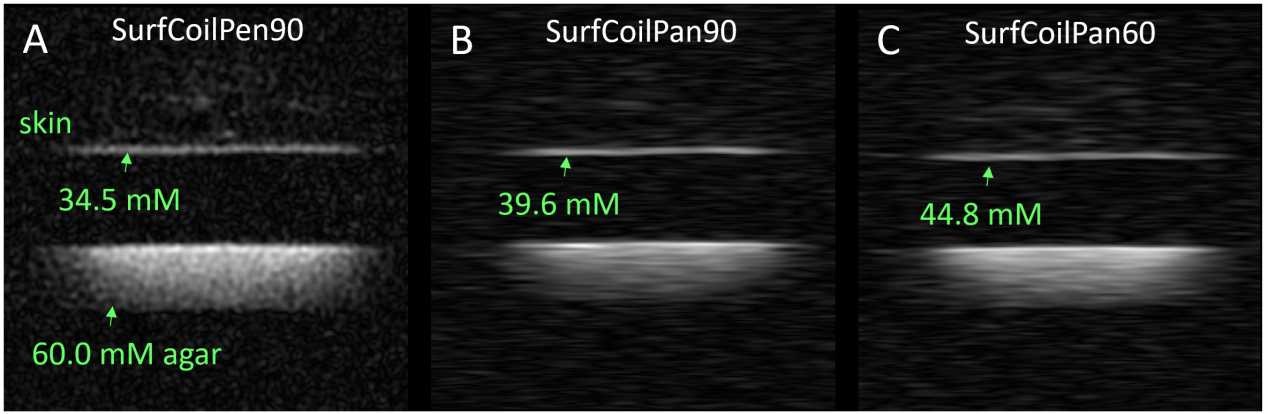
Figure 2: (A) Smaller 0.8 mm ‘pencil’ voxels across skin enabled by a surface RF coil (positioned in the space between the skin above and the agar below) yield much better depiction of the skin with a larger TSC = 34.5 mM than obtained from the volume coil image for the same volunteer in Figure 1B. (B) Voxel reshaping to ‘pancakes’ with 0.4 mm thickness across the skin (while holding voxel volume constant) yields even higher TSC = 39.6 mM. (C) Flip-angle reduction from 90o to 60o yields the largest TSC = 44.8 mM.
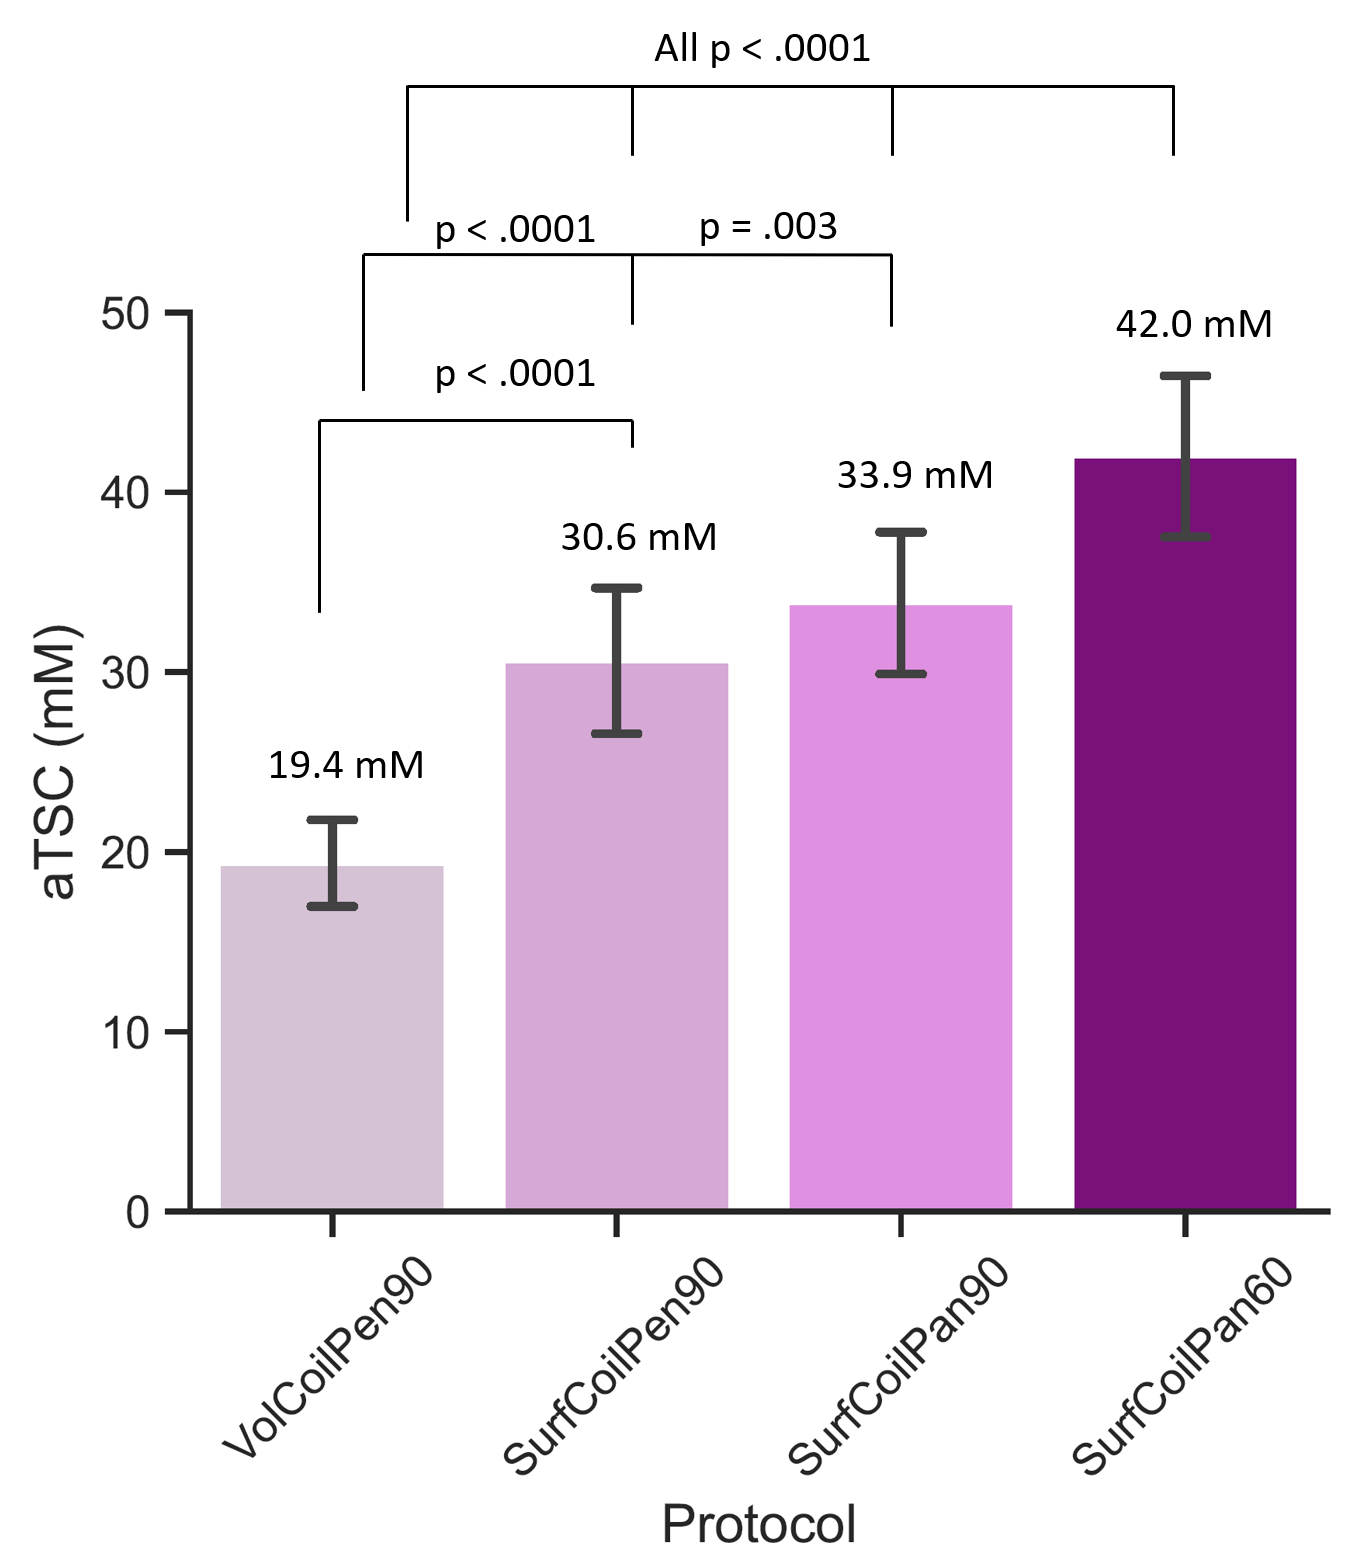
Figure 3: Over all 10 volunteers, the aTSC of the skin increased to a factor of two in a progressive manner over four protocols with the smallest value being from the volume coil protocol. The aTSC was greater for the 5x smaller ‘pencil’ voxels and then even more for the thinner (but same volume) across skin ‘pancake’ voxels. Notably, a 25% greater aTSC was measured when 60o flip-angles were used instead of 90o flip-angles indicating a residual quadrupolar flip-angle effect in skin.
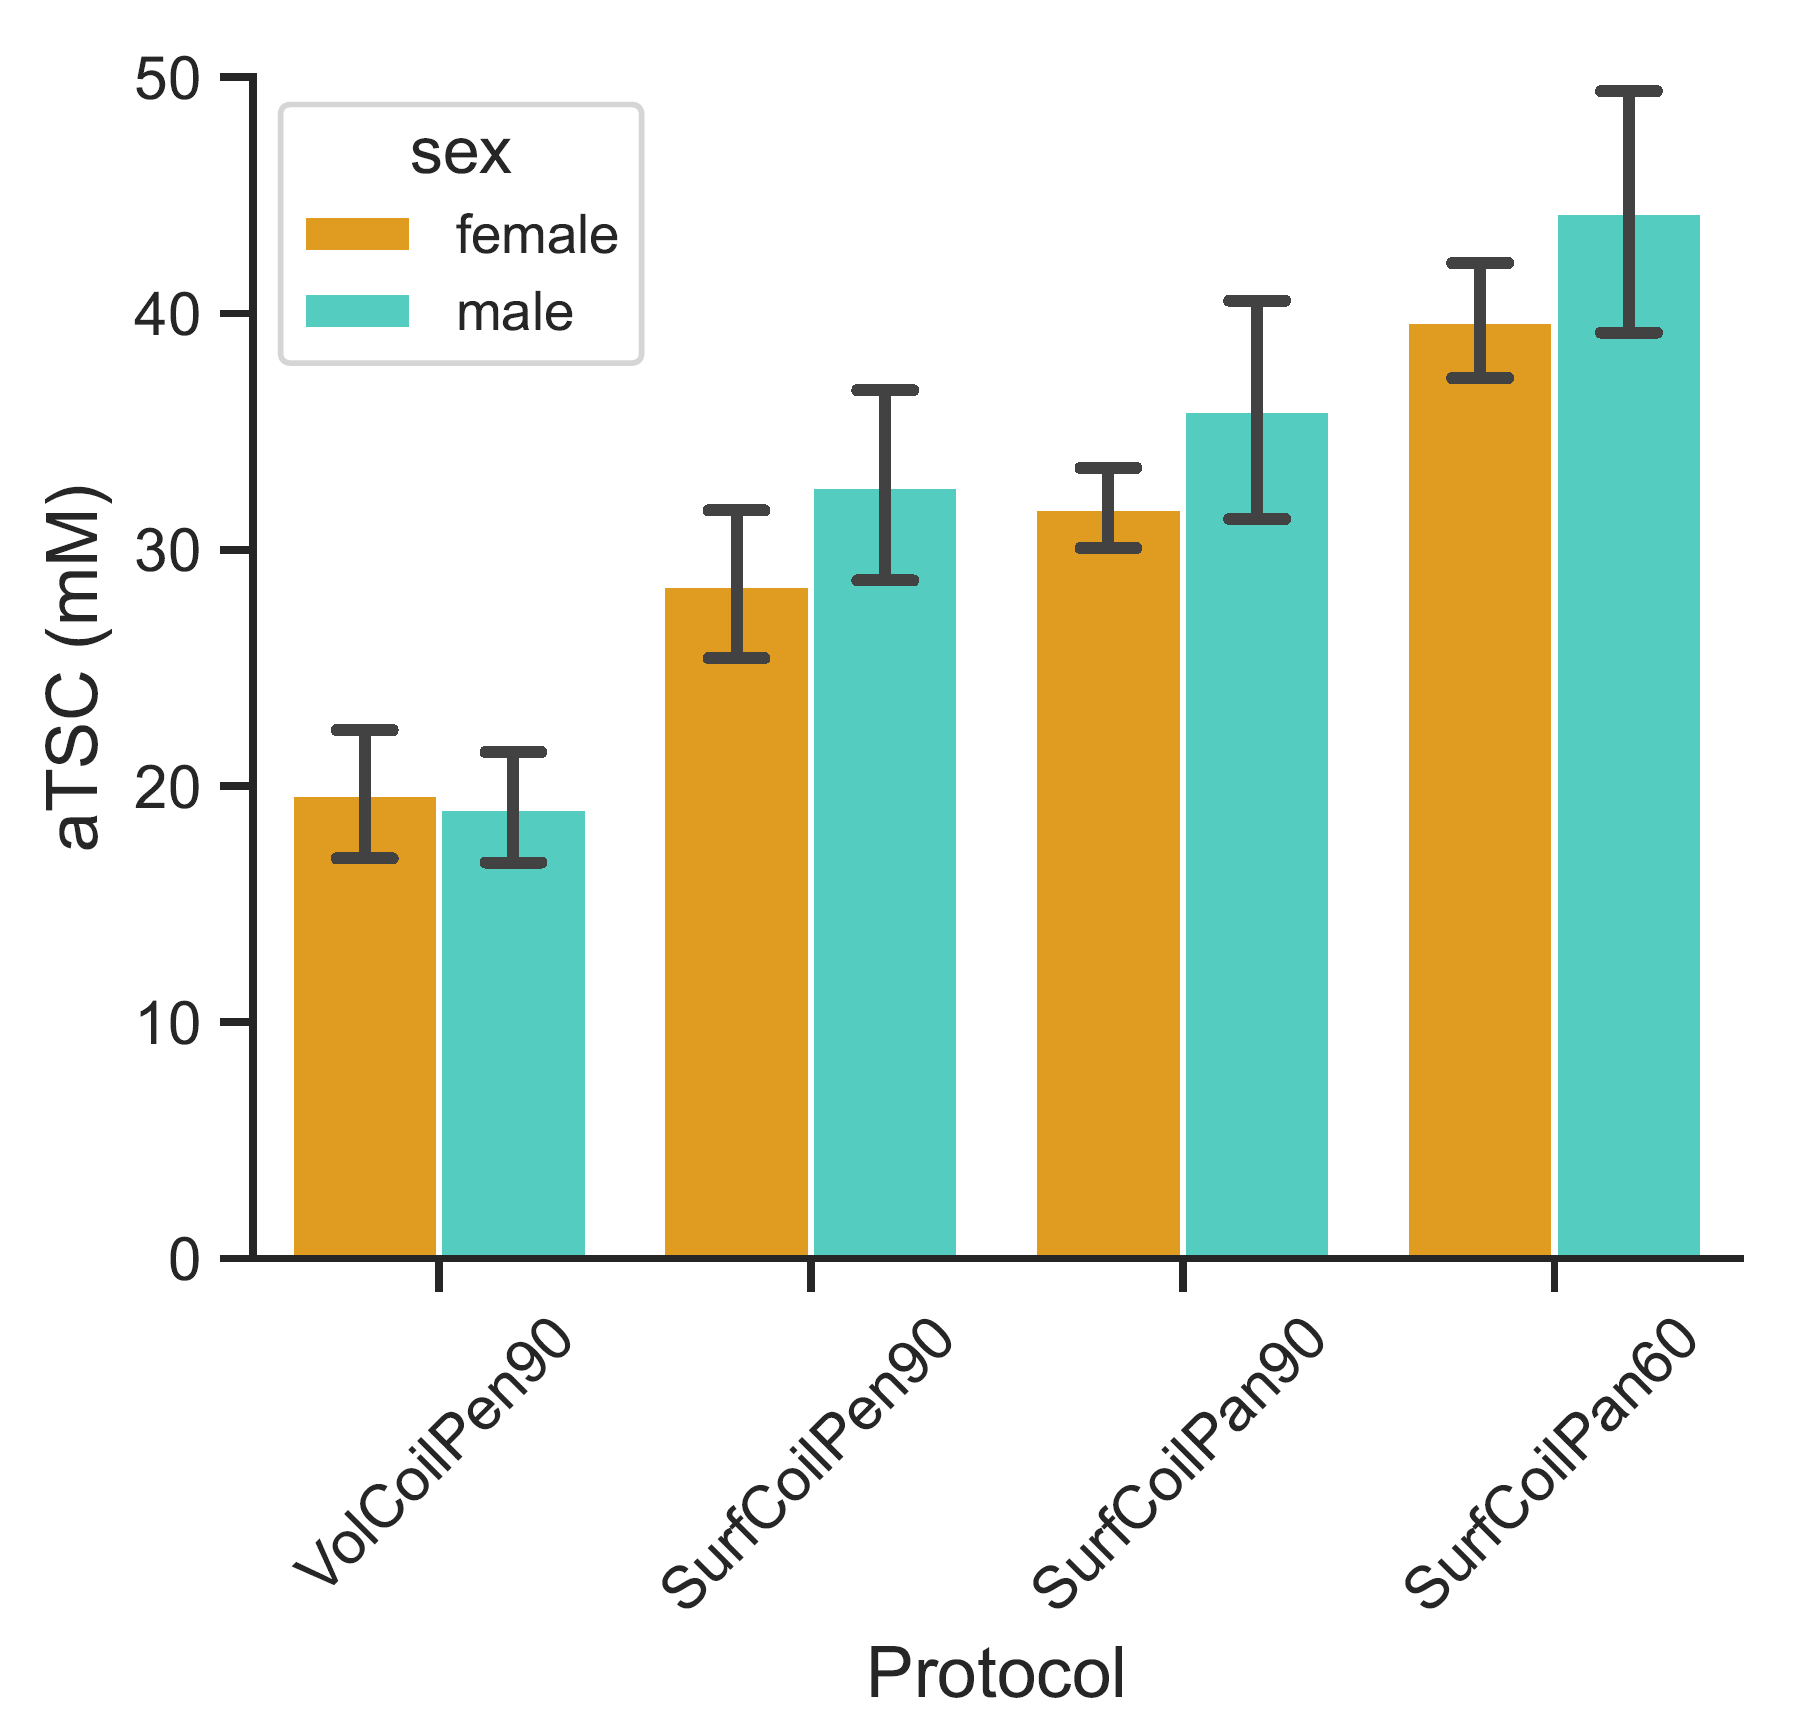
Figure 4: Sodium concentration measurement of males and females. No significant difference in skin TSC was measured between males (n=5) and females (n=5) for any of the sodium imaging protocols (p>0.1).