4723
17O-MRI of the cerebral metabolic rate of oxygen during electrical stimulation of the paws in the rat at 11.7 T1Université Paris-Saclay, CEA, CNRS, MIRCen, Laboratoire des Maladies Neurodégénératives, Fontenay-aux-Roses, France
Synopsis
Keywords: Non-Proton, Metabolism
CMRO2 is an important metric for the evaluation of neurovascular and neurometabolic coupling. However, the degree of coupling between brain activity and CMRO2 remains a matter of debate. In this work, we used 17O-ZTE-MRI at 11.7 T to measure CMRO2 during neuronal activation in the rat primary somatosensory cortex. To improve measurements sensitivity, we acquired data over two consecutive cycles of 17O2 inhalation-washout. We show that a significant functional increase in CMRO2 (+7±5%, p=0.016), and in the rates of metabolized water gain and loss KG (+19±11%, p=0.18) and KL (10±6%, p=0.014) can be detected with good spatial resolution after summation.Introduction
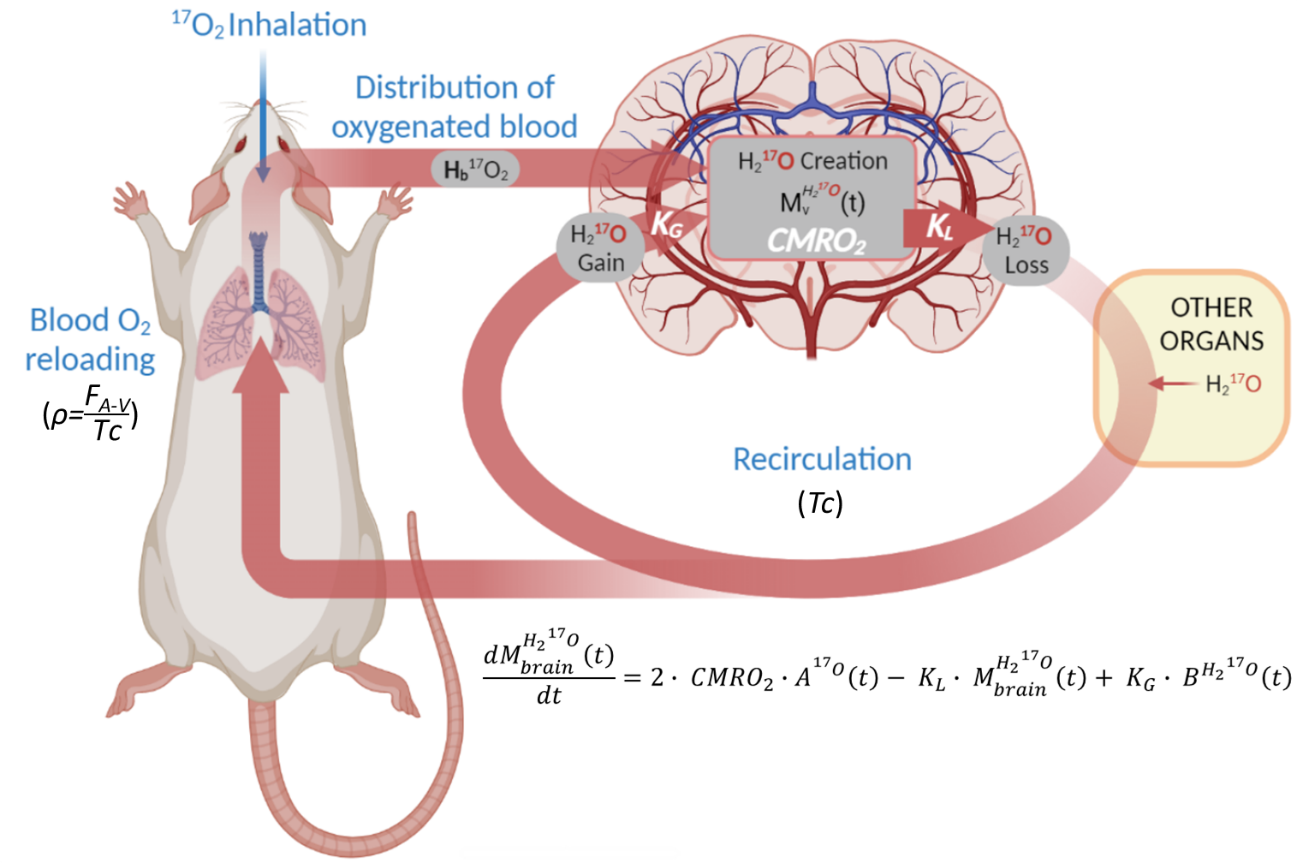
The cerebral metabolic rate of oxygen (CMRO2) is an important metric for the evaluation of neurovascular and neurometabolic coupling. The degree of coupling between brain activity, CMRO2, and other metabolic fluxes remains a matter of debate1,2. In the rat, literature reported CMRO2 increases of 15%3 to 200%2 during bilateral forepaw activation. To revisit these early experiments, and possibly reconcile conflicting findings, more studies using non-invasive preclinical imaging tools with high spatial resolution are required. The current gold standard for CMRO2 measurements is PET using 15O2 as tracer. However, this technique suffers from an inherently low spatial resolution, precluding regional CMRO2 mapping in rodents. As an alternative, in vivo MRI detection of 17O-labeling of brain water during inhalation of 17O2 gas enables direct CMRO2 measurements without any theoretical spatial resolution limits, provided that 17O MR detection sensitivity is sufficient (fig.1). In this work, we adapted our 17O zero echo time (ZTE) MRI protocol, previously developed for mice4, to measure CMRO2 during neuronal activation in the rat primary somatosensory cortex at 11.7 T. To improve our measurements sensitivity, we summed data acquired over two consecutive cycles of 17O2 inhalation-washout, and we show that a functional increase in CMRO2 can be detected with good spatial resolution.Methods
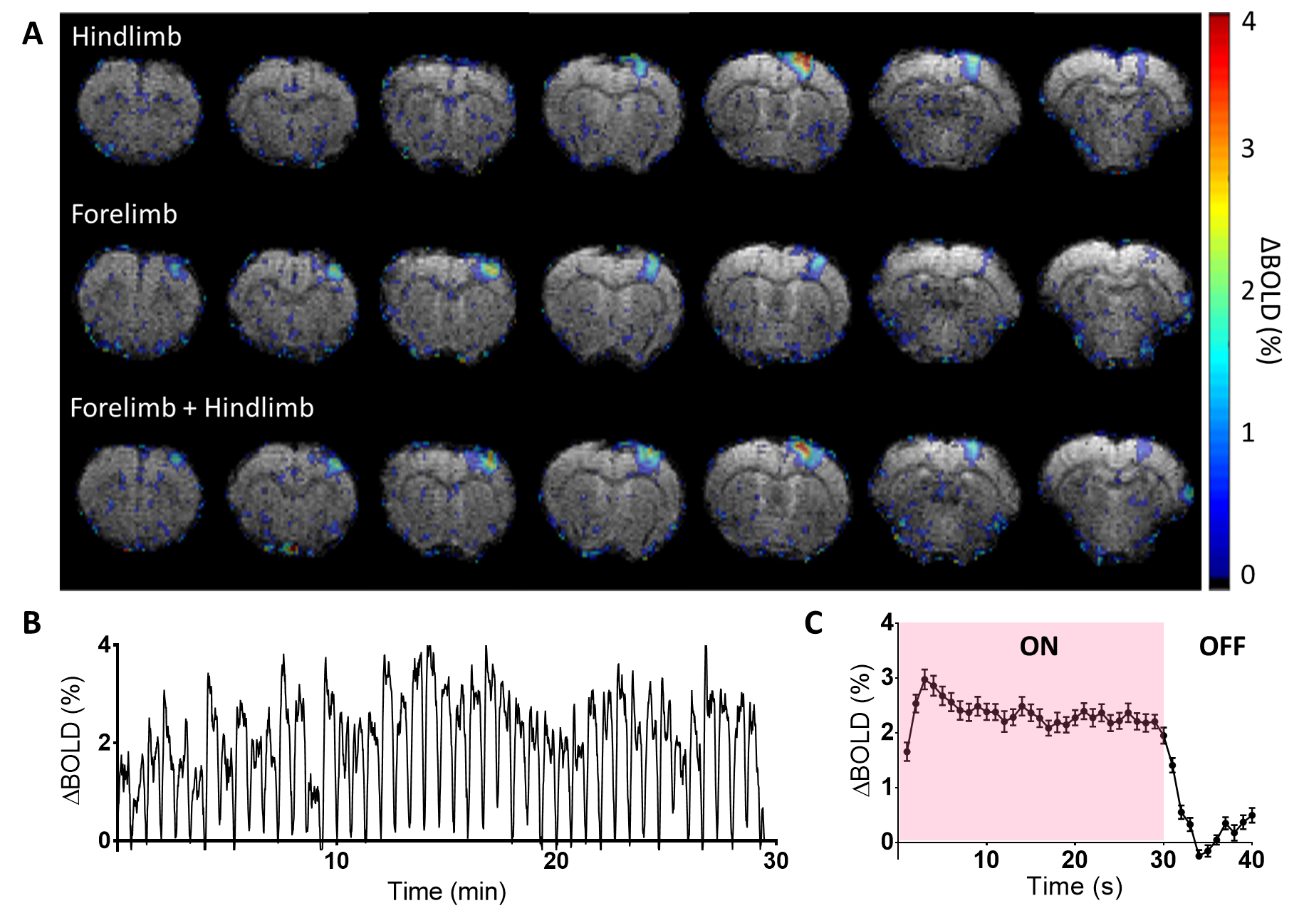
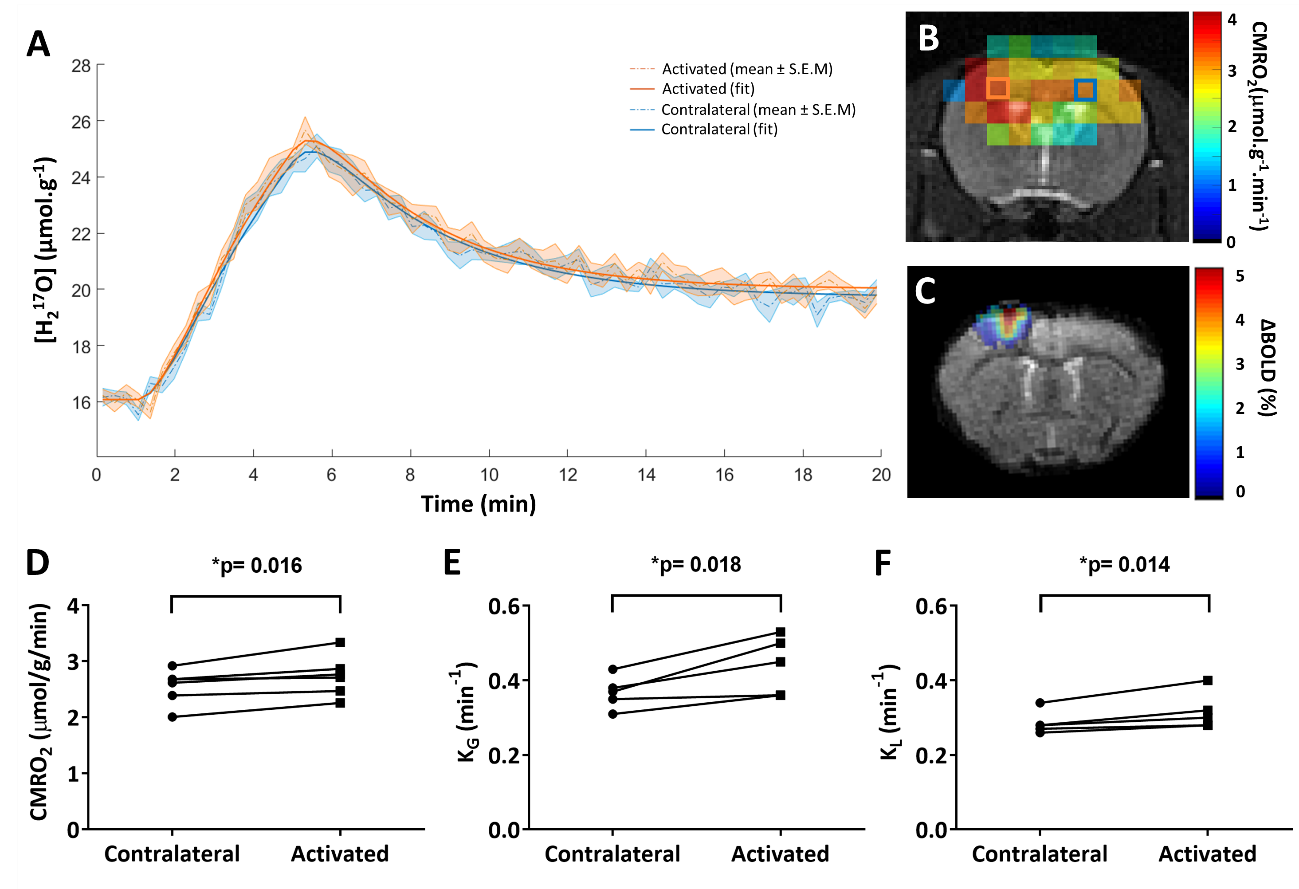
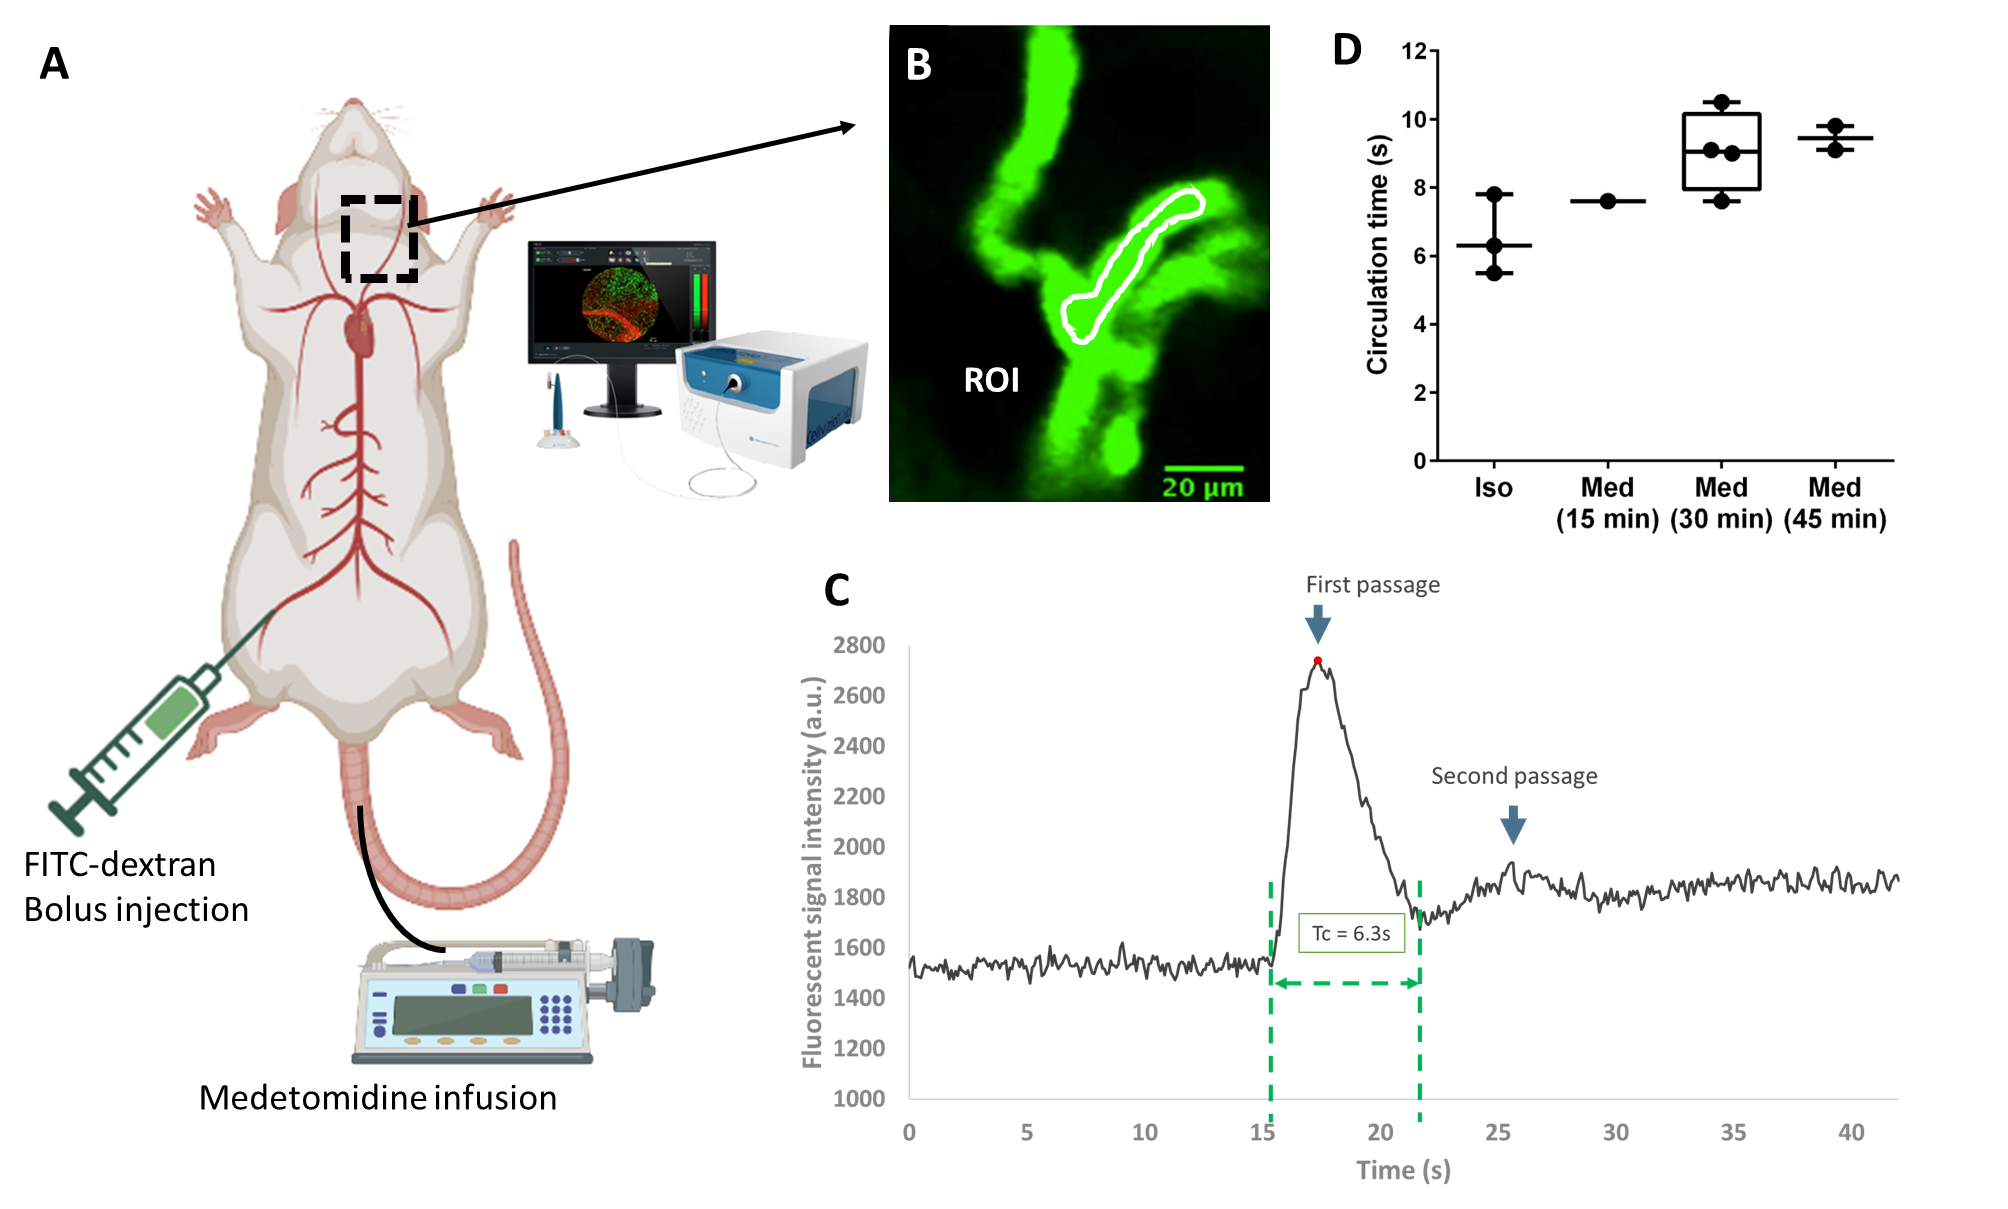
Animals&setup. All data were acquired in female Wistar rats (2-10 months, 240-330 g) under medetomidine anesthesia (0.6 mg.kg-1.h-1 intra-venous infusion) using a 11.7 T Bruker system and a 1H volume coil (72 mm). Either a 17O custom-built Tx/Rx surface coil (10 mm) or a Bruker 1H receive surface coil were placed on top of the head for CMRO2 and BOLD fMRI acquisitions, respectively. Dual forelimb/hindlimb (HL/FL) stimulation was chosen to maximize the cortex activation volume (AM-system, 1.5 mA/limb; 50 µs pulse; 5 Hz) (fig.2). CMRO2 measurements. Our protocol consisted of two consecutive 17O2 inhalation-washout experiments. Series of 17O ZTE-MRI (TR=1.3 ms, voxel size=1.5 mm3, time resolution=18 s) were acquired before (5 to 10 min), during (4 min) and after (15 min) inhalation of 17O2 gas (Nukem Isotopes, 70% enrichment) delivered at 100 mL.min-1. Electrostimulation of the right (n=3) or the left (n=3) HL/FL paws was started 2 min before inhalation. 1H-BOLD fMRI. In 4 rats out of 6, BOLD fMRI data were subsequently collected during the same electrical stimulation paradigm to locate the activated area (single-shot EPI, TR/TE: 1000/15 ms, 250 µm2 in-plane, 750 µm slice thickness). In addition, to demonstrate the stability of neuronal activation over the duration of the experiment, BOLD fMRI was acquired in one rat during a 30 min stimulation (fig.2). Data analysis and CMRO2 quantification. The two series of complex ZTE data acquired in each animal were summed and Hamming filter was applied. A 3-phase model5 was fitted to the data voxel-wise to map CMRO2, KG, and KL rates (fig.3). KG and KL represent the rates of 17O labelled water gain and loss in the voxel, respectively, and are by definition proportional to cerebral blood flow. In addition, because the blood circulation time (Tc) can greatly affect CMRO2 determination and depends on anesthesia, we measured Tc in a separate group of 5 rats in our conditions of anesthesia. Using confocal laser endo-microscopy, we detected the first and second passages of a bolus of fluorescent dextran (FITC) (fig.4). We found Tc=9.2±1.0 s and used this value for quantification. BOLD data were pre-processed with Gaussian spatial filtering. After block normalization and averaging, activated voxels were selected by thresholding (>contralateral signal+2*SD). All statistical group comparisons were computed with a simple paired t-test and statistical significance was set to α=0.05.Results
BOLD signal was increased by up to 3% over a 28.5±3.35 mm3 volume in S1HL/FL, confirming neuronal activation in response to electrical stimulation. This large activated volume allowed the selection of 3 voxels per hemisphere on average on CMRO2 maps. Our results (fig.3) showed that CMRO2 was significantly higher (+7±5%, p=0.016) in the activated S1HL/FL (2.74±0.37 µmol.g-1.min-1) compared to the contralateral side (2.55±0.31 µmol.g-1.min-1). The changes in KG and KL with activation were even greater. KG was 19±11% higher in the activated S1HL/FL (0.44±0.08 min-1) compared to the contralateral side (0.37±0.04 min-1, p=0.018), and KL was 10±6% higher in the activated S1HL/FL (0.32±0.05 min-1) compared to the contralateral side (0.29±0.03 min-1, p=0.014).Discussion
With this work, we demonstrate for the first time the feasibility of functional 17O-MRI based CMRO2 measurements in the activated rat brain. Such experiments had previously only been carried out in cats, where a 30% increase was found in the visual cortex6. Here, combining dual HL/FL electrostimulation to maximize the activated cortex volume, and our strategy of summing two consecutive data sets improved our detection sensitivity. We found a 7% CMRO2 increase and an average 15% increase in flow-related parameters (KG and KL). These results are in line with previous reports of a decoupling between the vascular response and the oxygen metabolism response to activation in the brain, and consistent with a strong BOLD effect.Acknowledgements
The 11.7 T scanner and part of this project were funded by ‘NeurATRIS ANR-11-INBS-0011’, of the French Investissements d’Avenir Program run by the Agence Nationale pour la Recherche, and ‘ANR-21-CE44-0023’ collaborative research grant to CB.References
1. Fox PT. The Coupling Controversy. NeuroImage. 2012;62(2):594-601. doi:10.1016/j.neuroimage.2012.01.103
2. Hyder F, Chase JR, Behar KL, et al. Increased tricarboxylic acid cycle flux in rat brain during forepaw stimulation detected with 1H[13C]NMR. Proc Natl Acad Sci. 1996;93(15):7612-7617. doi:10.1073/pnas.93.15.7612
3. Sonnay S, Duarte JM, Just N, Gruetter R. Compartmentalised energy metabolism supporting glutamatergic neurotransmission in response to increased activity in the rat cerebral cortex: A 13C MRS study in vivo at 14.1 T. J Cereb Blood Flow Metab. 2016;36(5):928-940. doi:10/f8jn3w
4. Baligand C, Barret O, Tourais A, et al. Zero Echo Time 17O-MRI Reveals Decreased Cerebral Metabolic Rate of Oxygen Consumption in a Murine Model of Amyloidosis. Metabolites. 2021;11(5):263. doi:10/gnp8cb
5. Atkinson IC, Thulborn KR. Feasibility of mapping the tissue mass corrected bioscale of cerebral metabolic rate of oxygen consumption using 17-oxygen and 23-sodium MR imaging in a human brain at 9.4T. NeuroImage. 2010;51(2):723-733. doi:10.1016/j.neuroimage.2010.02.056
6. Zhu XH, Zhang N, Zhang Y, Uğurbil K, Chen W. New Insights into Central Roles of Cerebral Oxygen Metabolism in the Resting and Stimulus-Evoked Brain. J Cereb Blood Flow Metab. 2009;29(1):10-18. doi:10.1038/jcbfm.2008.97
Figures