4720
Spatially resolved assessment of 31P metabolite levels in liver metastases with 31P MRSI at 7T1Center for Image Sciences, University Medical Center Utrecht, Utrecht, Netherlands, 2Department of Radiology and Nuclear Medicine, Amsterdam UMC, Amsterdam, Netherlands, 3Department of Medical Oncology, Amsterdam UMC, Amsterdam, Netherlands, 4Imaging and Biomarkers, Cancer Center Amsterdam, Amsterdam, Netherlands, 5Department of Medical Oncology, Utrecht Medical Center Utrecht, Utrecht, Netherlands
Synopsis
Keywords: Non-Proton, Cancer
Methods for early treatment response evaluation to systemic therapy of liver metastases are lacking. Tumor tissue is characterized by an increased PME/PDE ratio. However, with commonly used 31P surface coils for liver 31P MRS, the liver is not fully covered. Using an integrated 31P whole-body transmit coil in combination with a 16-channel body receive array at 7T, we were able to spatially map 31P metabolite levels throughout the whole liver in a patient with liver metastases. We found highly elevated levels of both PE/ATP and PC/ATP in liver metastases in comparison with healthy liver tissue.Introduction
Methods for the evaluation of early treatment response to systemic therapy of liver metastases are currently lacking. With phosphorus magnetic resonance spectroscopy (31P MRS), signals from both cell membrane precursors (phosphomonoesters; PMEs) and cell membrane degradation products (phosphodiesters; PDEs) can be detected. Tumor tissue is characterized by an increased PME/PDE ratio, which is an indication of cell proliferation. In breast cancer a decrease in this ratio during therapy has been demonstrated to be a marker of therapy response1–3. The liver is a common site for metastases from many cancer types4. However, commonly used 31P surface coils for liver 31P MRSI do not provide full coverage of the liver. Recently, we have shown that with the use of a 31P whole-body transmit coil and a 31P body receive array at 7T, 31P MRSI acquisitions can be obtained with full liver coverage and good-to-excellent repeatability in healthy subjects. Here we present a case study, in which this setup was used to quantify 31P metabolites in multiple metastases throughout the liver in a patient with hepatic metastasis of oesophageal cancer, before and after one cycle of chemotherapy.Methods
A patient with hepatic metastasis of oesophageal cancer (male, 67 years, 4 liver metastases) was scanned twice in supine position using a whole-body 7T MR system (Philips Healthcare, Best, NL) with an integrated 31P whole-body birdcage transmit coil (diameter 60cm, 120.6MHz5). The first scan was performed before start of chemotherapy and the second scan two weeks after the first cycle of carboplatin and capecitabine. 31P signals were received with a local body array, containing 16 31P loop coils integrated with 8 fractionated 1H dipole antennas6,7. Image-based B0 shimming was performed and transversal and coronal T1-weighted images were acquired. 31P spectra were acquired with a 3D MRSI sequence (FOV=500(LR)×280(AP)×360(FH)mm3, nominal resolution=20mm isotropic, TR=60ms, acquisition delay=0.50ms, BW=5000Hz, FA=12°, NSA=20, acquisition time=22:37min) with Hamming weighted k-space sampling without respiratory gating, using a block pulse for excitation (carrier frequency set to phosphocreatine, B1=10μT). 31P MRSI data were reconstructed in Matlab. PCA-based denoising8 was applied before Roemer channel combination9. Signals from α-ATP, β-ATP (not reported, because of limited bandwidth of excitation pulse), γ-ATP, inorganic phosphate (Pi), glycerophosphocholine (GPC), glycerophosphoethanolamine (GPE), phosphocholine (PC), phosphoethanolamine (PE), nicotinamide adenine dinucleotide (NADH), uridine diphosphate glucose (UDPG), phosphatidylcholine (PtdC), and phosphocreatine (PCr) were fitted with AMARES10 using OXSA11,12 (Lorentzian line shapes with equal line widths, soft constraints for the chemical shifts and fixed J-couplings for the ATP doublets and triplets). Four metastasis masks were manually drawn on the transversal T1-weighted images. For further quantitative analysis of 31P metabolites, only voxels in the metastasis masks with fitted PCr and PtdC amplitude smaller than the α-ATP amplitude (to filter out muscle and gall bladder contaminated voxels) were considered. Fitted metabolite signal amplitudes were normalized with respect to γ-ATP and were averaged over all voxels within each metastasis mask. Data was compared with liver 31P MRSI data previously acquired in healthy subjects13.Results
Figure 1 shows T1-weighted MRI scans of a healthy subject and of the patient(annotated with the locations of the different metastases), and 31P MR spectra for healthy liver and for each metastasis in the patient. On average, 20/29 voxels were included for metastasis 1 for scan 1/scan 2, 3/3 voxels for metastasis 2, 18/15 voxels for metastasis 3, and 4/7 voxels for metastasis 4. Figures 2 and 3 show the mean quantified 31P metabolite levels with respect to γ-ATP for each metastasis for both scan 1 and 2, in comparison with average values for healthy liver previously determined in 10 healthy volunteers13. The largest differences between metastases and healthy liver tissue were observed for both PMEs (PC and PE), while the levels of the PDEs (GPC and GPE) were relatively similar between healthy and metastatic tissue. In all four metastases, 31P metabolite levels before and after therapy were comparable. PC and PE metabolite maps were made for each metastasis mask to assess the spatial distribution of these metabolites in the different metastases (Figure 4). It can be noticed that metastasis 1 (green) is more heterogeneous than the other metastases.Discussion and conclusion
In this case study, we demonstrate the simultaneous assessment of 31P metabolite levels in multiple metastases throughout the liver. Compared with healthy liver tissue, the most pronounced differences were observed for PC/ATP and PE/ATP, which were both largely increased in all four metastases. This is in contrast to breast cancer, where PE is much more elevated than PC3. For GPC/ATP and GPE/ATP, no large differences were observed and interestingly, PC/ATP and PE/ATP seem more sensitive markers for liver metastatic tissue than the PME/PDE ratio. One cycle of chemotherapy did not lead to decreases in PC/ATP and PE/ATP and, in correspondence, clinical observations (clinical CT after 9 weeks) showed disease progression for this patient. The largest metastasis showed significant spatial heterogeneity of PC/ATP and PE/ATP. In conclusion, 31P MRSI with a 31P whole-body transmit coil and a 31P body receive array at 7T provides a viable tool for spatially resolved assessment of 31P metabolite levels in liver metastases, which could have potential for the evaluation of early therapy (non-)response.Acknowledgements
H2020-FETopen:NICIReferences
1. Schmitz AMT, Veldhuis WB, Menke-Pluijmers MBE, et al. Preoperative indication for systemic therapy extended to patients with early-stage breast cancer using multiparametric 7-tesla breast MRI. PLoS One. 2017;12(9). doi:10.1371/journal.pone.0183855
2. Krikken E, van der Kemp WJM, van Diest PJ, et al. Early detection of changes in phospholipid metabolism during neoadjuvant chemotherapy in breast cancer patients using phosphorus magnetic resonance spectroscopy at 7T. NMR Biomed. 2019;32:9.
3. van der Kemp WJM, Stehouwer BL, Luijten PR, Van Den Bosch MAAJ, Klomp DWJ. Detection of alterations in membrane metabolism during neoadjuvant chemotherapy in patients with breast cancer using phosphorus magnetic resonance spectroscopy at 7 Tesla. Springerplus. 2014;3:7.
4. DiSibio G, French SW. Metastatic Patterns of Cancers. Arch Pathol Lab Med. 2008;132(6):931-939. http://www.archivesofpathology.org/doi/pdf/10.1043/1543-2165(2008)132[931:MPOCRF]2.0.CO;2
5. Löring J, van der Kemp WJM, Almujayyaz S, van Oorschot JWM, Luijten PR, Klomp DWJ. Whole-body radiofrequency coil for 31P MRSI at 7T. NMR Biomed. 2016;29(6):709-720. doi:10.1002/nbm.3517
6. Raaijmakers AJE, Italiaander M, Voogt IJ, et al. The fractionated dipole antenna: A new antenna for body imaging at 7 Tesla. Magn Reson Med. 2016;75(3):1366-1374. doi:10.1002/mrm.25596
7. van Houtum Q, Mohamed Hoesein FAA, Verhoeff JJC, et al. Feasibility of 31P spectroscopic imaging at 7 T in lung carcinoma patients. NMR Biomed. 2019;(May 2019):1-8. doi:10.1002/nbm.4204
8. Veraart J, Novikov DS, Christiaens D, Ades-aron B, Sijbers J, Fieremans E. Denoising of diffusion MRI using random matrix theory. Neuroimage. 2016;142:394-406. doi:10.1016/j.neuroimage.2016.08.016
9. Roemer PB, Edelstein WA, Hayes CE, Souza SP, Mueller OM. The NMR Phased Array. Magn Reson Med. 1990;16:192-225.
10. Vanhamme L, Van Den Boogaart A, Van Huffel S. Improved Method for Accurate and Efficient Quantification of MRS Data with Use of Prior Knowledge. J Magn Reson. 1997;129(1):35-43. doi:10.1006/jmre.1997.1244
11. Purvis LAB, Clarke WT, Biasiolli L, Robson MD, Rodgers CT. Line-width constraints in Matlab AMARES using pre-Metabolite T2 and per-Voxel Delta B0. In: In Proceedings of the 22nd Annual Meeting of ISMRM. ; :2885.
12. Purvis LAB, Clarke WT, Biasiolli L, Valkovic L, Robson MD, Rodgers CT. OXSA: An open-source magnetic resonance spectroscopy analysis toolbox in MATLAB. PLoS One. 2017;12(9).
13. van den Wildenberg L, Gursan A, Seelen LWF, et al. Test-retest reliability of in-vivo 31P MRSI of the whole human liver at 7 tesla using a 31P whole-body transmit coil and 16-channel receive array. In: Proceedings of the 2022 Joint Annual Meeting ISMRM-ESMRMB & ISMRT 31st Annual Meeting. ; 2022:2291.
Figures
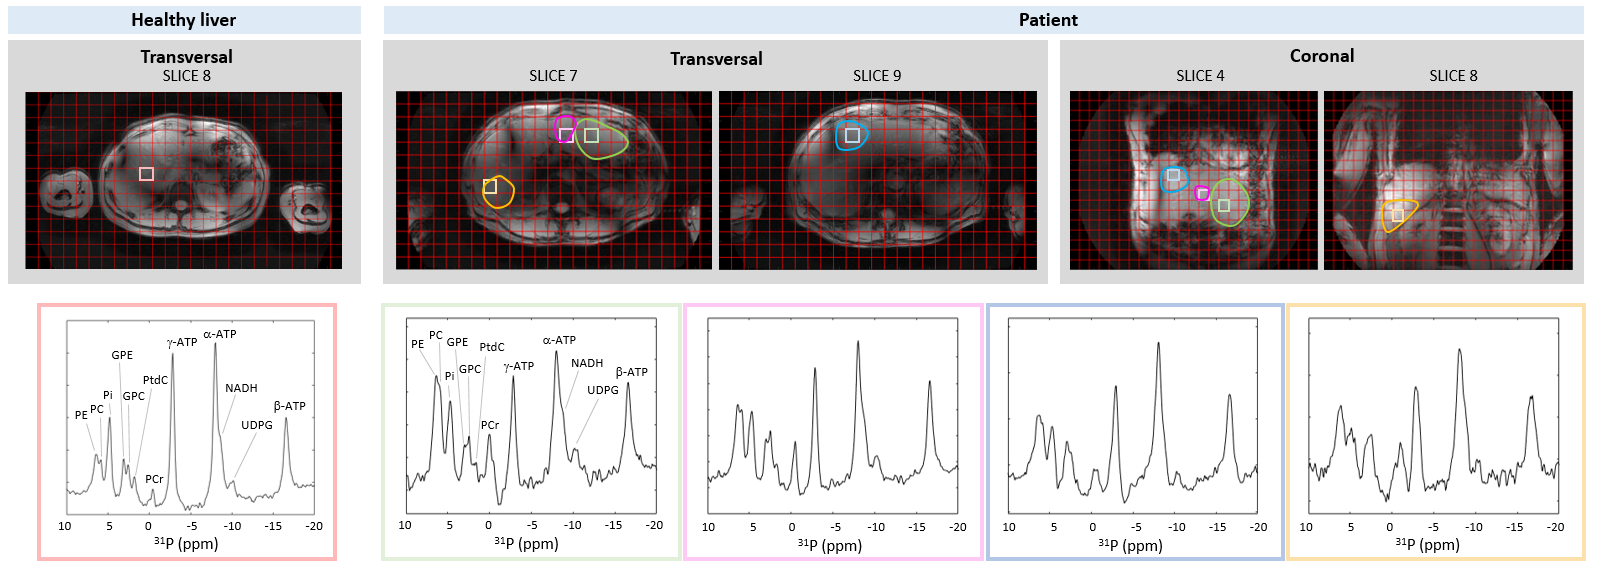
Figure 1: One transversal slice of a T1-weighted MRI scan of a healthy subject, and two slices of the transversal and coronal T1-weighted MRI scans of the patient, with the 31P MRSI grid and the location of the different metastases (metastases 1-4 in green, pink, blue and orange, respectively) in the patient. For the healthy liver and each metastasis in the patient, a representative 31P MR spectrum is shown. Spectra were apodized with 20 Hz and zero-filled to 512 points, only for visualization purposes.
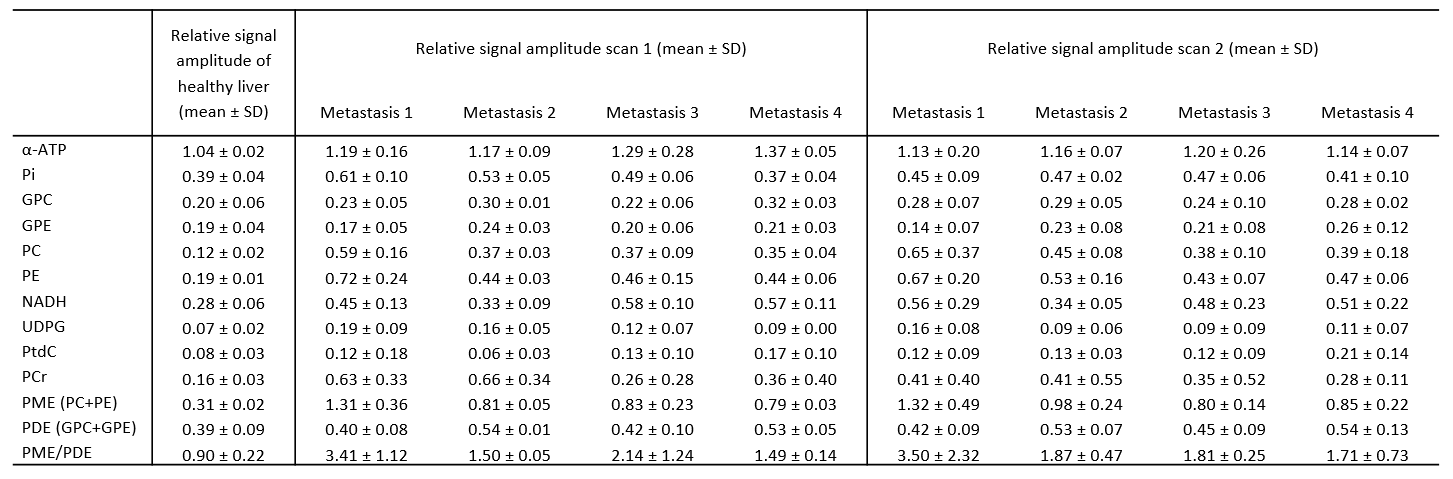
Figure 2: 31P metabolite quantification for healthy liver (averaged over 10 healthy volunteers as previously quantified13) and different metastases of the patient, before (scan 1) and after (scan 2) one cycle of chemotherapy. For the patient, metabolite levels were averaged over all voxels within the different masks. Metabolite levels were normalized with respect to γ-ATP. Total PME and PDE levels and PME/PDE were calculated from the fit results of PC, PE, GPC and GPE signals. SD = standard deviation.
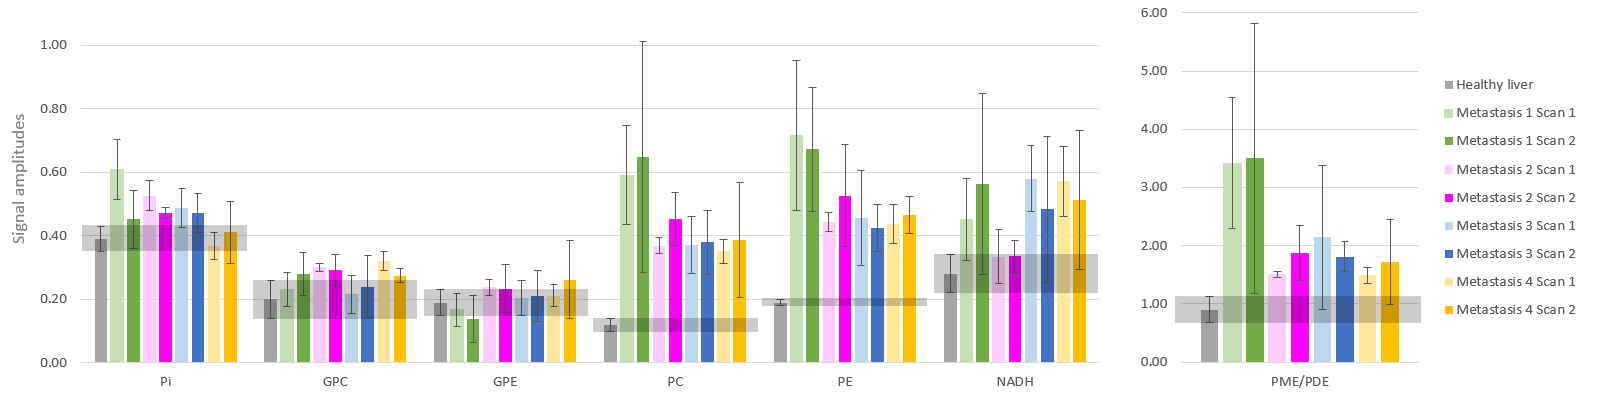
Figure 3: Comparison of the quantified Pi, GPC, GPE, PC, PE, NADH levels, and PME/PDE ratio for healthy liver (averaged over 10 healthy volunteers as previously quantified13) and the different metastases of the patient, before (scan 1) and after (scan 2) one cycle of chemotherapy. For the patient, metabolite levels were averaged over all voxels within the different masks. Metabolite levels were normalized with respect to γ-ATP. The light grey horizontal bars represent the mean healthy liver values ± SD.
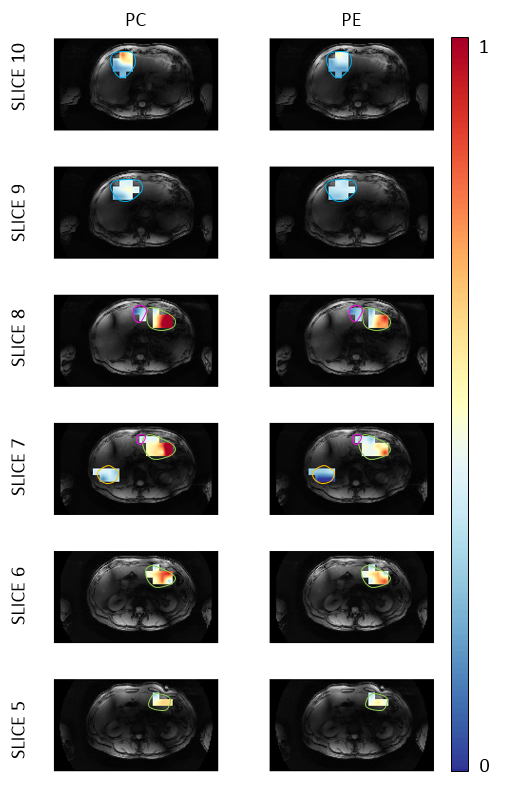
Figure 4: Metabolite maps for PC and PE before the start of chemotherapy for six transversal slices overlaid on the T1-w 7T MRI scan. Approximate outlines of metastases 1-4 are shown in green, pink, blue and orange respectively. The color bar represents the relative signal amplitude with respect to γ-ATP. Metabolite maps were interpolated to the same spatial resolution as the T1-w image by using bilinear interpolation in the axial plane, i.e., the output pixel value is a weighted average of the pixels in the nearest 2-by-2 neighborhood.