4716
23Na Triple Quantum (TQ) Signal Estimation from Single-Pulse Sequence with Single Quantum (SQ) Time Efficiency1Medical Faculty Mannheim, Heidelberg University, Mannheim, Germany, 2National High Magnetic Field Laboratory, Tallahassee, FL, United States
Synopsis
Keywords: Non-Proton, Non-Proton, Sodium, X-Nuclei, Triple-Quantum, TQ, new contrast mechanism
This study demonstrates a method to estimate the biological relevant sodium TQ signal with a single-pulse sequence. Comparison of this method with theory and experiments using TQTPPI sequence showed a close agreement of the TQ signal. Therefore, the TQ signal can be estimated on the time scale of sodium SQ signal acquisition using the proposed sequence.
Introduction
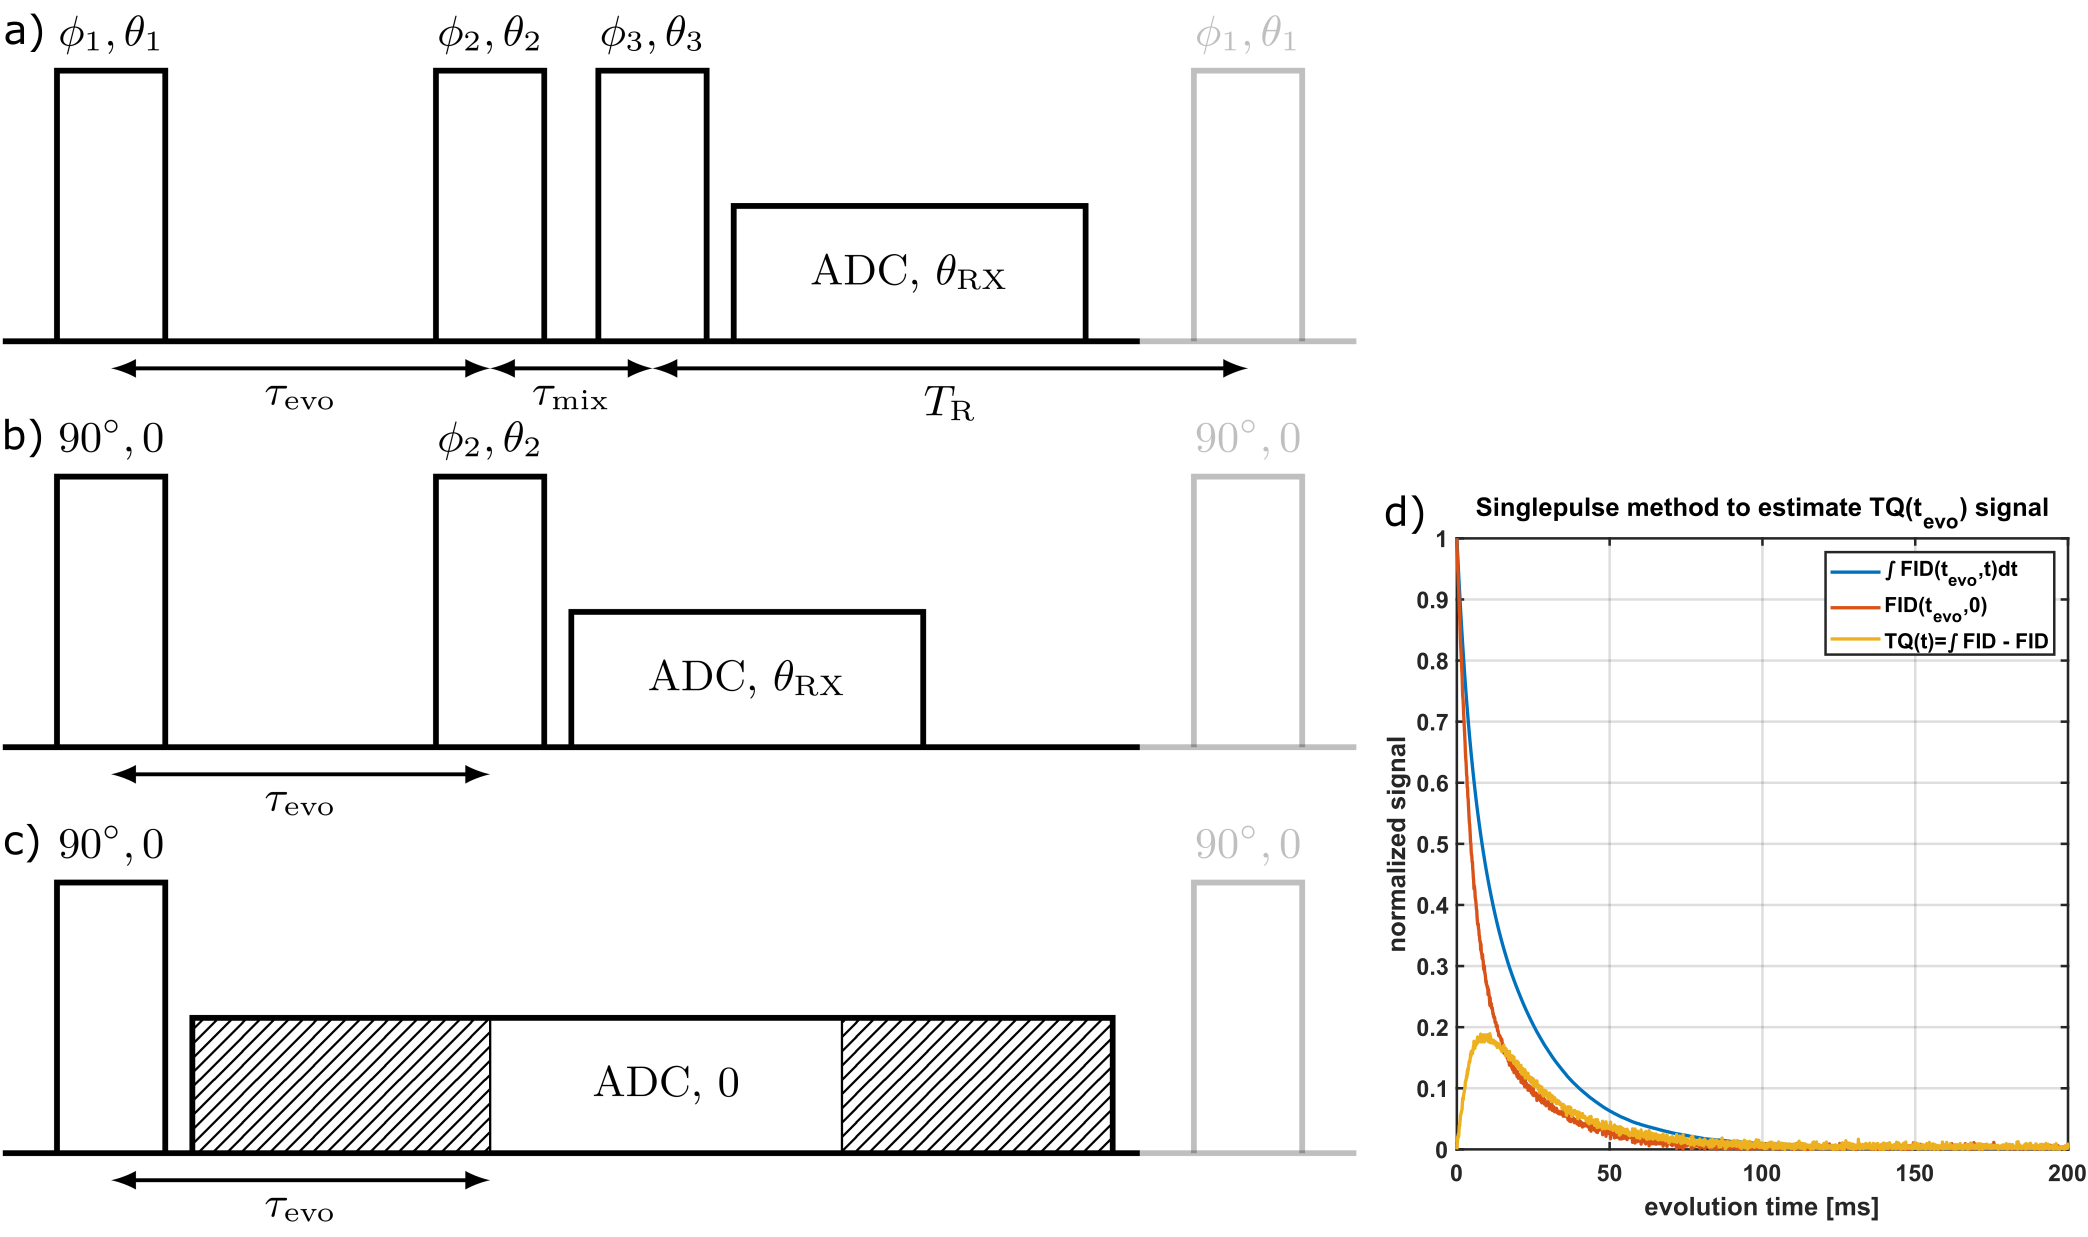
The sodium triple quantum (TQ) signal is a potential biomarker for cell viability1,2. However, complicated multi-pulse phase cycling sequences, like the TQTPPI3 sequence, have long measurement times for the sodium TQ-signal. This limits the application of the TQ-signal for clinical imaging.The typical TQ filtering (TQF) sequence1,3-5 as shown in Fig.1 creates the T31-coherences, which contain all the relevant information about the environment of the sodium nucleus, directly after the first pulse by the transition $$$T_{31}\rightarrow{}T_{11}$$$. However, it is impossible to directly detect the T31-coherences6. To measure the $$$T_{31}$$$-signal, a second RF pulse is used to create $$$T_{33}$$$-TQ coherences. Application of a sophisticated phase cycling scheme allows extracting the T33 coherences. The third RF pulse is converting T33 to T31 coherences, which in the presence of quadrupole interaction is evolving to observable T11 coherences. The low signal and phase cycling scheme result in a long measurement time of the sodium TQ-signal.
This study investigates the possibility to extract information for T31 coherences directly following the first RF-pulse. We compare our data with theory and with the state-of-the-art results from fixed TQTPPI sequence3,7. Moreover, we discuss this method under ideal and realistic conditions.
Materials and Methods
Imagine a single excitation pulse followed by a varying evolution period $$$\tau_{evo}$$$ and a subsequent readout window as shown in Fig.1. The 23Na signal contains T11-coherences with amplitude and T31-coherences which are observed indirectly with amplitude . The resulting FID can be described by:$$FID(\tau_{evo},t)=A_{SQ}(\tau_{evo})f_{11}^{(1)}(t)+A_{TQ}(\tau_{evo})f_{13}^{(1)}(t),$$ where $$f_{11}^{(1)}(t)=A_s\exp(-t/T_{2s})+A_f\exp(-t/T_{2f})$$
and $$f_{13}^{(1)}(t)=\frac{\sqrt{6}}{5}(\exp(-t/T_{2s})-\exp(-t/T_{2f}))\;[1]$$ are the transition functions for T11 coherences and evolution $$$T_{31}\rightarrow{}T_{11}$$$, respectively. As=0.4 and Af=0.6 are the theoretical amplitudes of the long and short component with relaxation times T2s and T2f, respectively. By using one extended readout window and removing all points prior to $$$\tau_{evo}$$$ for every $$$\tau_{evo}$$$-step, all evolution periods are combined in one readout.
Now we still need to extract the $$$T_{31}$$$-signal from the acquired FID. For this, we use the fact that the integral of a Lorentzian function (Fourier transform (FT) of a one-sided exponential function), is independent of the width of the curve:
$$\int_{-\infty}^{\infty}\frac{T_2}{1+T_2^2\omega^2}d\omega=\pi$$
The TQ-signal consist of a difference of two exponentials [1] and therefore the integral over its FT vanishes, while integral over the SQ signal is proportional to its amplitude ASQ. Consequently, the resulting integral only consists of the SQ-signal. The integral over the FID however contains both signals. The TQ-signal then is calculated by subtracting both normalized integrals for every $$$\tau_{evo}$$$-step
$$A_{TQ}(\tau_{evo})=\frac{\int{}FID(\tau_{evo},t)dt}{\int{}FID(0,t)dt}-\frac{\int{}FT(FID(\tau_{evo},t))dt}{\int{}FT(FID(0,t))dt}$$
Note, that for mono-exponential decay, both integrals are proportional to ASQ and with normalization the difference vanishes as expected. To obtain the T31 evolution curve $$$f_{13}^{(1)}(t)$$$ from this, we need a normalization factor that removes the influence of the relaxation times and amplitudes:
$$Norm=\frac{\int{}SQdt}{\int{}TQdt}=\frac{A_sT_{2s}+A_fT_{2f}}{\frac{\sqrt{6}}{5}(T_{2s}-T_{2f})}$$
Measurement data was acquired at a 9.4T preclinical MRI (Bruker Biospec 94/20) using a linear 1H/23Na Bruker volume coil. The samples contained 154mM NaCl and [2,4,6]% w/w agar. The single-pulse sequence parameters were: flip angle 90°, repetition time TR=500ms, number of averages NA=64, number of FID points NFID=4096 and length of acquisition window tacq=410ms. Number of $$$\tau_{evo}$$$-points was set to 2048 with $$$\tau_{evo,max}=205ms$$$.Total acquisition duration of the single-pulse sequence was 32s per sample.
For comparison, we used the fixed-$$$\tau_{evo}$$$ TQTPPI3,7 with 26 different $$$\tau_{evo}$$$ times in the range of 0.1ms to 120ms. Total acquisition duration of the TQTPPI sequence was approximately 3h per sample.
Results/Discussion
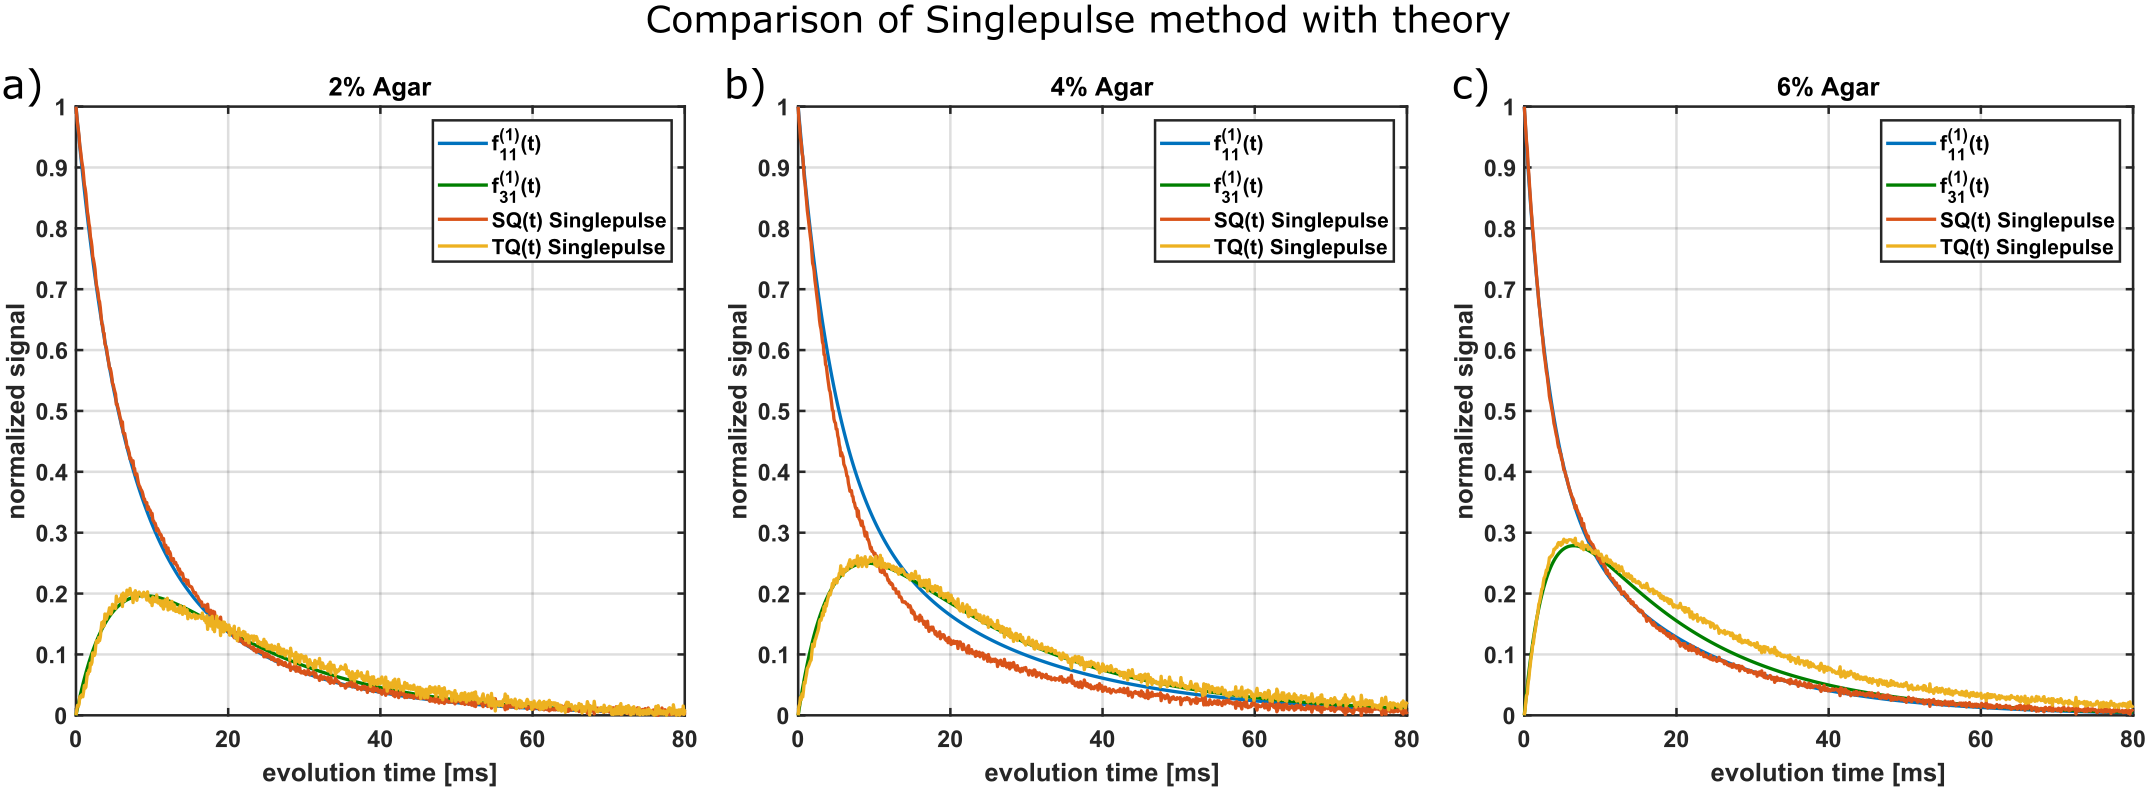
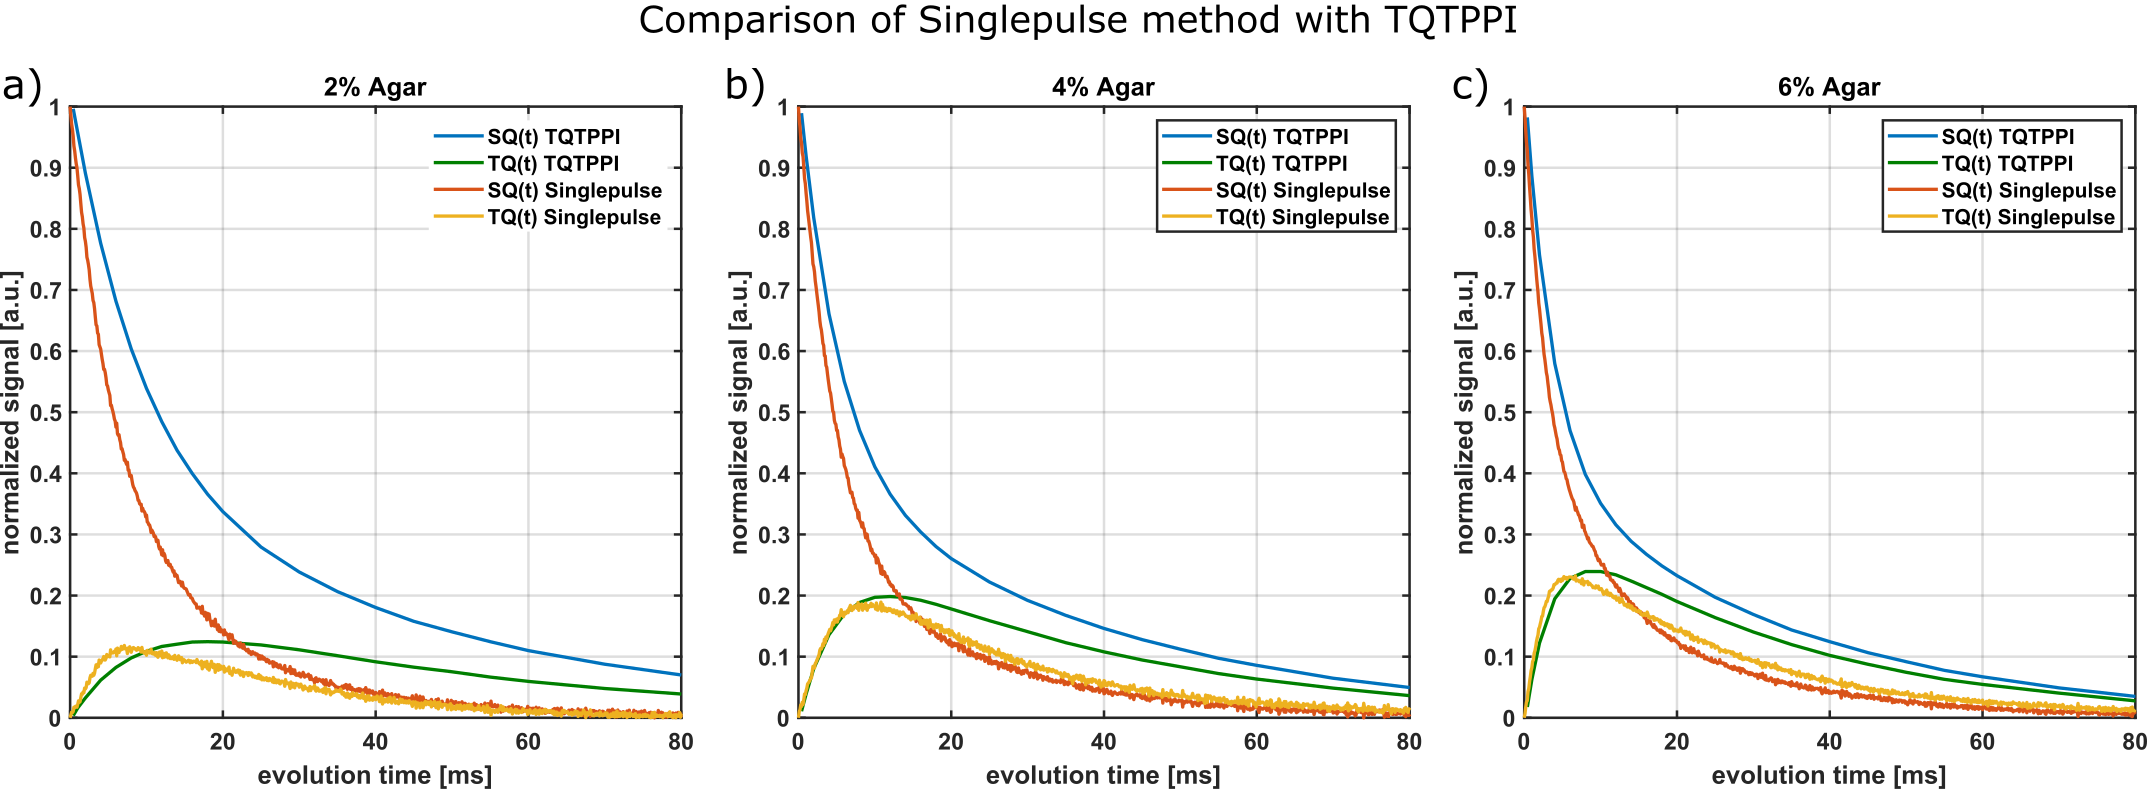
Fig.2 compares this method with the theoretical $$$f_{13}^{(1)}(\tau_{evo})$$$ using T2s and T2f from a bi-exponential fit of the FID. For all samples, the maximum of single-pulse TQ signal and the maximum of $$$f_{13}^{(1)}(\tau_{evo})$$$ are in close agreement. The TQ signal of the 6% agar decays slower than $$$f_{13}^{(1)}(\tau_{evo})$$$ for larger $$$\tau_{evo}$$$, which indicates that the FID is not bi-exponential due to B0 inhomogeneities. The SQ amplitudes deviate from the theoretical values and therefore the FID deviates slightly from $$$f_{11}^{(1)}(\tau_{evo})$$$ for the 4% agar sample. This was also reported in literature 8,9. The relaxation times, however, are the same.Fig.3 compares the single-pulse method with the TQTPPI sequence. The maximum of the TQ-signals approximately coincide between both methods for all samples. However, the relaxation times deviate substantially. The single-pulse FID decays with the T2* times while the TQTPPI FID decays with the T2 times. This is the result of the 180° pulse in the TQTPPI sequence, which refocuses signal loss due to B0 inhomogeneities.
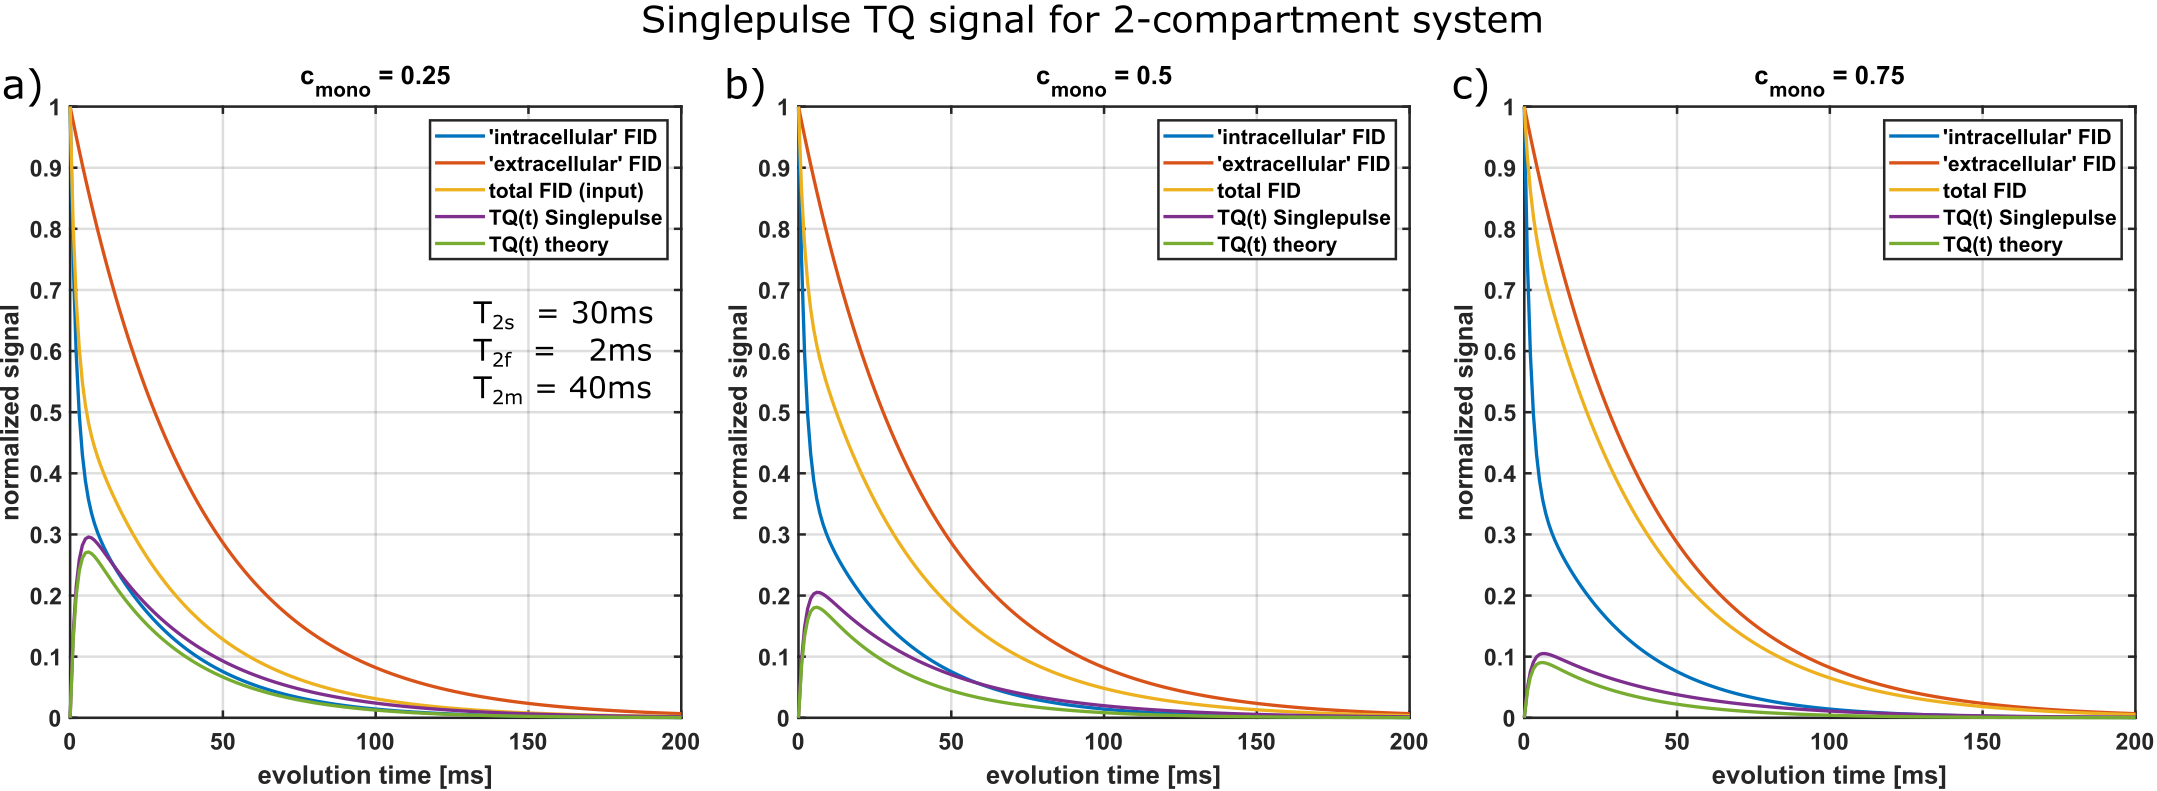
For multi-compartment systems, the integrals are more complicated. We considered the case of a bi-exponential (“intracellular”) and mono-exponential (“extracellular”) compartment and a resulting tri-exponential decay. As Fig.4 shows, the resulting TQ-signal from the single-pulse method only slightly overestimates the TQ signal expected from the system. An in-vivo investigation remains necessary to account for more complex relaxation behavior in biological tissue.
Conclusion
This study presents a new method to estimate the 23Na TQ signal by only using a single-pulse sequence. With this method, the TQ measurement duration can be dramatically reduced in comparison to TQ pulse sequences. Combination of the method with a multi-echo imaging sequence will enable TQ estimation in-vivo with the SQ time efficiency.Acknowledgements
A portion of this work was performed at the National High Magnetic Field Laboratory, which is supported by the National Science Foundation Cooperative Agreement No. DMR-1644779 and the State of Florida.References
1. Madelin G, Lee J-S, Regatte RR, Jerschow A. Sodium MRI: Methods and applications. Progress in Nuclear Magnetic Resonance Spectroscopy. 2014;79:14-47.
2. Madelin G, Regatte RR. Biomedical applications of sodium MRI in vivo. J Magn Reson Imaging. 2013;38(3):511-529.
3. Schepkin VD, Neubauer A, Nagel AM, Budinger TF. Comparison of potassium and sodium binding in vivo and in agarose samples using TQTPPI pulse sequence. J Magn Reson. 2017;277:162-168.
4. Jaccard G, Wimperis S, Bodenhausen G. Multiple-quantum NMR spectroscopy of S=3/2 spins in isotropic phase: A new probe for multiexponential relaxation. The Journal of Chemical Physics. 1986;85(11):6282-6293.
5. van der Maarel JRC. Thermal relaxation and coherence dynamics of spin 3/2. I. Static and fluctuating quadrupolar interactions in the multipole basis. Concepts in Magnetic Resonance. 2003;19A(2):97-116.
6. Schepkin VD. Statistical tensor analysis of the MQ MR signals generated by weak quadrupole interactions. Zeitschrift für Medizinische Physik. 2019.
7. Kleimaier D, Schepkin V, Nies C, Gottwald E, Schad LR. Intracellular Sodium Changes in Cancer Cells Using a Microcavity Array-Based Bioreactor System and Sodium Triple-Quantum MR Signal. Processes. 2020;8(10):1267.
8. Kleimaier D, Reichert S, Schepkin VD, Schad L. Sodium TQ signal of amino acids and α-lactalbumin in comparison to bovine serum albumin. Proc Intl Soc Mag Reson Med. 2021;29.
9. Kleimaier D, Schepkin V, Hu R, Schad LR. Protein conformational changes affect the sodium triple-quantum MR signal. NMR Biomed. 2020;33(10):e4367.
Figures