4714
CASSAVA: a Compressed Adaptive SenSing Algorithm with Variable k‑space Averaging for high‑resolution volumetric 31P MRSI at 7T1Division of Medical Physics in Radiology, German Cancer Research Center (DKFZ), Heidelberg, Germany, 2Faculty of Physics and Astronomy, University of Heidelberg, Heidelberg, Germany, 3Faculty of Medicine, University of Heidelberg, Heidelberg, Germany
Synopsis
Keywords: Non-Proton, Spectroscopy, Phosphorous MRSI
Compressed sensing (CS) techniques suggest the feasibility of reducing the measurement duration of high‑resolution 31P‑MRSI at 7T to a clinically reasonable time (20 minutes) while preserving data quality. The proposed Compressed Adaptive SenSing Algorithm with Variable k‑space Averaging (CASSAVA) reconstructs 31P‑MRSI data with an undersampling factor of $$$R=3.8$$$ while simultaneously maintaining spectral peak accuracy and a high spatial resolution. This was demonstrated in the conducted simulation, retrospective, and prospective studies by evaluating the reconstructed spectra and intracellular pH maps of healthy and tumor tissues as a benchmark test. As a result, clinical research on larger patient cohorts becomes feasible.Introduction
Phosphorous magnetic resonance spectroscopic imaging (31P‑MRSI) is a valuable tool to non‑invasively investigate energy metabolism, membrane turnover, and pH in living tissues. Recent developments addressed the issue of limited sensitivity, enabling the acquisition of volumetric 31P‑MRSI data with reasonable spatial resolution at 7T, and demonstrated its potential value for pH and metabolic imaging in gliomas1,2. The employed 31P‑MRSI protocol duration in these studies (51 minutes) is, however, prohibitively long for clinical research on larger patient cohorts. Compressed sensing (CS) techniques are well‑suited to reduce the 31P‑MRSI protocol measurement time via k‑space undersampling3,4.The purpose of this study was to develop a CS‑based data acquisition and reconstruction strategy to reduce the measurement duration of 31P‑MRSI of the human brain at 7T.
Methods
The proposed approach, CASSAVA, builds upon blind CS5 and variable‑density k‑space averaging6, and is applied to a pre‑existing 31P‑MRSI protocol1. Adaptive undersampling patterns were generated using probability distributions created from k‑space energy distributions of reference brain data (total 31P signal strength), as previously proposed to avoid a priori models7. Repeated sampling and averaging was performed in the central k‑space region. A total undersampling factor of $$$R=3.8$$$ was chosen throughout this study.For data reconstruction, a singular value decomposition (SVD) was applied to the spatio‑spectral Casorati matrix $$$\mathbf{\mathrm{\Gamma}}$$$ to obtain a spectral dictionary matrix, $$$\mathbf{\mathrm{V}}$$$, and a spatial weights matrix, $$$\mathbf{\mathrm{U}}$$$, with $$$\mathbf{\mathrm{\Gamma}}=\mathbf{\mathrm{U}}\mathbf{\mathrm{V}}$$$. The proposed algorithm iteratively minimizes the objective:
$$\mathbf{\mathrm{\hat{U}}} =\mathop{\arg \min}\limits_{\mathbf{\mathrm{U}}} {\Vert{W^{1/2}(F_\mathrm{u}(\mathbf{\mathrm{U}}\mathbf{\mathrm{V}})-\mathbf{\mathrm{b}})}\Vert_2^2 + \lambda\Vert{\mathbf{\mathrm{U}}}\Vert_1 + \lambda_\mathrm{w}\Vert{\Psi{}_\mathrm{w}\mathbf{\mathrm{U}}}\Vert_1}$$
with the measurements $$$\mathbf{\mathrm{b}}$$$, the variable k‑space averaging weights $$$W$$$, the undersampled Fourier transform $$$F_\mathrm{u}$$$, the wavelet transform $$$\mathrm{\Psi}_\mathrm{w}$$$, and regularization parameters $$$\lambda$$$, $$$\lambda_\mathrm{w}$$$.
For benchmarking, the reconstruction accuracy of intracellular pH (pHi) maps was analyzed, as accurately recovering the frequency of low‑intensity resonances (i.e. inorganic phosphate Pi) poses a challenge1. Phosphocreatine (PCr) and Pi resonances of reconstructed 31P‑MRSI data were fitted using AMARES8 and their frequencies inserted into the modified Henderson‑Hasselbach equation9 to determine pHi. As quality indicators, root‑mean‑square error (RMSE) and feature similarity10 (FSIM) were calculated across the full imaging matrix. Home‑built MATLAB scripts performed all data processing.
Simulation study: A synthetic high‑resolution Ground Truth (GT) was created using 5 tissue masks (cerebrospinal fluid, white & grey brain matter, cerebellum, muscle), downsampled to a $$$24\times20\times16$$$ 31P‑MRSI GT, and Gaussian noise was added to replicate the signal‑to‑noise ratio (SNR) of real measurements. The noisy GT was undersampled with the adaptive pattern in Figure 1a, generated with the GT as reference.
Retrospective study: Fully‑sampled 31P‑MRSI data from a patient with glioblastoma was previously obtained on a 7T system (MAGNETOM, Siemens) using a 32‑channel 31P/1H head coil (RAPID), coil‑combined with a whitened SVD11, and undersampled with the same adaptive pattern of the simulation study (Figure 1a).
Prospective study: A healthy volunteer measurement was performed on the identical 7T system using a 1‑channel 31P/1H volume coil (RAPID). The adaptive undersampling pattern in Figure 1b, generated with the patient data as reference, was implemented into the MRSI protocol with 18 averages at k‑space center (total duration: 24 minutes).
In all studies, undersampled data was reconstructed using CASSAVA.
Results
Figure 2 illustrates results from the simulation study. The representative reconstructed spectrum exhibits negligibly small differences compared to the GT. The proposed approach accurately reconstructs pHi maps without relevant deviations (compared to local differences).Figure 3 shows the results for the retrospectively undersampled patient data. The reconstructed spectrum is similar to the original, and their difference contains only noise‑like deviations. The reconstructed pHi map exhibits smoothing but correctly recreates local differences, particularly for tumor tissue.
Table 1 summarizes the reconstruction quality of the proposed strategy for the simulation and retrospective studies compared to the noise‑free GT and the fully‑sampled data, respectively. CASSAVA outperforms the purely undersampled data for the simulation study, whereas no quantitative advantage is observed in the retrospective study due to higher noise variation.
Finally, Figure 4 presents the 31P‑MRSI volunteer data acquired prospectively. Both reconstructed spectra and pHi maps retain important local features.
Discussion
The simulation study demonstrates the possibility of recreating 31P‑MRSI data with the CASSAVA approach while maintaining a close agreement with the GT. The lack of a noise‑free GT in the prospective study makes quantitative comparison difficult; qualitatively, however, there is negligible loss in data quality barring spatial smoothing. Although only pHi evaluations were presented as a benchmark, CASSAVA performs considerably better for higher‑SNR metabolites (data not shown).The correctness of the proposed technique was supported by the prospective measurement performed, despite using an adaptive pattern with comparatively more sampling in the k‑space periphery. Comparing the 24‑minute 1‑channel prospective measurement to the results from the 32‑channel retrospective study indicates that a 20‑minute measurement is possible: the total averages can be reduced while preserving the SNR by using a multi‑channel coil. Further development of our method will enable its use in multi‑channel acquisitions.
Conclusion
We demonstrated the feasibility of a novel CS‑based acquisition strategy to reduce the measurement time of high‑resolution 31P‑MRSI at 7T. Simulations and prospective acquisitions indicate that an experimental duration of 20 minutes is possible without loss in spatial resolution or data quality compared to the state‑of‑the‑art protocol. Thus, the CASSAVA method paves the way for clinical research on larger patient cohorts.Acknowledgements
None.References
, , , et al. Volumetric mapping of intra- and extracellular pH in the human brain using 31P MRSI at 7T. Magn Reson Med. 2020;84:1707‑1723.
2. Korzowski A, Weckesser N, Franke VL, et al. Mapping an Extended Metabolic Profile of Gliomas Using High‑Resolution 31P MRSI at 7T. Front Neurol. 2021;12:735071.
3. Santos‑Díaz A, Noseworthy MD. Comparison of compressed sensing reconstruction algorithms for 31P magnetic resonance spectroscopic imaging. Magn Reson Imaging. 2019;59:88‑96.
4. Askin NC, Atis B, Ozturk‑Isik E. Accelerated phosphorus magnetic resonance spectroscopic imaging using compressed sensing. Annu Int Conf IEEE Eng Med Biol Soc. 2012;2012:1106‑1109.
5. Lingala SG, Jacob M. Blind Compressive Sensing Dynamic MRI. IEEE Trans Med Imaging. 2013;32(6):1132‑1145.
6. Schoormans J, Strijkers GJ, Hansen AC, et al. Compressed sensing MRI with variable density averaging (CS‑VDA) outperforms full sampling at low SNR. Phys Med Biol. 2013;65(4):045004.
7. Knoll F, Clason C, Diwoky C, et al. Adapted random sampling patterns for accelerated MRI. Magn Reson Mater Phy. 2011;24:43–50.
8. Vanhamme L, van den Boogaart A, Van Huffel S. Improved method for accurate and efficient quantification of MRS data with use of prior knowledge. J Magn Reson. 1997;129(1):35‑43.
10. Zhang L, Zhang L, Mou X, Zhang D. FSIM: A Feature Similarity Index for Image Quality Assessment. IEEE Trans Image Process. 2011;20(8):2378‑2386.
11. Rodgers CT, Robson MD. Receive array magnetic resonance spectroscopy: Whitened singular value decomposition (WSVD) gives optimal Bayesian solution. Magn Reson Med. 2010;63(4):881‑891.
Figures
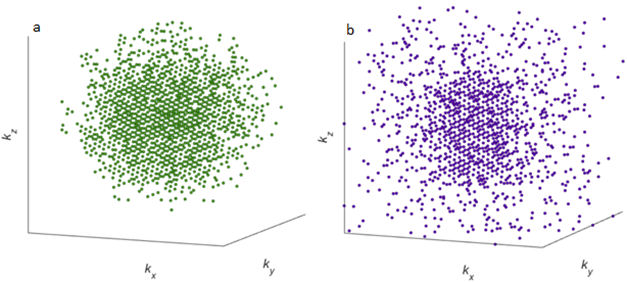
Figure 1. Adaptive undersampling patterns for 31P‑MRSI used in this study with an undersampling factor of $$$R=3.8$$$. a) Pattern generated using the 31P signal strength of the ground truth (GT) as reference, applied in the simulation and retrospective studies. b) Pattern generated using the 31P signal strength of the patient data as reference, applied in the prospective study. Both patterns have a total of 1350 k‑space points for an imaging matrix of $$$24\times20\times16$$$ points, and k‑space points in the central region were repeatedly sampled for a total of 2000 k‑space samples.
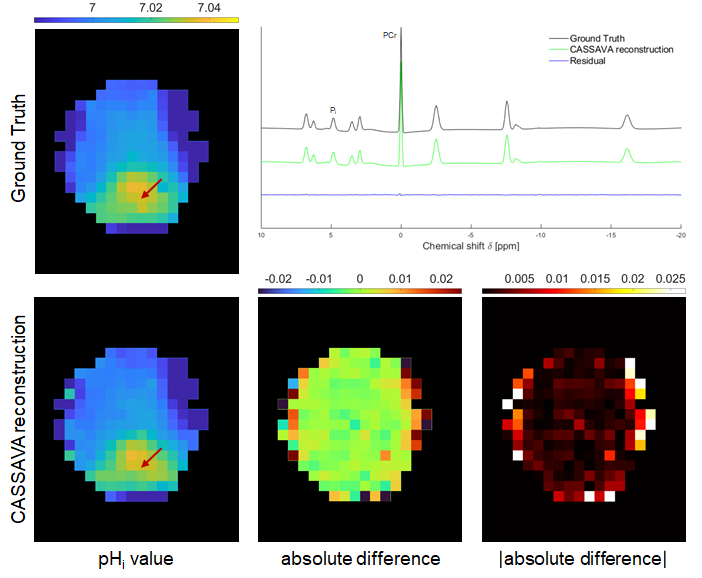
Figure 2. Results from the simulation study using a synthetic GT. Top left: pHi map of the GT. Top right: 31P spectrum at the indicated voxel for the GT and for the CASSAVA reconstruction, and their difference (residual). Bottom row: pHi map of the CASSAVA reconstruction and difference maps (signed and absolute values) with respect to the GT. All pHi maps are masked for visualization purposes: aliasing outside the mask was analyzed and found to be negligible after CASSAVA.
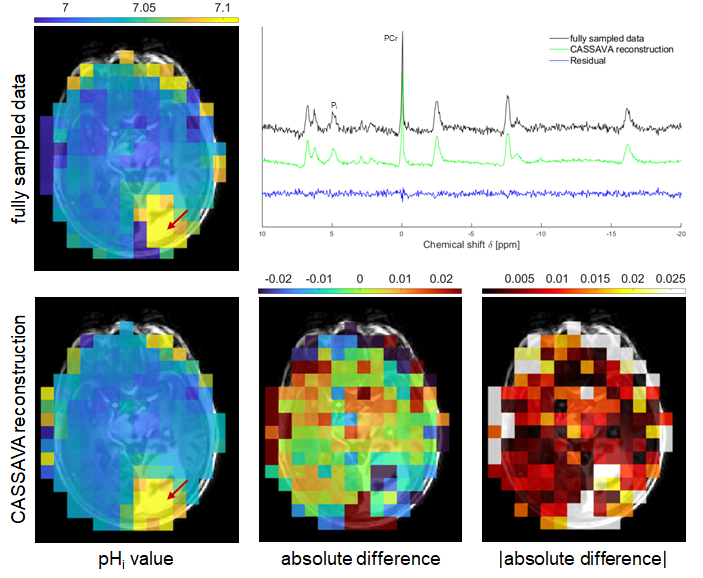
Figure 3. Results from the retrospective study using previously acquired patient data. Top left: pHi map of the fully‑sampled data. Top right: 31P spectrum at the indicated voxel for the fully‑sampled data and for the CASSAVA reconstruction, and their difference (residual). Bottom row: pHi map of the CASSAVA reconstruction and difference maps (signed and absolute values) with respect to the fully‑sampled data. All pHi maps are masked for visualization purposes: aliasing outside the mask was analyzed and found to be negligible after CASSAVA.
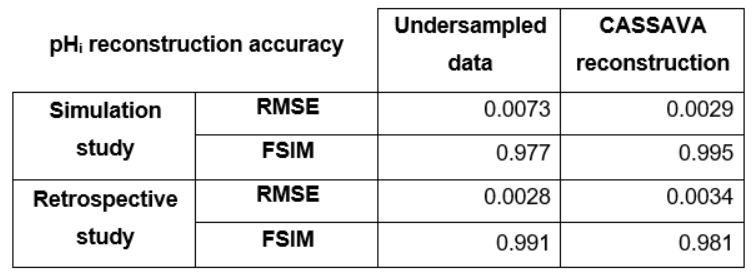
Table 1. Root‑mean‑square error (RMSE) and feature similarity (FSIM) values for the accuracy of the reconstructed pHi maps in the simulation and retrospective studies compared to the noise‑free GT and the fully‑sampled data, respectively. A smaller deviation from the reference image is associated with a lower RMSE value and a higher FSIM value.
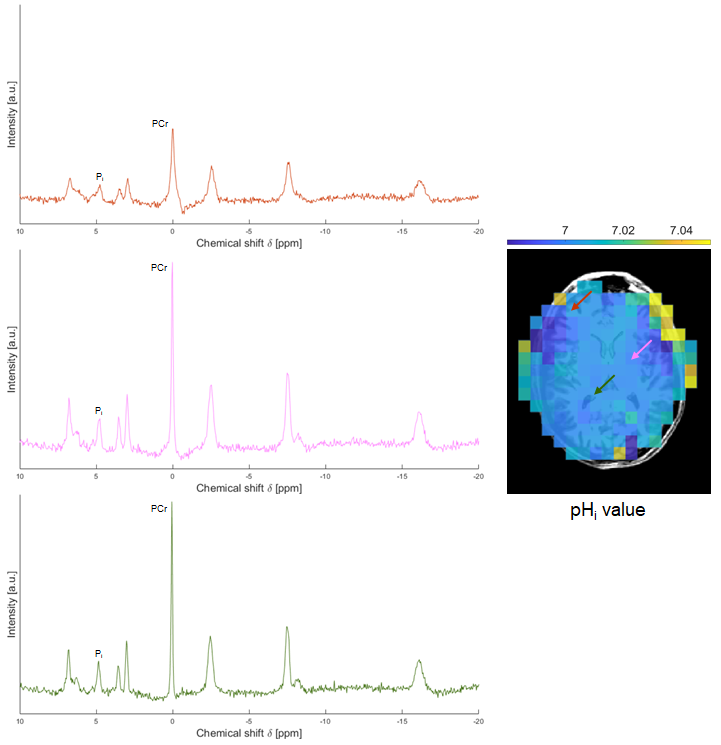
Figure 4. Results from the prospective study on the brain of a healthy volunteer. Left: reconstructed spectra at the voxels indicated in the pHi map. All spectra are plotted with the same scale. Right: reconstructed pHi map.