4713
Endogenous contrast T1ρ CMR: a novel technology for differential diagnosis between cardiac amyloidosis and hypertrophic cardiomyopathy
Keyan Wang1, Jie Zheng2, Jing An3, and Jingliang Cheng1
1MRI, The First Affiliated Hospital of Zhengzhou University, Zhengzhou, China, 2Mallinckrodt Institute of Radiology, St. Louis, MO, United States, 3Siemens Healthineer, Shenzhen, China
1MRI, The First Affiliated Hospital of Zhengzhou University, Zhengzhou, China, 2Mallinckrodt Institute of Radiology, St. Louis, MO, United States, 3Siemens Healthineer, Shenzhen, China
Synopsis
Keywords: Myocardium, Cardiomyopathy
This study evaluated a cardiac T1ρdispersion mapping technique, termed as myocardial fibrosis index (mFI), to distinguish cardiac amyloidosis (CA) from hypertrophic cardiomyopathy (HCM). Our data showed that mFI is significantly superior to native T1 and contrasts medium-derived extracellular volume in the differential diagnosis of CA and HCM.Introduction
There are challenges in diagnosing CA because of varying clinical and imaging manifestations of the disease. Similar imaging appearances contribute to CA patients being misdiagnosed early as having HCM. Moreover, there are significant differences in the treatment and prognosis of HCM and CA [1]. Therefore, early and timely diagnosis is essential for the CA clinical treatment and prognosis evaluation. Using new CMR imaging biomarkers might provide input from different pathophysiological pathways that could add essential data for CA diagnosis. We hypothesized that contrast-free myocardial T1ρ dispersion (termed myocardial fibrosis index [mFI] maps) [2] might allow for the differential diagnosis of the disease. This study thus aimed to evaluate the value of the T1ρ dispersion mapping technique for detecting CA from HCM.Methods
We retrospectively studied 30 subjects with CA and 30 with HCM (Table 1). All subjects underwent cine, T1ρ-mapping (B0 0Hz and B1 298Hz), pre- and post-contrast T1-mapping, and late gadolinium enhancement imaging on a 3T magnetic resonance system (MAGNETOM Skyra, Siemens Healthcare, Erlangen, Germany). Myocardial extracellular volume fraction (ECV) maps were calculated using pre- and post-contrast T1 maps. Myocardial T1ρ and T1ρ dispersion maps, called myocardial fibrosis index (mFI) maps, defined the difference in the T1ρ maps to between 0 and 298 Hz. In addition, all quantitative parameters of the mid-short-axis slice were compared.Results
Both native T1 and ECV values were significantly higher in patients with CA compared with the HCM group (native T1, HCM: 1274.7±54.3 ms vs. CA: 1428.2±71.9 ms; P < 0.0001), (ECV, HCM: 32.6±5.8% vs. CA: 46±8.9%; P < 0.0001) (Table 2). In contrast, mFI values were significantly lower (Fig.1) in the CA group compared with the HCM group (HCM: 8.8±2.8 ms vs. CA: 3.4±2.1 ms; P < 0.0001) (Table 2). In addition, there was a negative correlation between the ECV and mFI (r = -0.314, P < 0.05) (Table 3). The diagnostic accuracy of native T1, ECV, and mFI to diagnose CA from patients with HCM was assessed on an ROC curve. The mFI index showed the highest area under the curve (AUC) (0.957; 95% CI, 0.937-0.978; P < 0.0001) (Fig. 2a) compared to ECV (0.911; 95% CI, 0881-0.940; P < 0.0001) and native T1 (0.827; 95% CI, 0.777-0.876; P < 0.0001) (Table 4) (Fig.2b).Discussion & Conclusion
T1 mapping and ECV could be used to measure the intrinsic signal of the myocardium in CA. Although these markers have pathognomonic features, they are not specific to CA and may be elevated in other cardiovascular diseases. In addition, MFI was low and negatively correlated with ECV in patients with CA, a finding that might be specific and could be used as a marker for the diagnosis of CA.Table 1. Clinical demographics of the participants in the two groups.
| | HCM (n=30) | CA (n=30) | P-value |
| Sex (male/female) | 21/9 | 18/12 | |
| Age (years) | 53.6 ± 11.3 | 49.7±12.9 | 0.513 |
| Body surface area (m2) | 1.8±0.3 | 2±0.6 | 0.343 |
| Heart rate (beats/min) | 68.7 ± 9.3 | 69.5 ± 8.7 | 0.522 |
| Troponin | 0.02 (0.013,0.122) | 0.1(0.07,0.756) | < 0.0001 |
| Brain natriuretic peptide | 1000 (378,2423) | 7926(6987,15863) | < 0.0001 |
| NYHA class, I/II/III/IV | 5/18/6/1 | 0/2/3/25 | 0.001 |
| Hematocrit (%) | 39 (36,44.1) | 34.3(32.1,35.9) | 0.001 |
| Arrhythmia | 5/30 | 18/30 | < 0.0001 |
Table 2. CMR characteristics of the participants in the two groups.
| Parameters | HCM (n=30) | CA (n=30) | P |
| LVEDV (ml) | 119.0 ± 24.0 | 153.5 ± 67.2 | 0.012 |
| LVESV (ml) | 34.6 ± 10.2 | 96 ± 7.3 | < 0.0001 |
| LVSV (ml) | 84.4 ±18.6 | 57.4 ± 21.4 | 0.001 |
| LVEF (%) | 70.9 ± 6.0 | 58.1 ± 12.6 | < 0.0001 |
| Mass (g) | 159.9 ± 46.2 | 166.6 ± 46.3 | 0.731 |
| Global diastolic thickness (mm) | 11.5±3.7 | 11.2 ± 3.2 | 0.278 |
| No LGE/patchy/transmural | 3/25/2 | 2/3/25 | < 0.0001 |
| Native T1 (ms) | 1274.7 ± 54.3 | 1428.2 ± 71.9 | < 0.0001 |
| Post T1 (ms) | 637.5 ± 89.5 | 671.9 ± 80.6 | 0.001 |
| ECV (%) | 32.6 ± 5.8 | 46 ± 8.9 | < 0.0001 |
| mFI (ms) | 8.8 ± 2.8 | 3.4 ± 2.1 | < 0.0001 |
ECV: extracellular volume fraction; mFI: myocardial fibrosis index.
Table 3. Correlation of CMR indexes.
| | | HCM, mFI | | CA, mFI | ||
| | | r | P | | r | P |
| Native T1 | | 0.301 | < 0.0001 | | 0.192 | 0.028 |
| Post T1 | | -0.48 | < 0.0001 | | 0.088 | 0.316 |
| ECV | | 0.876 | < 0.0001 | | -0.314 | < 0.0001 |
Table 4. Diagnostic accuracy of native T1, ECV, and mFI to diagnose CA in patients with HCM using the ROC curve.
| Parameters | Area | 95% CI low | 95% CI up | Cut-off | Sensitivity | Specificity |
| Native T1 (ms) | 0.827 | 0.777 | 0.876 | 1386.2 | 68.7% | 92.8% |
| ECV (%) | 0.911 | 0.881 | 0.940 | 39.9 | 82.4% | 90.5% |
| mFI (ms) | 0.957 | 0.937 | 0.978 | 5.0 | 97.5% | 85.5% |
Acknowledgements
No acknowledgement found.References
1. Kittleson Michelle M,Maurer Mathew S,Ambardekar Amrut V et al. Cardiac Amyloidosis: Evolving Diagnosis and Management: A Scientific Statement From the American Heart Association. Circulation, 2020, 142: e7-e22.2.
2.Wang C, Zheng J, Sun J, et al. Endogenous contrast T1ρ cardiac magnetic resonance for myocardial fibrosis in hypertrophic cardiomyopathy patients. J Cardiol 2015; 66:520-526.
Figures
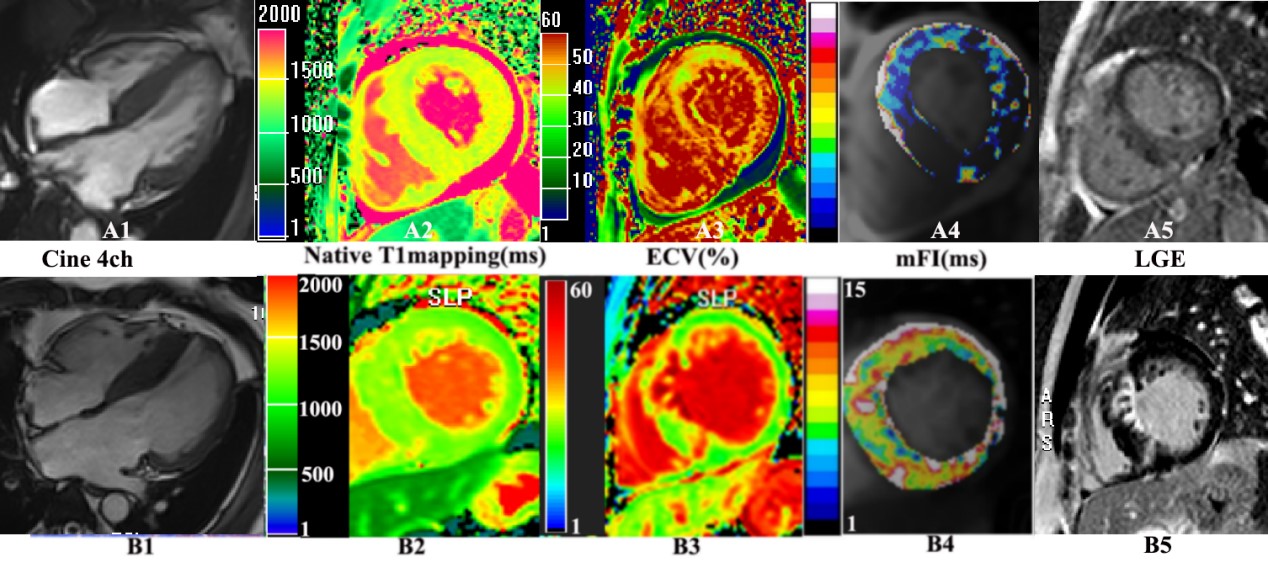
Figure 1. Examples of cine, native T1, ECV, mFI mapping, and LGE in CA (A1-5) and HCM (B1-5) patients. The cine 4ch shows that CA and HCM have similar morphological characteristics (A1-B1). Native T1 (A2) and ECV (A3) in CA patients show a higher signal than in HCM patients (B2, B3). In contrast, the mFI signal of A4 is lower than that of B4. The late gadolinium enhancement (LGE) image shows circumferential LGE confined to the endocardium or diffuse areas of LGE in less than half of the short-axis images in CA patients (A5) and patchy LGE in HCM patients (B5).
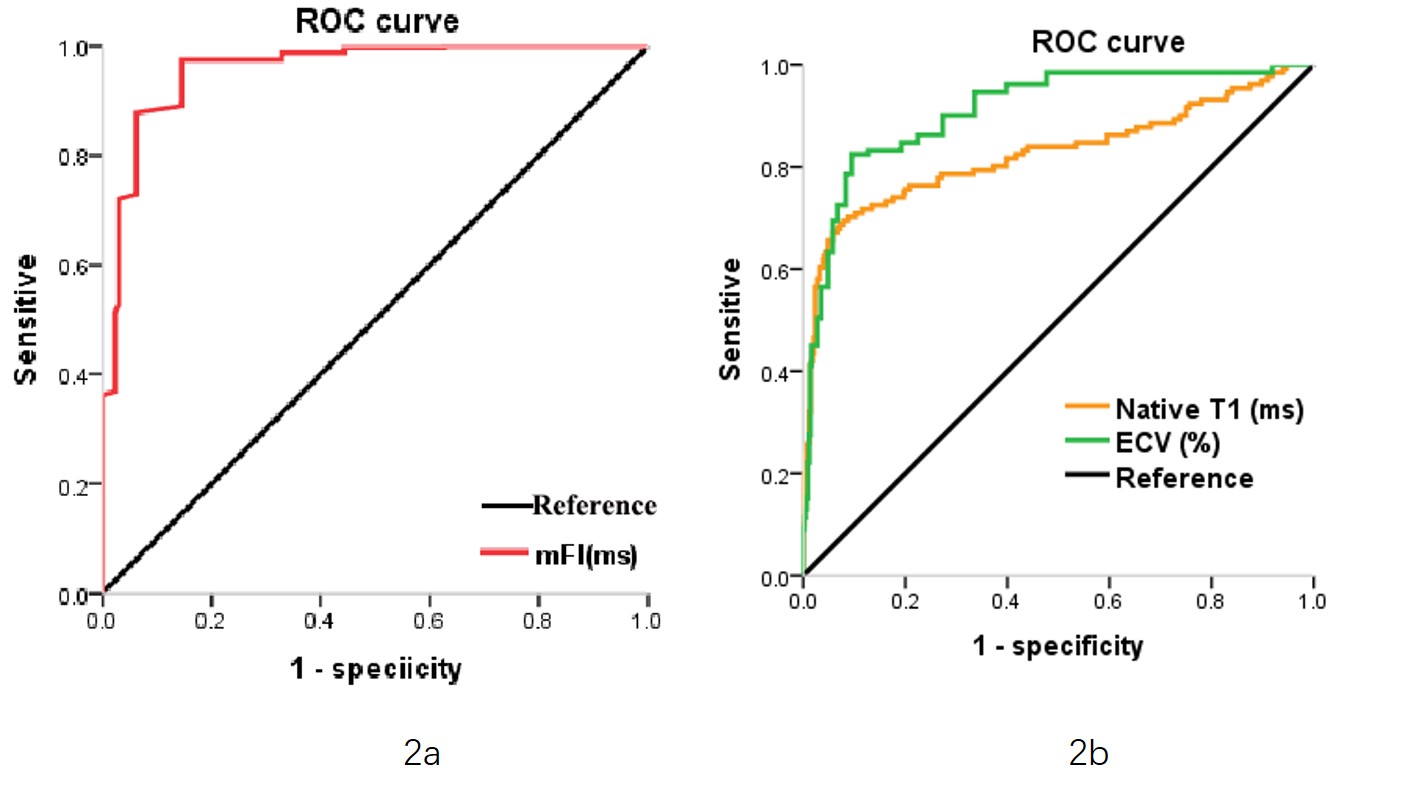
Figure 2. Receiver operating characteristic (ROC) curves to compare the diagnostic accuracy of mFI (2a) with native T1 and ECV (2b) in patients with cardiac amyloidosis and hypertrophic cardiomyopathy.
DOI: https://doi.org/10.58530/2023/4713