4706
Fractal Analysis: Left Ventricular Trabecular Complexity Cardiac MRI Adds Independent Risks for HFpEF in Participants with ESRD1Nephrology, Shanghai Jiaotong University School of Medicine Affiliated Renji Hospital, Shanghai, China, 2Philips Healthcare, Shanghai, China, Shanghai, China, 3Radiology, Shanghai Jiaotong University School of Medicine Affiliated Renji Hospital, Shanghai, China
Synopsis
Keywords: Cardiomyopathy, Tissue Characterization
The aim of this study was to measure left ventricular (LV) trabecular complexity by fractal dimension (FD) in patients with end-stage renal disease (ESRD), and assess whether FD is an independent risk predictor for heart failure with preserved ejection fraction (HFpEF) in this population. We found that LV mean basal FD was an independent predictor for HFpEF in the multivariate analysis. Adding LV mean basal FD to the baseline model resulted in a higher C-index and significant NRI, indicating better discriminatory ability to HFpEF en ESRD patients.Introduction
Patients with chronic kidney disease (CKD), especially end-stage renal disease (ESRD), suffer from a significant increase in cardiovascular morbidity and mortality1. The uremic state of patients with ESRD leads to an increase in myocardial fibrosis by activating interstitial cells, resulting in an increase in both left and right ventricular weights2. These structural changes may explain the observation of diastolic heart dysfunction secondary to impaired compliance in patients with ESRD3. Thus, a noninvasive and reliable method to assess heart failure with preserved heart failure (HFpEF), which is characterized by diastolic dysfunction, is highly desirable in patients with ESRD. The endocardial surfaces of both ventricles of the mature human heart are lined by a fenestrated network of muscular trabeculae extending into the cavity4. Alteration in trabecular complexity may influence systolic and/or diastolic function, hemodynamics, and conduction system of the heart5. Fractal analysis is a method of quantifying complex geometric patterns in biological structures. The resulting fractal dimension (FD) is a unitless measure index of how completely the object fills space, which increases with increased structural complexity6. The complexity of LV trabeculations may be assessed by the fractal analysis of the short-axis cine images of cardiac magnetic resonance (CMR) imaging. Previous study found that the global FD of the left ventricle independently correlated with LV mass and global strain parameters after adjusting for potential confounders7,8, which was consistent with the cardiac MRI characteristics of HFpEF9,10.Thus, this study hypothesized that LV trabecular complexity measured by FD might be an independent risk predictor for HFpEF in patients with ESRD.Methods
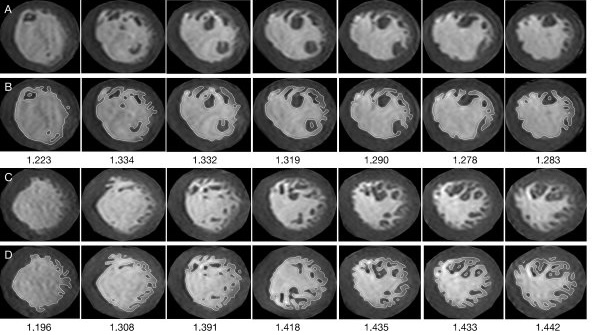
This study retrospectively enrolled 104 participants with ESRD, who were assigned to the HFpEF group based on the ESC guideline. CMR was performed in all patients. FD was derived from LV short-axis cine images. Analysis was performed using Matlab software with the custom-written code (FracAnalyse) that has been made freely available online11,12. In statistical analyses, univariate and multivariate regression analyses were conducted to appraise independent factors predicting HFpEF. The diagnostic accuracy was assessed by the area under the curve of the receiver operating characteristic (ROC). Continuous net reclassification improvement (cNRI) and integrated discrimination index (IDI) were also calculated to quantify the improvement offered by FD values13.Results
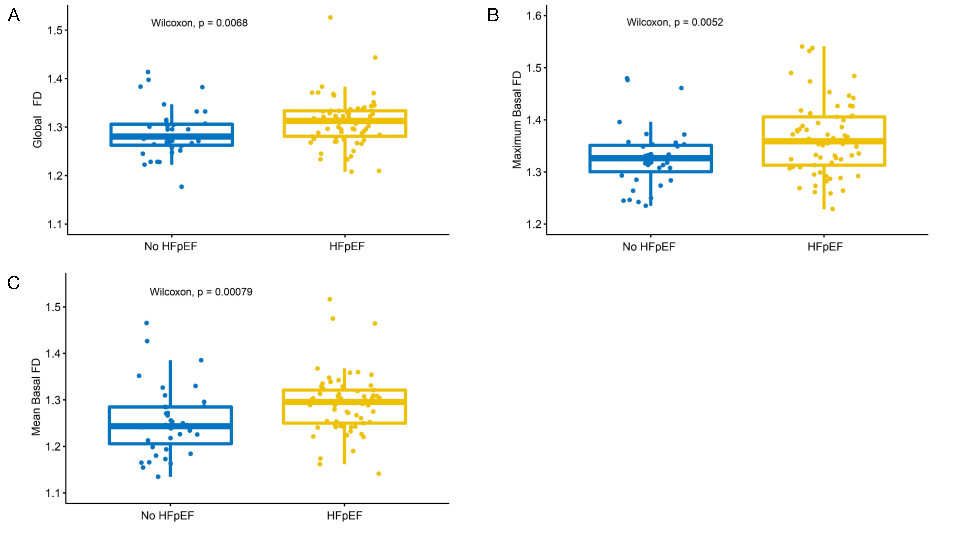
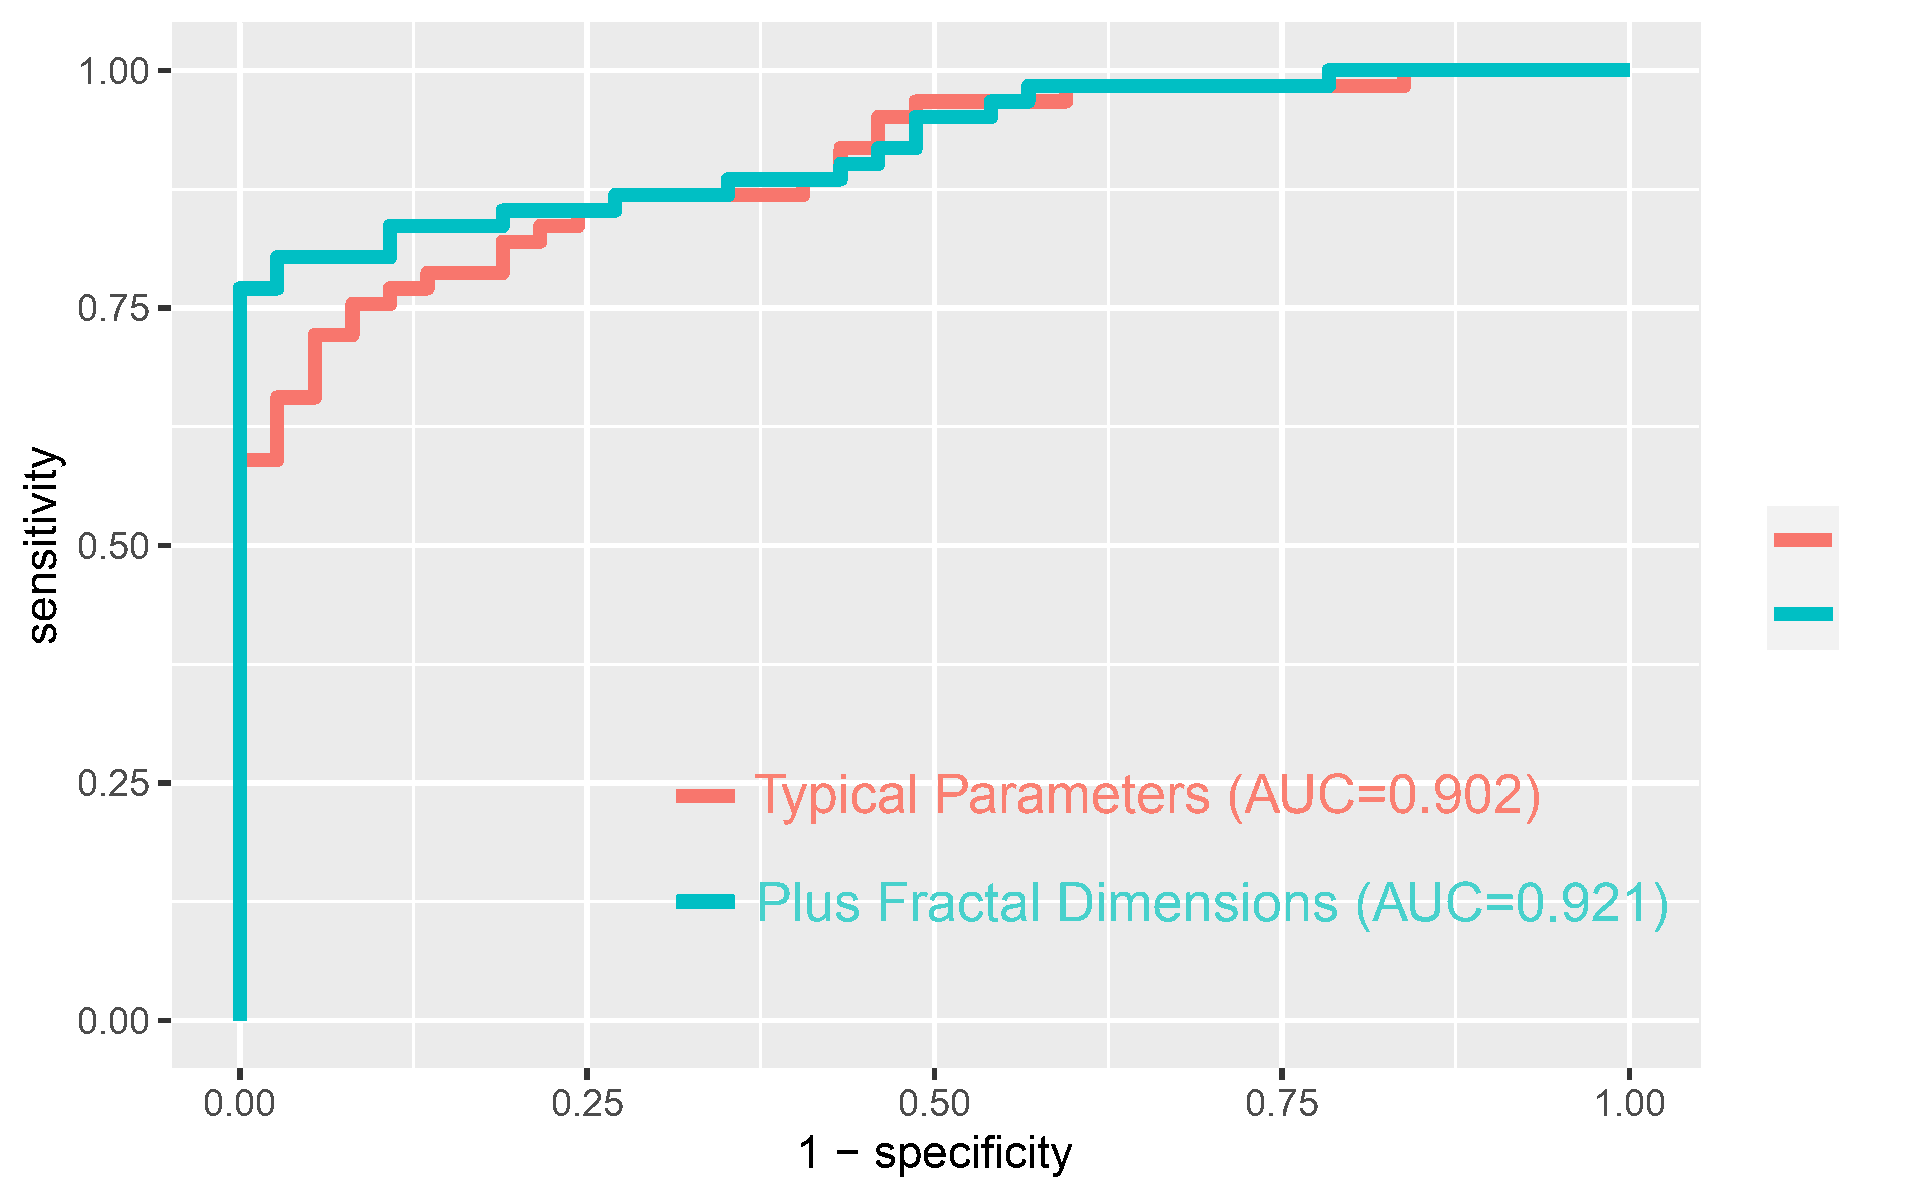
Patients having ESRD with HFpEF had an elevated LV mean basal FD compared with those without HFpEF (median, 1.30 [1.25, 1.32] vs 1.24 [1.21, 1.28], P = 0.001). Global FD and LV maximum basal FD were also higher in patients having ESRD with HFpEF (P = 0.007 and 0.005, respectively) compared with those without HFpEF. In the univariate analysis, 13 variables, including global FD, LV mean and basal FD, LVEF, LVMI, LAVImin, and LV GLS, showed a significant correlation with the occurrence of HFpEF in patients with ESRD (P < 0.05). The backward stepwise regression process included five features into the multivariate analysis, and three of them turned out to be independent predictors for HFpEF in patients with ESRD: age, LAVImin, and LV mean basal FD (OR = 1.022e+9, P = 0.030). A baseline model consisting of age, LAVImin, and LV GLS showed a good performance with a C-index of 0.902. Combining the LV mean basal FD in the baseline model showed a better but not significantly improved C-index of 0.921 (P = 0.192). cNRI showed a significant improvement in risk prediction between the baseline model alone compared with the baseline model with mean basal FD (0.642; 95% CI, 0.254–1.029; P = 0.001).Discussion
Of the 104 patients with ESRD enrolled in the present study, 65 were diagnosed with HFpEF by symptoms and abnormal CMR parameters. LV global and basal FD were significantly higher in the HFpEF group compared with the non-HFpEF group, indicating that both volume overload and diastolic dysfunction may lead to hypertrabeculation to increase the stroke volume. Spearman’s correlation coefficients were calculated between LV FDs and imaging features commonly used to evaluate HFpEF. The LV global FD slightly correlated with LVMI. The LV maximum apical FD was slightly correlated with LVMI and global T1 time. This result further confirmed the relationship between trabecular complexity and ventricular mass or even the extent of interstitial fibrosis. In the multivariate analysis, the LV mean basal FD along with age and LAVImin remained to be independent predictors for HFpEF in patients with ESRD. Adding LV mean basal FD to a baseline model consisting of age, LAVImin, and GLS made the C-index higher than before (0.902 and 0.921, respectively), and the cNRI of the two models was 0.642 (P = 0.001). This suggested better discrimination ability with FDs, indicating that LV trabecular complexity measured by fractal analysis of CMR images was a valid tool for assessing HFpEF in patients with ESRD.Conclusion
LV trabecular complexity measured by FD was an independent risk predictor for HFpEF in patients with ESRD. Further studies are needed to evaluate the ability of FDs to predict prognosis in this population.Acknowledgements
This study was supported by National Natural Science Foundation of China, National Natural Science Foundation of China Youth project, Shanghai Science and technology innovation action plan, technology standard project and Shanghai Science and technology innovation action plan. The study was also sponsored by Shanghai Municipal Health Commission, Shanghai Municipal Education Commission-Gaofeng Clinical Medicine Grant;Shanghai Jiao Tong University school of medicine Double hundred outstanding person projrect, Shanghai Jiao Tong University School of Medicine, Shanghai Outstanding Academic Leaders Plan as well as innovative research team of high-level local universities in Shanghai.References
1. Drüeke TB, Floege J. Cardiovascular complications of chronic kidney disease: pioneering studies. Kidney Int. 2020;98(3):522-526.
2. Mall G, Rambausek M, Neumeister A, et al. Myocardial interstitial fibrosis in experimental uremia--implications for cardiac compliance. Kidney Int. 1988;33(4):804-811.
3. Pecoits-Filho R, Bucharles S, Barberato SH. Diastolic heart failure in dialysis patients: mechanisms, diagnostic approach, and treatment. Semin Dial. 2012;25(1):35-41.
4. Meyer HV, Dawes TJW, Serrani M, et al. Genetic and functional insights into the fractal structure of the heart. Nature. 2020;584(7822):589-594.
5. Vedula V, Seo JH, Lardo AC, et al. Effect of trabeculae and papillary muscles on the hemodynamics of the left ventricle. Theor Comput Fluid Dyn. 2016;30(1-2):3-21.
6. Captur G, Muthurangu V, Cook C, et al. Quantification of left ventricular trabeculae using fractal analysis. J Cardiovasc Magn Reson. 2013;15(1):36.
7. Cai J, Bryant JA, Le TT, et al. Fractal analysis of left ventricular trabeculations is associated with impaired myocardial deformation in healthy Chinese. J Cardiovasc Magn Reson. 2017;19(1):102.
8. Yu S, Chen X, Yang K, et al. Correlation between left ventricular fractal dimension and impaired strain assessed by cardiac MRI feature tracking in patients with left ventricular noncompaction and normal left ventricular ejection fraction. Eur Radiol. 2022;32(4):2594-2603.
9. Nagueh SF. Heart failure with preserved ejection fraction: insights into diagnosis and pathophysiology. Cardiovascular Research. 2021;117(4):999-1014.
10. Kammerlander AA, Donà C, Nitsche C, et al. Feature Tracking of Global Longitudinal Strain by Using Cardiovascular MRI Improves Risk Stratification in Heart Failure with Preserved Ejection Fraction. Radiology. 2020;296(2):290-298.
11. Cai J. UK-Digital-Heart-Project/fracAnalyse: fracAnalyse v1.2. 2017.
12. Wang J, Li Y, Yang F, et al. Fractal Analysis: Prognostic Value of Left Ventricular Trabecular Complexity Cardiovascular MRI in Participants with Hypertrophic Cardiomyopathy. Radiology. 2021;298(1):71-79.
13. Pencina MJ, D’Agostino RB, Steyerberg EW. Extensions of net reclassification improvement calculations to measure usefulness of new biomarkers. Statist Med. 2011;30(1):11-21.
Figures