4702
Full cardiac cycle coverage T2* mapping detects early myocardial changes in hypertrophic cardiomyopathy1Berlin Ultrahigh Field Facility (B.U.F.F), Max Delbrueck Center for Molecular Medicine in the Helmholtz Association, Berlin, Germany, 2DZHK (German Centre for Cardiovascular Research), partner site Berlin, Berlin, Germany, 3Technische Universität Berlin, Berlin, Germany, 4Department of Experimental Pharmacology and Toxicology, University Medical Center Hamburg-Eppendorf, Hamburg, Germany, 5DZHK (German Centre for Cardiovascular Research), partner site Hamburg/Kiel/Lübeck, Hamburg, Germany, 6Experimental and Clinical Research Center, Charite Medical Faculty and the Max Delbrueck Center for Molecular Medicine in the Helmholtz Association, Berlin, Germany
Synopsis
Keywords: Cardiomyopathy, Tissue Characterization, Tissue remodeling
Most cases of hypertrophic cardiomyopathy (HCM) are detected at a stage when the heart has experienced significant damage. The aim of this study is to detect subtle changes in the myocardium before the appearance of overt symptoms of HCM. We show that myocardial T2* mapping can detect early changes throughout the full heart cycle in a HCM mouse model that represents the human genetic heart disease. This could potentially provide a biomarker for early stages of HCM that might be useful for non-invasive diagnoses.
Introduction
HCM is usually detected at a stage when clinical symptoms appear, by which point the heart has already experienced irreversible damage on a microstructural level, described as myocardial remodelling [1]. Most efforts to detect and assess these changes non-invasively involve cardiac MR (CMR) [1]. T1 relaxation time mapping and late gadolinium enhancement (LGE) are currently recommended for CMR based HCM risk assessment [2]. Myocardial T2* mapping presents a viable alternative to detect preclinical signs of HCM [3]. Myocardial T2* was reported to be prolonged in HCM patients. The transient T2* difference between diastole and systole was found to be diminished in HCM patients. The mechanistic or biophysical underlying of these clinical observations is unexplored so far. We hypothesize that myocardial T2* mapping in a humanized mouse model of HCM will provide a framework for deciphering the mechanistic or biophysical underlying of the early T2* changes in HCM. To test our hypothesis, we implemented a data acquisition scheme that enables retrospective data sorting and full cardiac cycle coverage for T2* mapping in healthy mice and in a humanized mouse model of HCM at 9.4 T.Methods
Figure 1 illustrates the data acquisition scheme used for full cardiac cycle coverage T2* mapping. Continuous acquisition of T2* weighted multi-echo GRE data was accompanied by simultaneous tracking of cardiac activity using ECG and pulse oximetry. For retrospective gating the cardiac cycle was divided into 10 phases. For image reconstruction, the time points of the MR k-space lines were matched to the corresponding cardiac phases. T2* mapping was conducted using a 9.4T animal scanner (Biospec 94/20, Bruker, Germany) with the following parameters: TR=14 ms, TE=1.5-11.1 ms, echo spacing=1.6 ms (7 TEs), repetition: 300 (acquired continuously to fill 300 k-spaces). Conventional multi gradient echo (MGE) imaging (TR=35 ms, TE=1.5-31.9 ms, echo spacing=1.6 ms, 20 TEs) was used as a reference. For evaluation of the retrospectively sorted T2* mapping scheme, Ferumoxytol phantom was used: c=50 µg/mL Ferumoxytol in 2% agarose poured in 1.5 mL Eppendorf tube, further diluted to 25 µg/mL. For the in vivo study, a mouse model (Mybpc3-KI) with a point mutation in Mybpc3 gene was used [4]. Four Mybpc3-KI and four wildtype controls (all in C57BL/6J background and 6 weeks old) were examined. The Mybpc3-KI (HCM) mice didn’t show HCM symptoms but a slight left ventricular hypertrophy at the time of the experiment. B0 shimming was performed to minimize macroscopic magnetic field inhomogeneities. We used a 4-element surface coil (model T114262 V3; Bruker Biospin, Germany). Short axis views were used to acquire whole cardiac cycle coverage CINE images (adapted FLASH, cardiac frames=10, TE/TR=2.1/10ms, FA=20°, FOV=20x20mm2, matrix=192x192, thickness=0.8mm) and T2*-maps (MGE, cardiac frames=7, TE/TR=2.1/20ms, FA=10°, FOV=35x35mm2, matrix=128x128, thickness=0.8mm).Results
Evaluation of the implemented T2* mapping approach demonstrated accordance between the retrospective sorting-based approach and the conventional MGE. Figure 2 highlights this agreement by summarizing the T2* results obtained for the 50 and 25 µg/ml Fe phantom. The in vivo study provided left ventricle myocardium from both HCM and control mice during several heart cycles. Mean myocardial T2* (averaged over the entire cardiac cycle) of T2*Ctrl= 9.52 ± 0.63 (T2*systole = 9.08 ± 0.46 ms, T2* diastole = 9.82 ± 0.57 ms) and T2*HCM = 10.0 ± 0.23 ms (T2*systole = 9.82 ± 0.22 ms, T2* diastole = 10.12 ± 0.16 ms). Our findings show a T2* prolongation in HCM mice compared to healthy control (Figure 3). A close examination of T2* throughout the cardiac cycle revealed a transient change in myocardial T2*. T2* was decreased during systole and increased during diastole (Figure 4). The differences of (ΔT2* = T2*diastole -T2*systole) was found to be decreased in HCM mice (ΔT2*=1.03 ± 0.03) compared to healthy controls (ΔT2*=1.08 ± 0.08) (p<0.05).Discussion and conclusion
This work demonstrates the feasibility of retrospective gating based T2* mapping in mice with a heart rate of up to 600 bpm. Unlike prospective triggering, our approach facilitates for the first time T2* mapping with whole cardiac cycle coverage. Our findings demonstrate an increase of myocardial T2* in HCM, which accords with previous human studies [3]. Although the first instinct would be to attribute this observation to a higher washout of deoxygenated haemoglobin (deoxyHb), it stands to reason that the T2* increase could be induced by a decreased myocardial blood volume fraction shadowing the excess of deoxyHb [3]. Alterations in the dynamic T2* change between systole and diastole could reflect early signs of microvascular dysfunction consistent with early progression of HCM. To conclude, our study provides an important foundation for gaining a better understanding of the pathophysiological and biophysical underpinning of microstructural changes in the HCM.Acknowledgements
This work was supported by the German Research Foundation, KU 3722/4-1 (Gefördert durch die Deutsche Forschungsgemeinschaft [DFG], KU 3722/4-1).
References
1. Efthimiadis, G.K., et al., Feasibility and significance of preclinical diagnosis in hypertrophic cardiomyopathy. Cardiol Rev, 2015. 23(6): p. 297-302.
2. Maron, B.J., et al., Diagnosis and Evaluation of Hypertrophic Cardiomyopathy: JACC State-of-the-Art Review. J Am Coll Cardiol, 2022. 79(4): p. 372-389.
3. Huelnhagen, T., et al., Myocardial Effective Transverse Relaxation Time T 2(*) is Elevated in Hypertrophic Cardiomyopathy: A 7.0 T Magnetic Resonance Imaging Study. Sci Rep, 2018. 8(1): p. 3974.
4. Vignier, N., et al., Nonsense-mediated mRNA decay and ubiquitin-proteasome system regulate cardiac myosin-binding protein C mutant levels in cardiomyopathic mice. Circ Res, 2009. 105(3): p. 239-48.
Figures
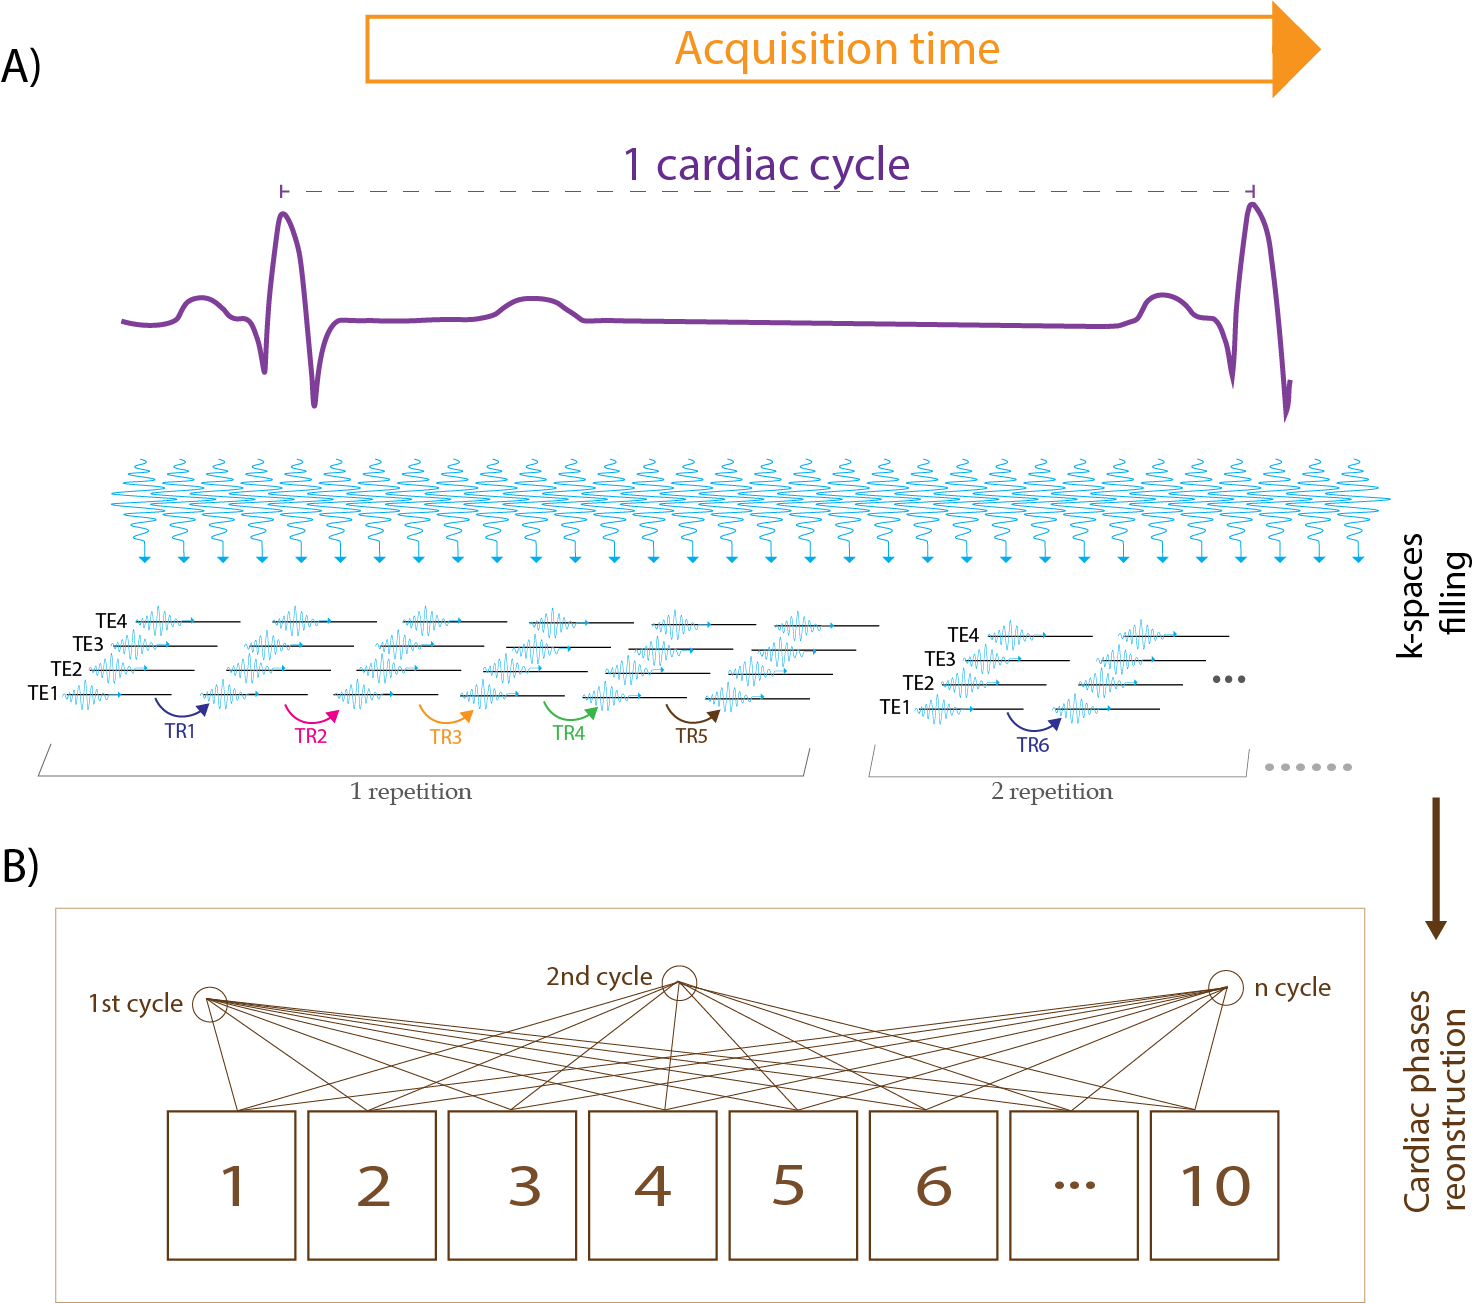
Figure 1: Illustration of T2* data acquisition scheme. A) MR data were acquired continuously while cardiac activity was tracked with ECG and pulse oximetry. K spaces were filled successively line by line. B) For retrospective gating the cardiac cycle was divided into 10 phases. For image reconstruction, the time points of the MR lines were matched with the corresponding cardiac phases.
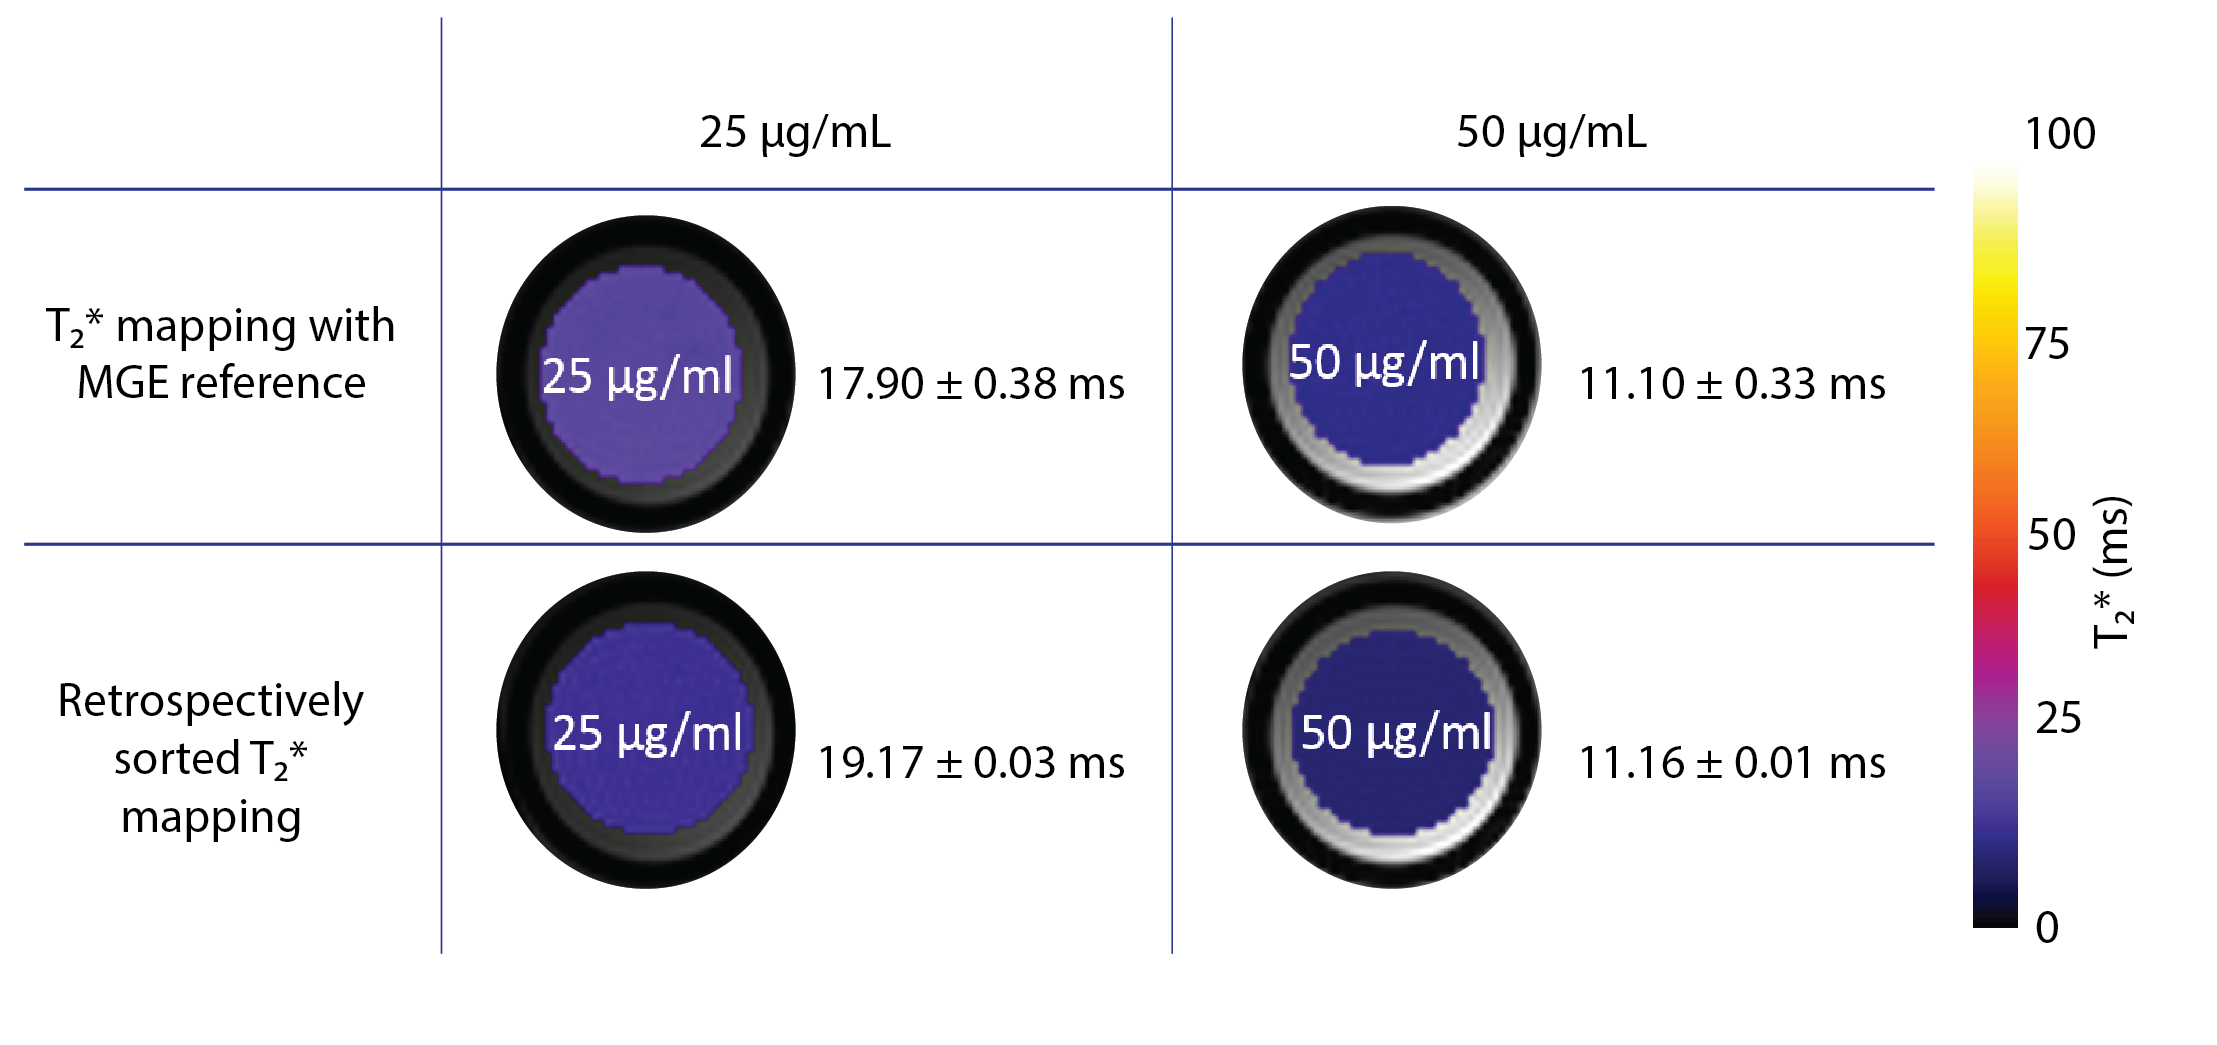
Figure 2: Validation of the retrospectively sorting T2* mapping technique against the MGE reference. For evaluation, Ferumoxytol phantoms with two concentrations of iron were used. The corresponding T2* maps show agreement of our retrospectively sorted approach and the MGE reference.
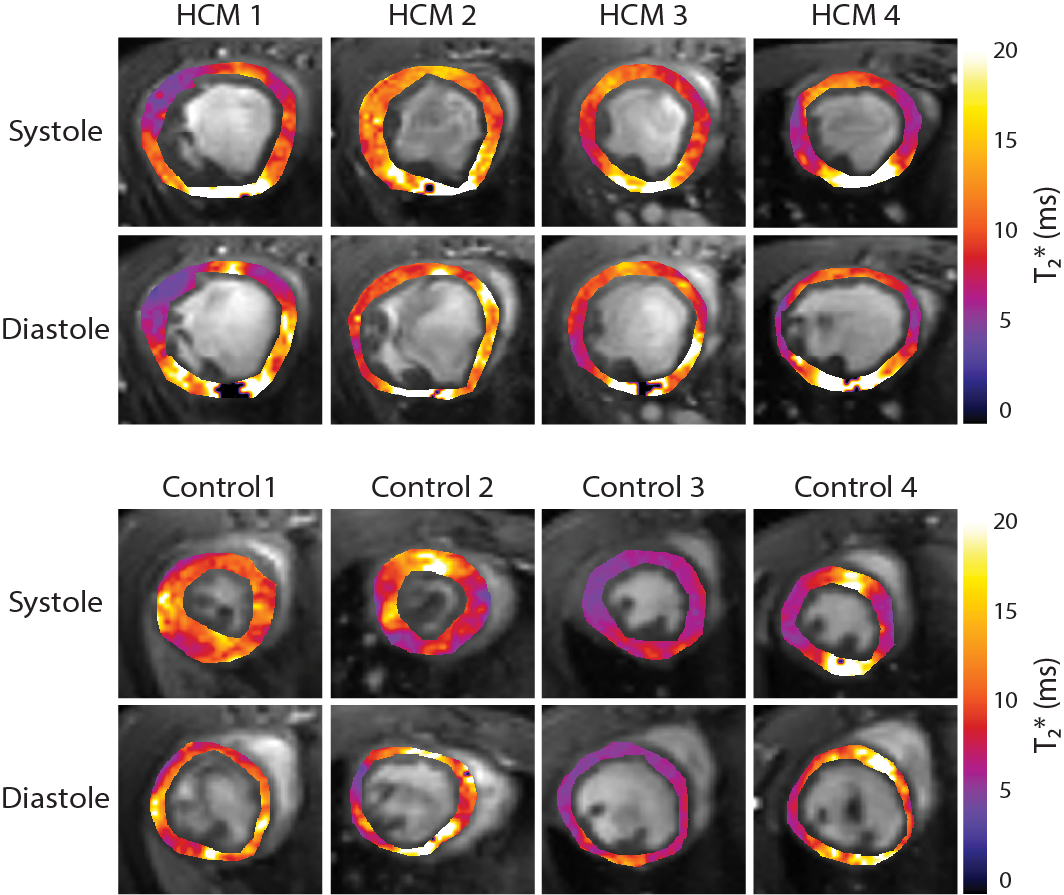
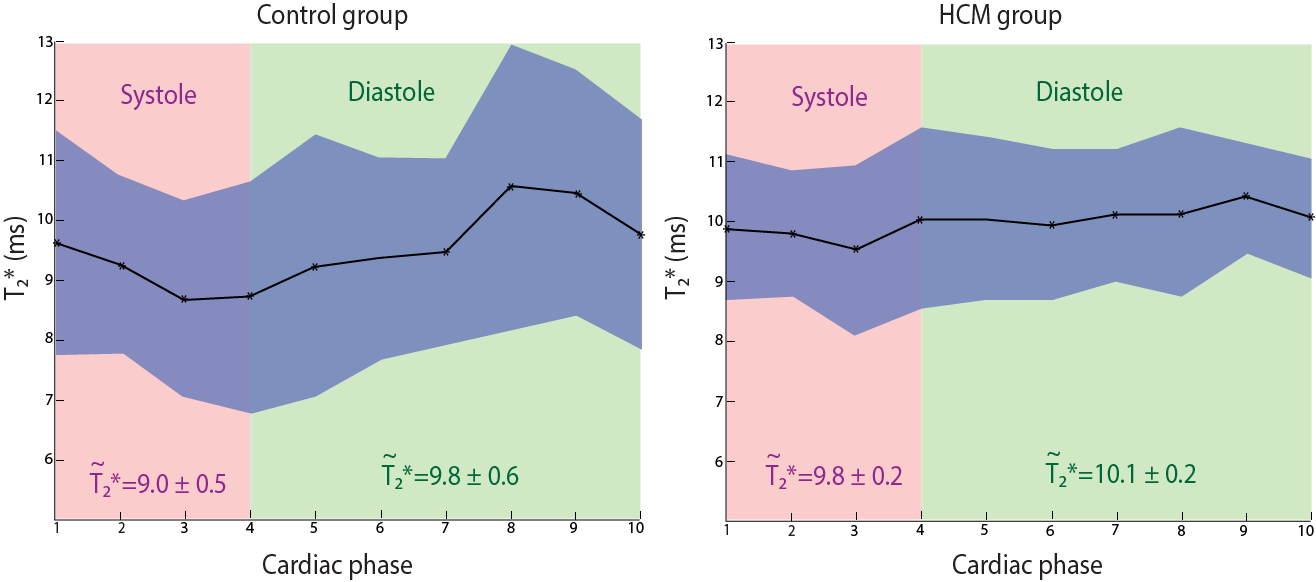
Figure 4: Transient T2* changes throughout the cardiac cycle. Average T2* obtained for systole and diastole are indicated, while the curve shows the changes of T2* over the entire cardiac cycle. The blue zone represents the standard deviation. The healthy control group (left) shows larger changes in T2* throughout the cardiac cycle compared to the HCM group (right).