4690
Cardiovascular MRI combined with catheterization for objective assessment of cardiac function: data- and model-derived pressure-volume loops
Maria Gusseva1,2,3, Daniel A. Castellanos4, Tarique Hussain1, Dominique Chapelle2,3, and Radomír Chabiniok1,2,3,5
1Department of Paediatrics, UT Southwestern Medical Center, Dallas, TX, United States, 2Inria, Palaiseau, France, 3Ecole Polytechnique, Palaiseau, France, 4Department of Cardiology, Boston Children’s Hospital, Boston, MA, United States, 5Czech Technical University in Prague, Prague, Czech Republic
1Department of Paediatrics, UT Southwestern Medical Center, Dallas, TX, United States, 2Inria, Palaiseau, France, 3Ecole Polytechnique, Palaiseau, France, 4Department of Cardiology, Boston Children’s Hospital, Boston, MA, United States, 5Czech Technical University in Prague, Prague, Czech Republic
Synopsis
Keywords: Heart, Modelling
Clinical pressure-volume data are often subjected to measurement noise. In the present work we explore the potential of a biomechanical model of the heart as a data-filtering tool. We use cardiovascular MRI volume data either simultaneously or sequentially acquired with catherization. We use time-varying elastance metrics for a quantitative comparison of data- and model-derived pressure-volume loops (PV loops). Our results demonstrate that the biomechanical model provides high quality PV loops that could be used to replace noisy data signals. In addition, this work contributes to the increased understanding of cardiovascular MRI results.Introduction
Therapy planning may benefit from the assessment of myocardial energetics using ventricular pressure-volume loops (PV loops) 1. PV loops can be reconstructed from interventional cardiovascular magnetic resonance imaging (MRI) (simultaneous acquisition of catheter pressure and MRI). Clinical pressure-volume (P-V) data are often subjected to measurement noise, e.g. temporal dyssynchrony, non-physiological over-/undershoot in pressure measurements (Figure 2). Our previous work demonstrated that a biomechanical model could be deployed to synchronize clinical P-V data in time 2. This work aims to further explore the potential of the model to filter measurement noise in clinical data. We aim to quantitatively compare data- and model-derived P-V waveforms based on the time-varying elastance (TVE) metrics. The data-derived P-V waveforms will use acquired data directly from cardiovascular MRI and catheter-based measurements.Methods
Data: The study included 15 P-V datasets of patients with single-ventricle physiology undergoing interventional cardiac MRI within the pre-Fontan assessment, and 17 left and 20 right ventricular P-V datasets of patients with repaired tetralogy of Fallot (rTOF). In the Fontan cohort, P-V data were acquired simultaneously. A highly accelerated prospectively ECG-triggered cine bSSFP sequence was used (kt-SENSE factor 6, partial Fourier 0.625, slice thickness 10 mm, spatial resolution 2.4). In the rTOF cohort, retrospective ECG-gated cine bSSFP sequence was used (SENSE=2, spatial resolution 2x2x10 mm). Catheterization was sequentially performed during percutaneous pulmonary valve replacement therapy. The target temporal resolution was ~30 ms in all acquisitions. The motion tracking algorithm 3 was used to extract time-vs.-volume plots from cine MRI.Biophysical model of the heart: The model represented the mechanical (contractile and viscoelastic) behavior of a single ventricular cavity with spherical shape 4,5. Cavity mass and radius were prescribed from the patient’s MRI data. Mechanical laws were calibrated so that simulated P-V waveforms corresponded to the maximum and minimum P-V traces for a given patient. The circulation system was represented by a Windkessel model. It was coupled to the heart cavity via a system of diodes representing the ventricular outflow valves (Figure 1). Calibration of the model provided patient-specific PV loops and associated mechanical quantities of the heart and circulation – myocardial contractility and stiffness, distal resistance of the circulation.
Quantitative assessment of pressure-volume data: TVE, i.e. E(t)=P(t)/V(t), maximum value of TVE (Emax)6 and maximum time derivative of ventricular pressure (max(dP/dt)) were computed from data- and model-derived P-V waveforms (Figure 2). TVE theory conceptually links ventricular isovolumetric and end of ejection phases via 7:
$$max(dP/dt)/EDV=Emax/tmax * k,$$
(1)where EDV denotes end-diastolic volume, tmax is the time of the occurrence of Emax, and k is a constant. Eq. (1) and linear regression analysis were used to quantitatively compare data- and model-derived P-V waveforms. In addition, Bland-Altman plots and Wilcoxon signed-rank tests at p<0.05 were used to evaluate the difference between data- and model-derived Emax/tmax and max(dP/dt).
Results
All data – and model-derived linear regressions were significant with p<0.01. Model-derived max(dP/dt) vs. model-derived Emax/tmax linear regressions showed the highest R2 values in all groups (Figure 3). Model-derived max(dP/dt) vs. data-derived Emax/tmax showed stronger linear regressions than data-derived max(dP/dt) vs. data-derived Emax/tmax in all patient groups. Bland-Altman plot statistics demonstrated that mean bias ± standard deviation (SD) for data- vs. model-derived max(dP/dt) were -272 ± 168 mmHg/s, -72 ± 215 mmHg/s, and -40 ± 118 mmHg for Fontan, rTOF-LV and rTOF-RV patients, respectively (Figure 4 and Table 1).Discussion
This study demonstrated that both data – and model-derived P-V traces produced statistically significant relationships between ventricular isovolumetric and end of ejection phases – in accordance with the prediction of TVE theory. However, model-derived P-V traces provided quantitatively stronger relationships between max(dP/dt) and Emax/tmax in all patient groups. Also, model-derived max(dP/dt) was more accurately reflective of data-derived Emax/tmax than data-derived max(dP/dt). Our results suggest that such a biomechanical model could be used as data-filtering tool. The calibration of the model requires discrete patient data inputs (i.e. maximum and minimum P-V values). Therefore, if clinically acquired continuous data signal is too noisy or not available at all, this biomechanical model could provide high quality patient-specific PV loops for functional evaluation of cardiac health.Conclusion
This model of the heart can assist in clinical data-processing by complementing noisy P-V data thus improving an objective assessment of clinical P-V loops. This study contributes to the increased understanding of cardiovascular MRI results and their links to cardiac (patho)physiology.Acknowledgements
The study was supported by the Inria-UTSW Associated Team TOFMOD and the W. B. & Ellen Gordon Stuart Trust & The Communities Foundation of Texas.References
- Veeram Reddy SR, Arar Y, Zahr RA, et al. Invasive cardiovascular magnetic resonance (iCMR) for diagnostic right and left heart catheterization using an MR-conditional guidewire and passive visualization in congenital heart disease. Journal of Cardiovascular Magnetic Resonance. 2020;22(1):20.
- Gusseva M, Castellanos DA, Greer JS, et al. Time-Synchronization of Interventional Cardiovascular Magnetic Resonance Data Using a Biomechanical Model for Pressure-Volume Loop Analysis. Accessed November 2, 2022.
- Genet M, Stoeck CT, von Deuster C, Lee LC, Kozerke S. Equilibrated warping: Finite element image registration with finite strain equilibrium gap regularization. Medical Image Analysis. 2018;50:1-22.
- Chapelle D, Tallec PL, Moireau P, Sorine M. An energy-preserving muscle tissue model: formulation and compatible discretizations. International Journal for Multiscale Computational Engineering. 2012;10(2):189.
- Caruel M, Chabiniok R, Moireau P, Lecarpentier Y, Chapelle D. Dimensional reductions of a cardiac model for effective validation and calibration. Biomechanics and Modeling in Mechanobiology. 2014;13(4):897-914.
- Suga H, Sagawa K, Shoukas AA. Load Independence of the Instantaneous Pressure-Volume Ratio of the Canine Left Ventricle and Effects of Epinephrine and Heart Rate on the Ratio. Circulation Research. 1973;32(3):314-322.
- Little WC. The left ventricular dP/dtmax-end-diastolic volume relation in closed-chest dogs. Circulation Research. 1985;56(6):808-815.
Figures
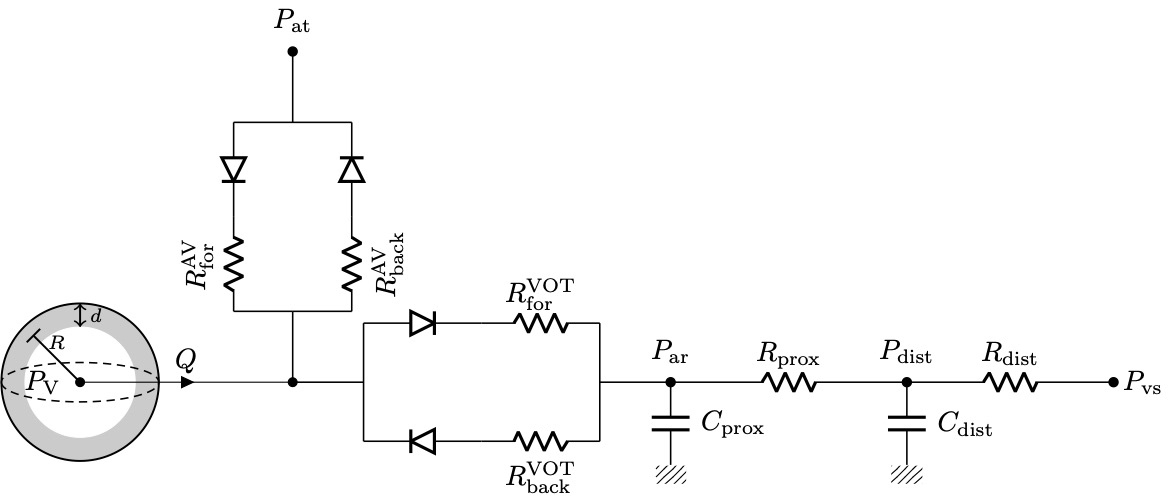
Figure 1. Single ventricular cavity model coupled with the circulation via system of diodes and a two-stage Windkessel.
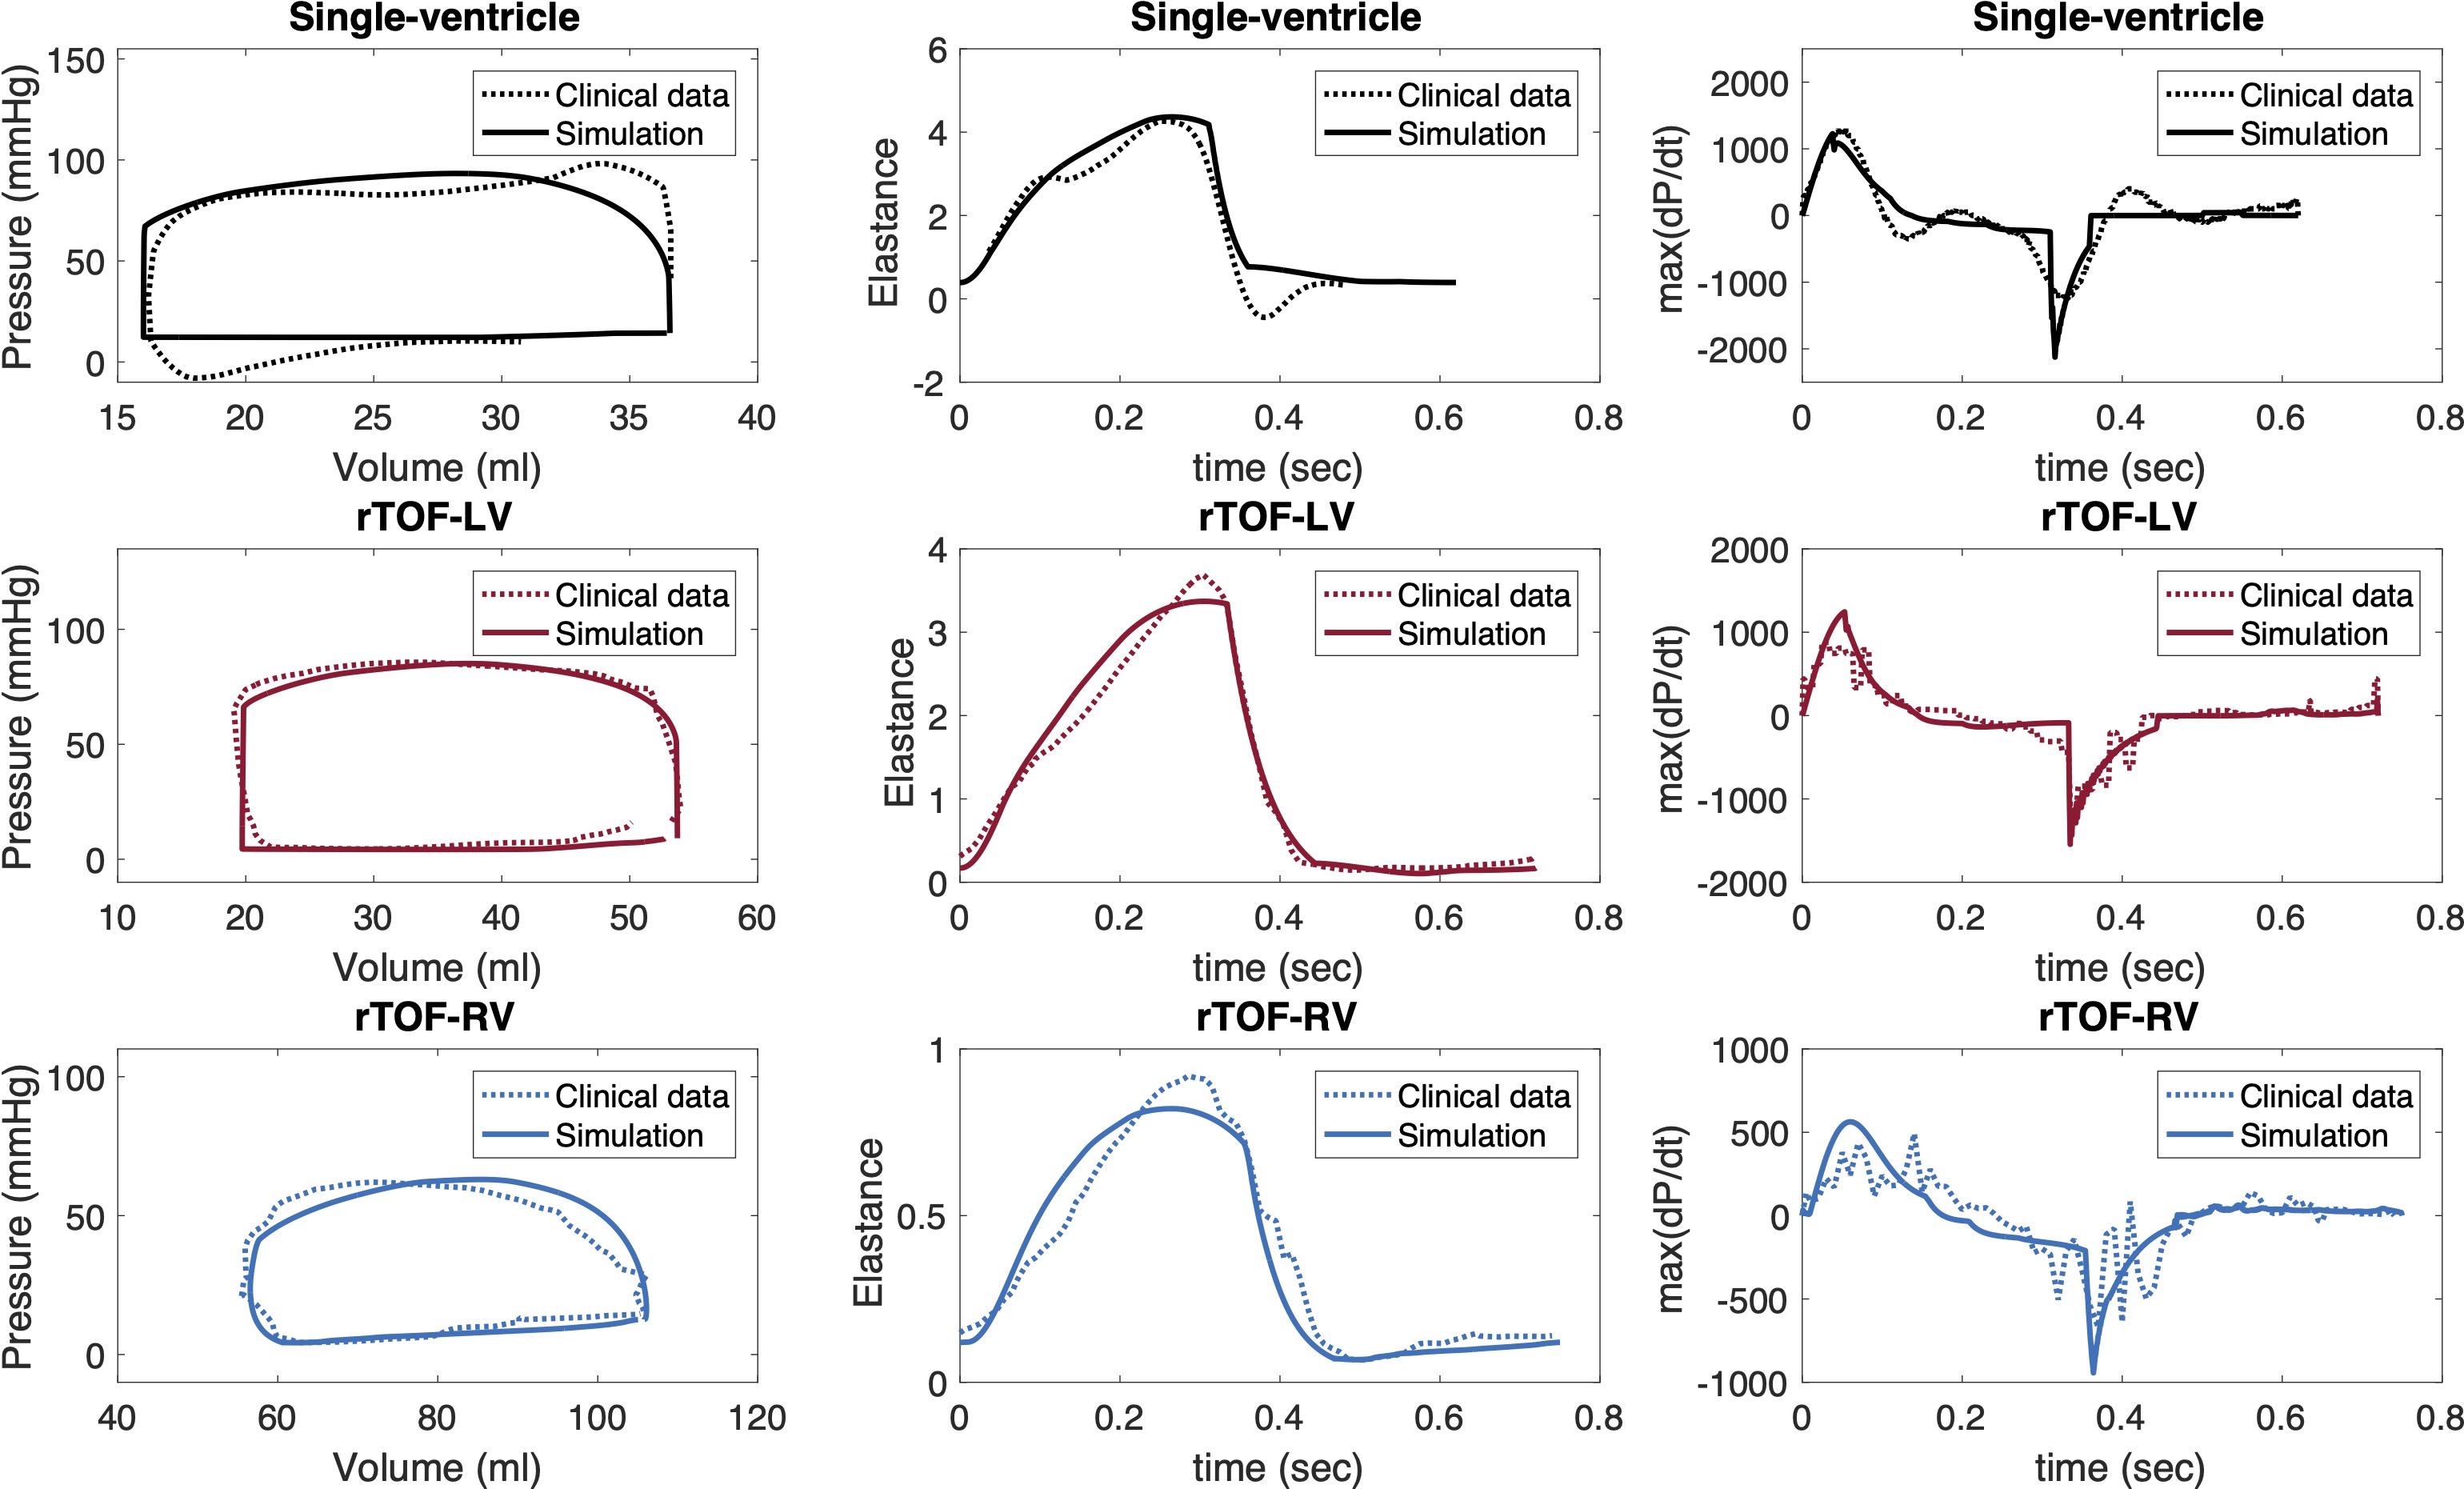
Figure 2. Data- and model-derived pressure-volume loops, time-varying elastance and time derivative of ventricular pressure (max(P/dt)) for single-ventricle patient (black lines), and left (red) and right (blue) ventricles of patient with rTOF.
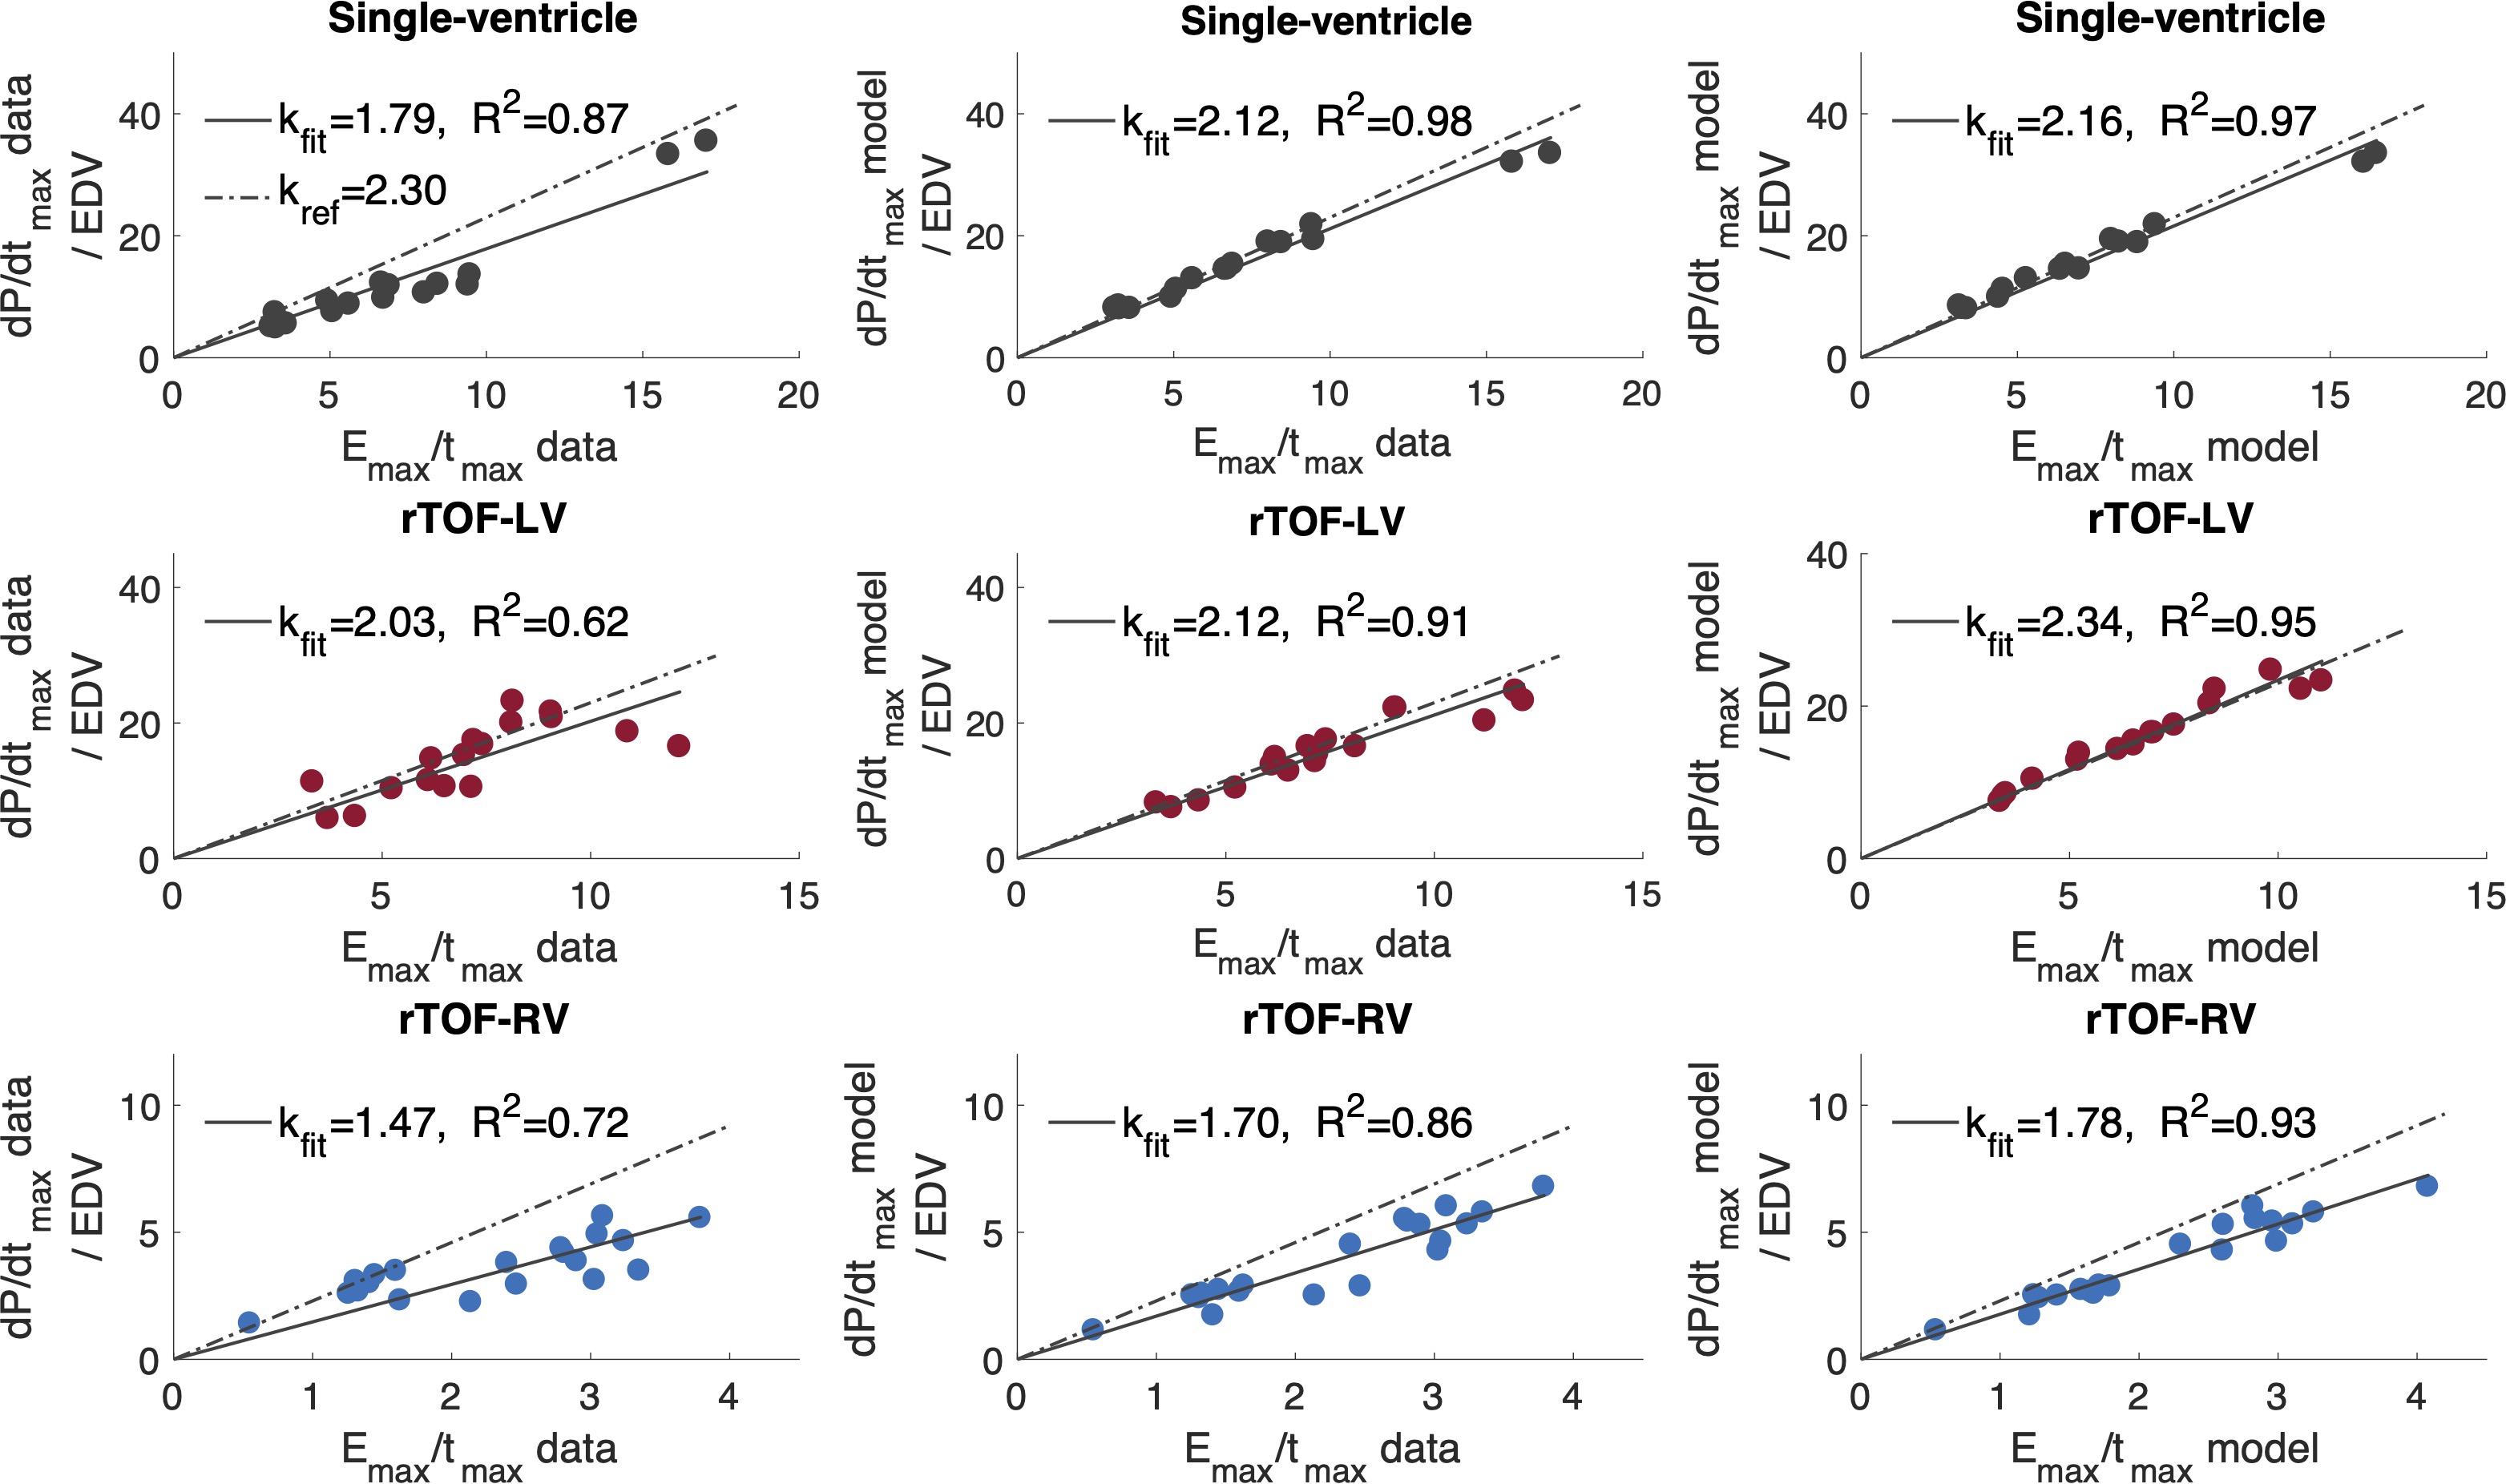
Figure 3. Linear regression models (kfit) for the relationship between maximum value of time-varying elastance (Emax) and maximum time derivative of ventricular pressure max(dP/dt) for single-ventricle patients (black), and left (red) and right (blue) ventricles of patients with rTOF. R2 is a coefficient of determination at p<0.05.
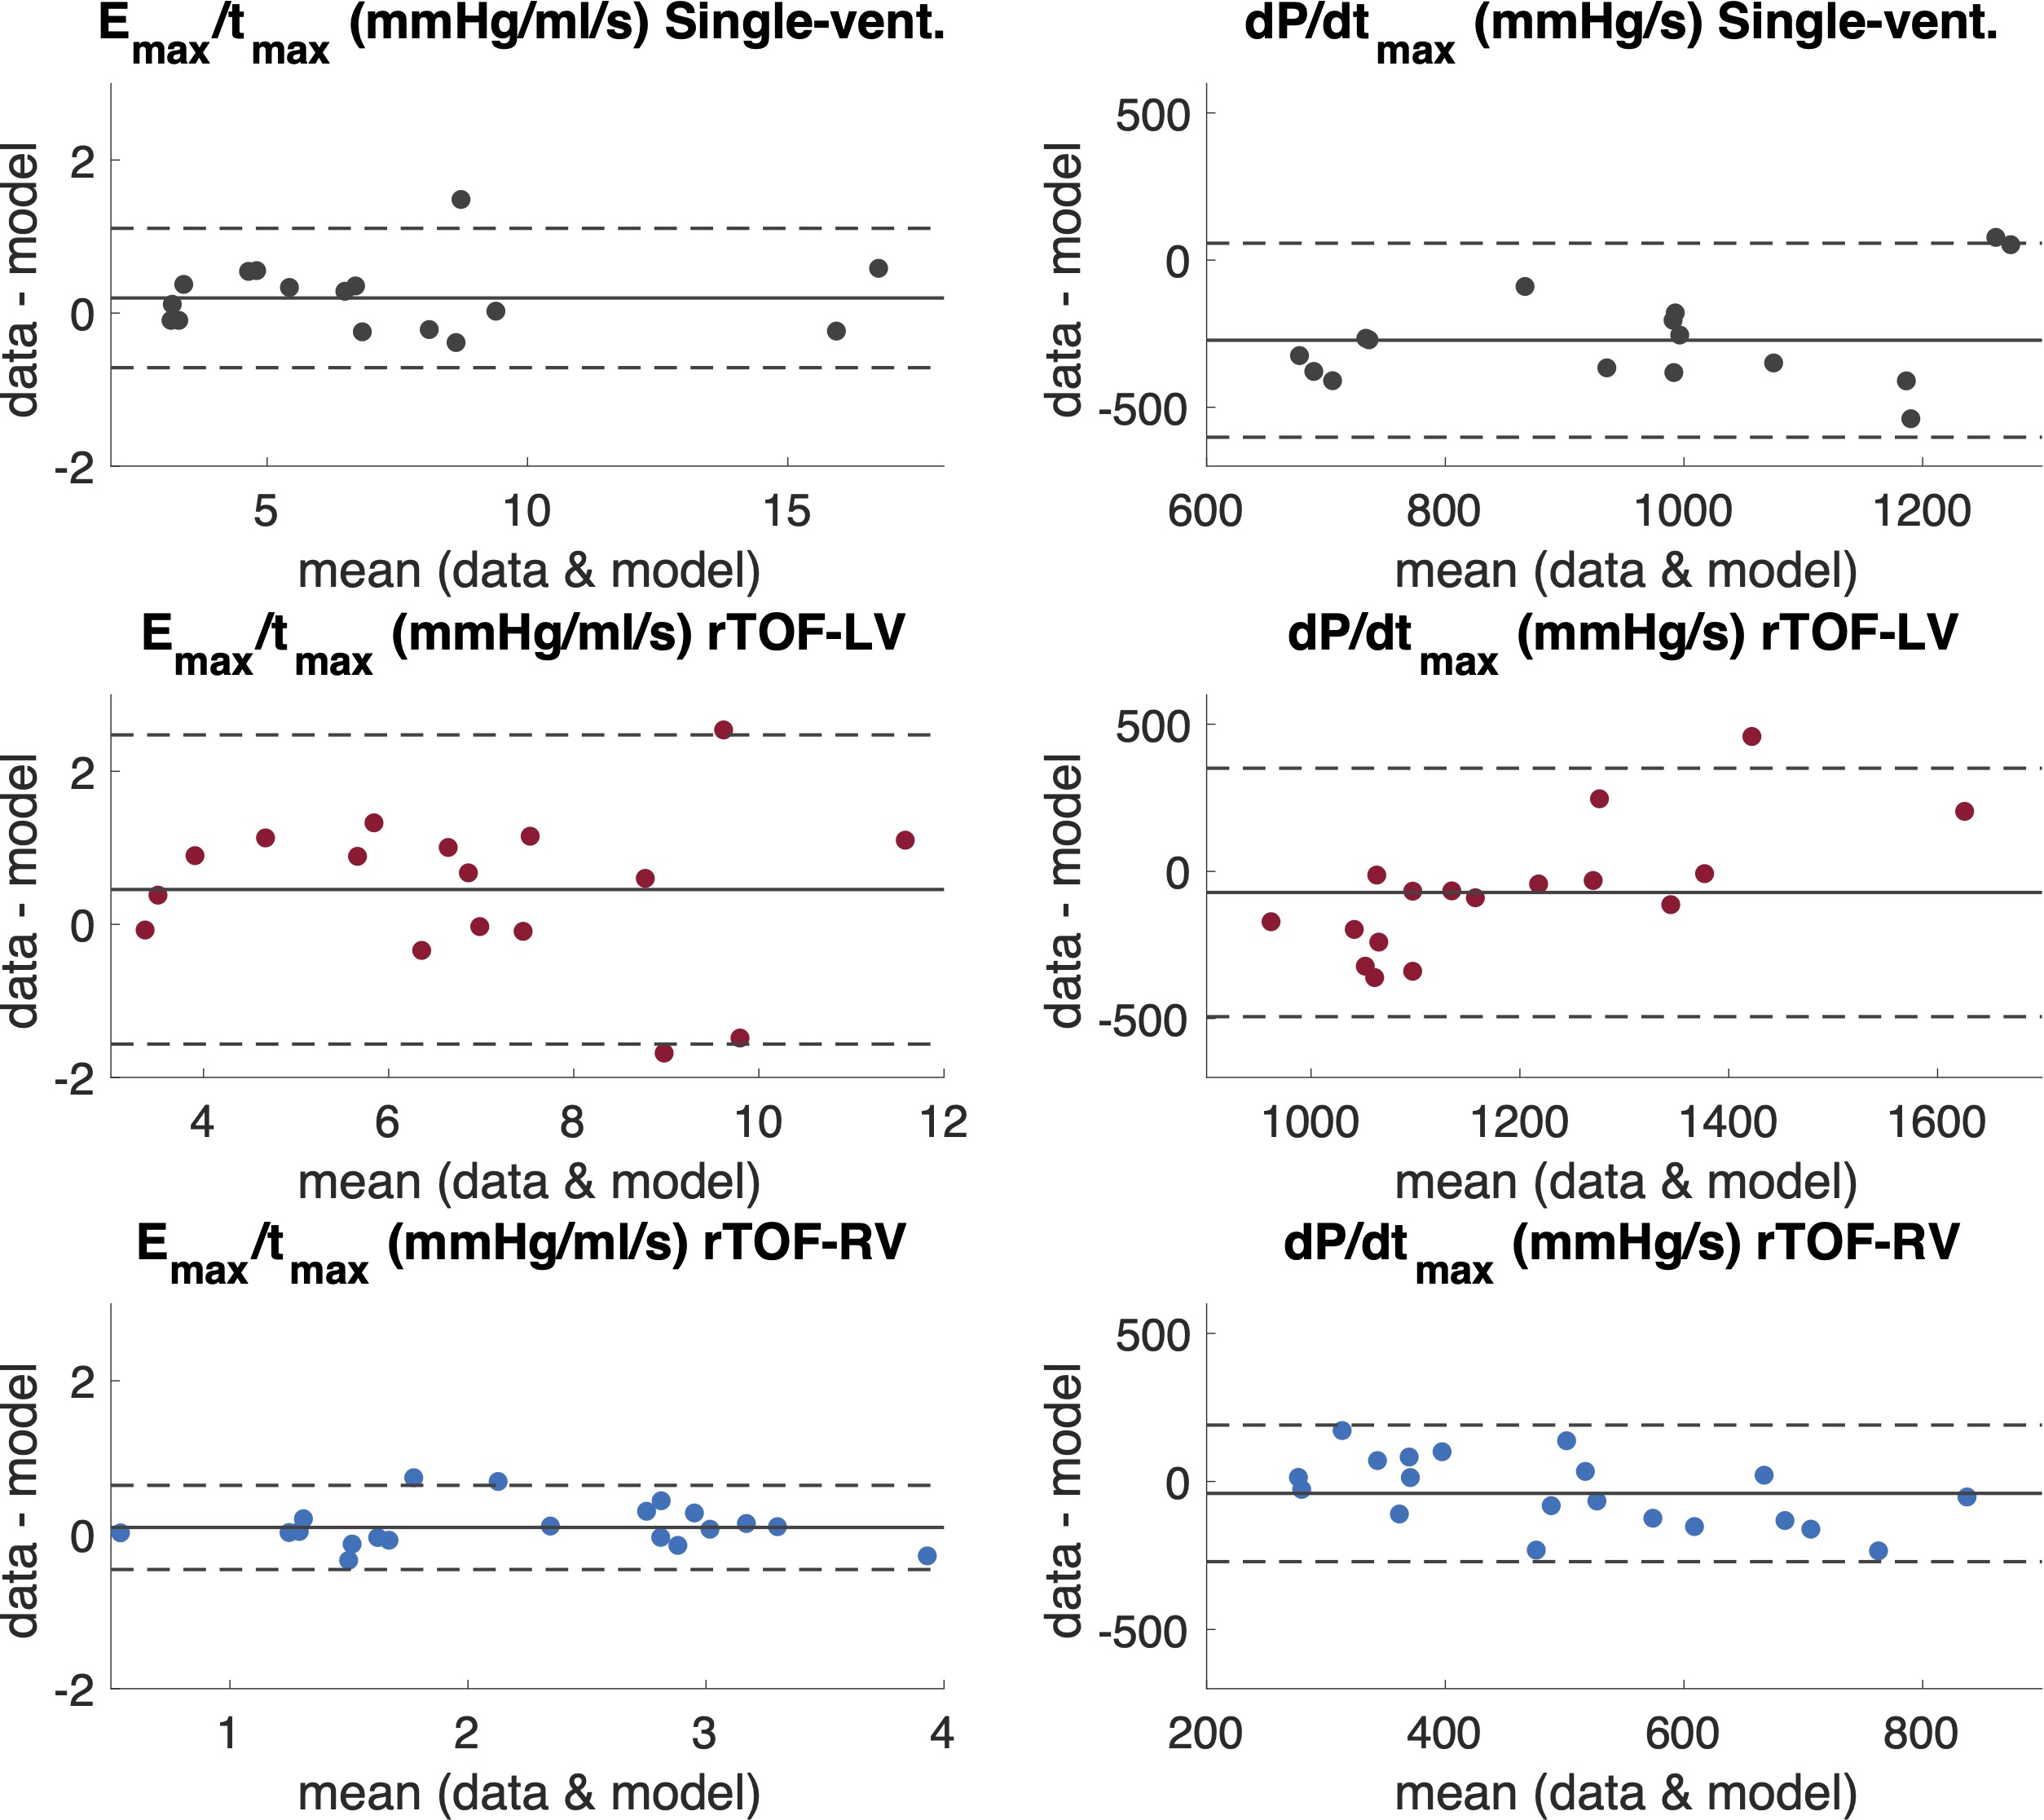
Figure 4. Bland-Altman plots for the ratio of Emax/tmax and maximum value of time derivative of ventricular pressure (dP/dtmax) for single-ventricle patients (black), and left (red) and right (blue) ventricles of patients with repaired tetralogy of Fallot (rTOF). Solid horizontal lines are the mean of the difference between data and the model, top and bottom dashed horizontal lines represent the limits of agreement at 95% confidence interval (±1.96 SD).
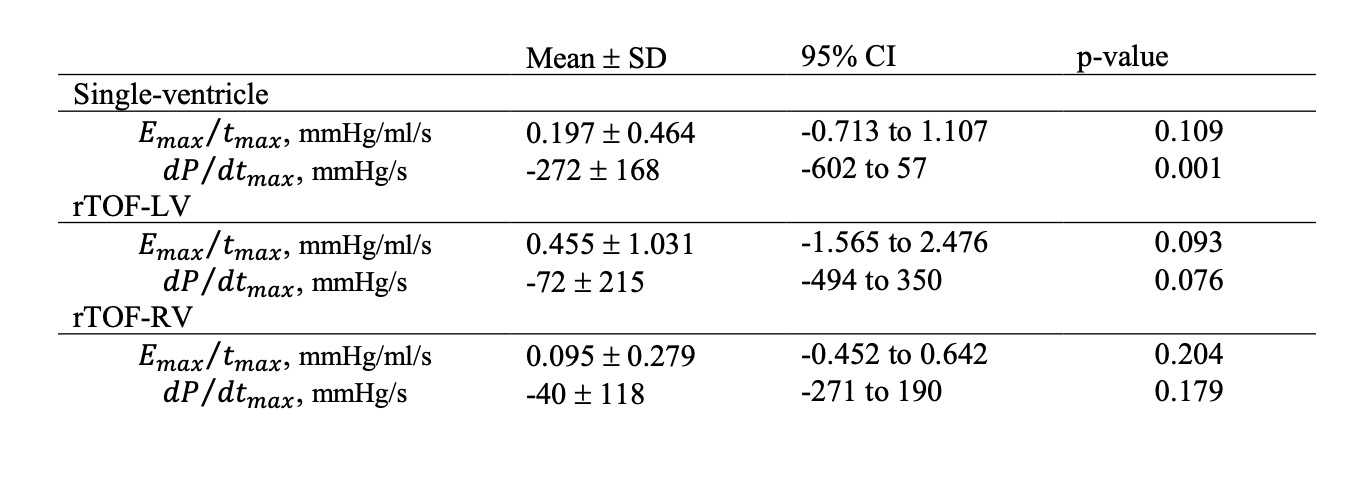
Table 1. Bland-Altman quantitative statistics showing the mean bias ± standard deviation (SD), 95% confidence interval (CI) and p-value of the difference between the measured data and the model at p<0.05 for single-ventricle, repaired tetralogy of Fallot left and right ventricles (rTOF-LV and rTOF-RV, respectively).
DOI: https://doi.org/10.58530/2023/4690