4683
Analysis of segmental strain in identifying HCM with and without outflow tract obstruction1Philips Healthcare, Beijing, China, 2The Second Affiliated Hospital of Harbin Medical University, Harbin, China
Synopsis
Keywords: Cardiomyopathy, Cardiomyopathy, hypertrophic obstructive cardiomyopathy, hypertrophic non-obstructive cardiomyopathy
Hypertrophic cardiomyopathy (HCM) can be divided into two types according to pressure gradient of left ventricular outflow tract, which means different prognosis and risk stratification. Feature tracking technology can be used to calculate strain value in three orientations and evaluate the ability of myocardial deformation. Our results showed that strain differences can be detected between HCM and control group. Segmental strain and torsion also showed significant differential value between hypertrophic obstructive cardiomyopathy (HOCM) and hypertrophic non-obstructive cardiomyopathy (HNOCM) group.Our study may provide evidence in differentiating HOCM and HNOCM for further treatment.Introduction
Hypertrophic cardiomyopathy (HCM) is characterized by genetically abnormal myocardial hypertrophy, which further leads to abnormalities in myocardial morphology and function (1, 2). The differentiation between hypertrophic obstructive cardiomyopathy (HOCM) and hypertrophic non-obstructive cardiomyopathy (HNOCM) is important in clinical practice, because prognosis and risk stratification are totally different (3, 4). Cardiovascular magnetic resonance (CMR) is considered to be golden standard for evaluating cardiac function and structure with advantages of high resolution tissue imaging, noninvasive and nonradioactive (5). Feature tracking technology has been recognized as available method for evaluating cardiac motion ability (6-8). Calculated parameters such as longitude strain, circumferential strain, radial strain and torsion could be vital prediction and prognosis parameters in heart failure and ST-segment elevation myocardial infarction(9, 10). The aim of this study is to investigate the feasibility of feature tracking technology in distinguishing HOCM and HNOCM.Methods
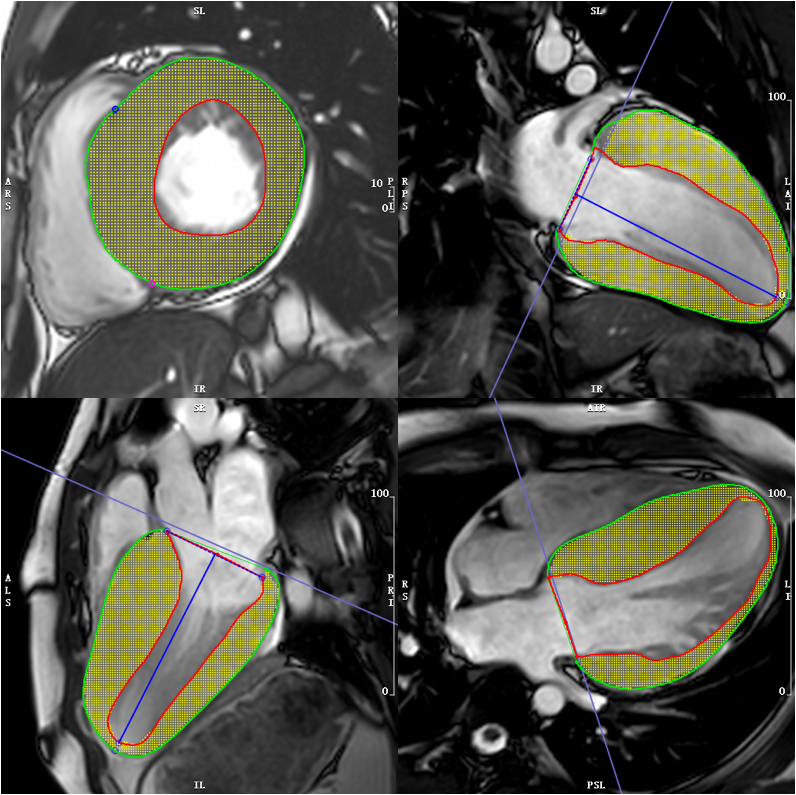
Patients with diagnosed HCM between September 2020 and November 2022 were enrolled, and they were divided into HOCM and HNOCM subgroups according to pressure gradient of left ventricular outflow tract. Healthy subjects were also enrolled as control group.CMR examinations were performed with a 3.0-Tesla scanner (Ingenia CX, Philips Healthcare, the Netherlands) using a 32-channel abdominal coil. Cine images were performed by using a steady-state free precession (SSFP) sequence with a breath-hold and ECG trigger for feature tracking analysis. Scanning parameters were as follows, repetition time (TR) / echo time (TE) = 2.8 / 1.42 ms, field of view (FOV) = 300 × 300 mm2, voxel = 1.8 × 1.6 × 8.0 mm, flip angle = 45°, 8-mm slice thickness. Acquisition of SSFP cines were conducted in 2-chamber, 3-chamber, 4-chamber long-axis planes, as well as a stack of contiguous short-axis slices, which encompassed left ventricular from atrioventricular ring to apex. CVI software (cvi42, Circle Cardiovascular Imaging Incorporation, Calgary, Alberta, Canada) was used for post-processing. Semi-automatic delineating of endocardium and epicardium were conducted by two experienced cardiologists (WXY and LY) (Figure 1). Global longitude strain (GLS), global radial strain(GRS) and global circumferential strain (GCS) were analyzed, as well as segmental strain in three orientations were measured, including basal longitude strain (BLS), basal circumferential strain(BCS), basal radial strain(BRS), mid longitude strain (MLS), mid radial strain (MRS), mid circumferential strain(MCS), apical longitude strain (ALS), apicalcircumferential strain (ACS), apical radial strain (ARS). Statistical analysis was calculated by SPSS software (version 20.0; SPSS, Chicago, Ill). Student t test was used to compare the differences between two groups. Univariable Cox regression models were established to estimate each strain parameters. Diagnostic efficiency was assessed with receiver operating characteristic curve (ROC) analysis, which sensitivity and specificity were also calculated. P value less than 0.05 was considered statistically significant.Results
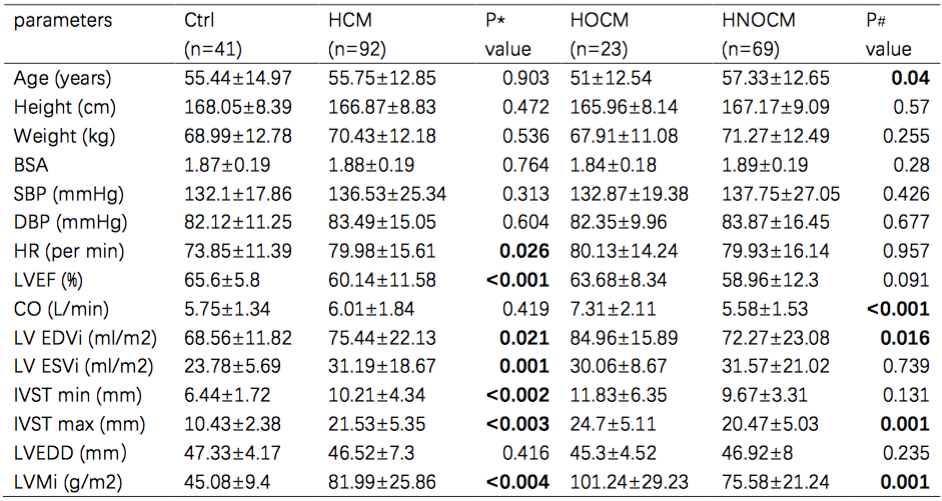
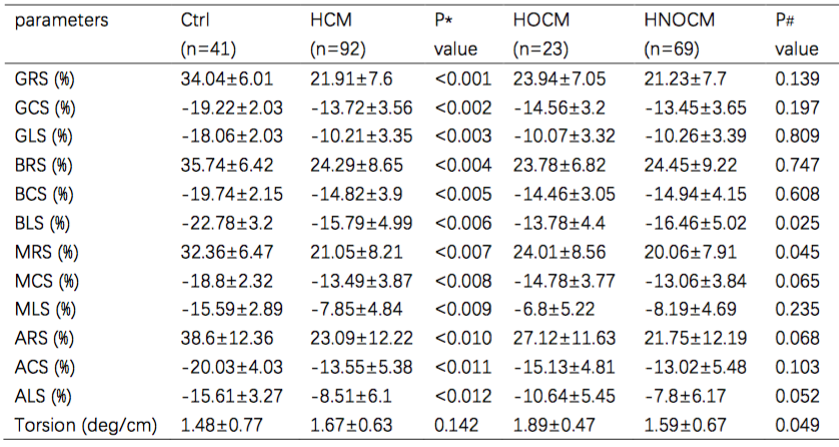
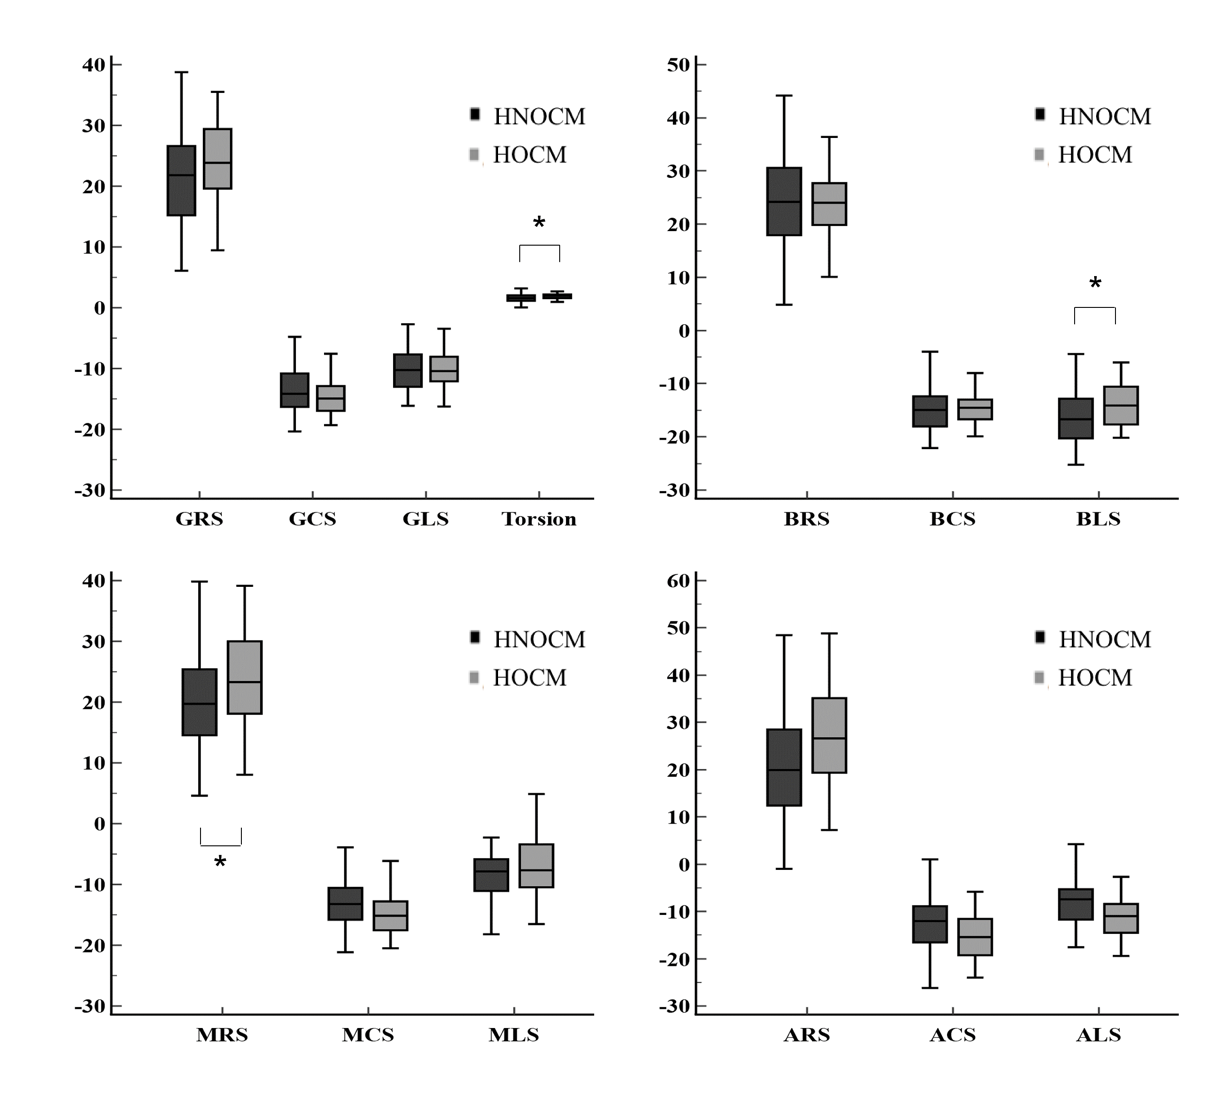
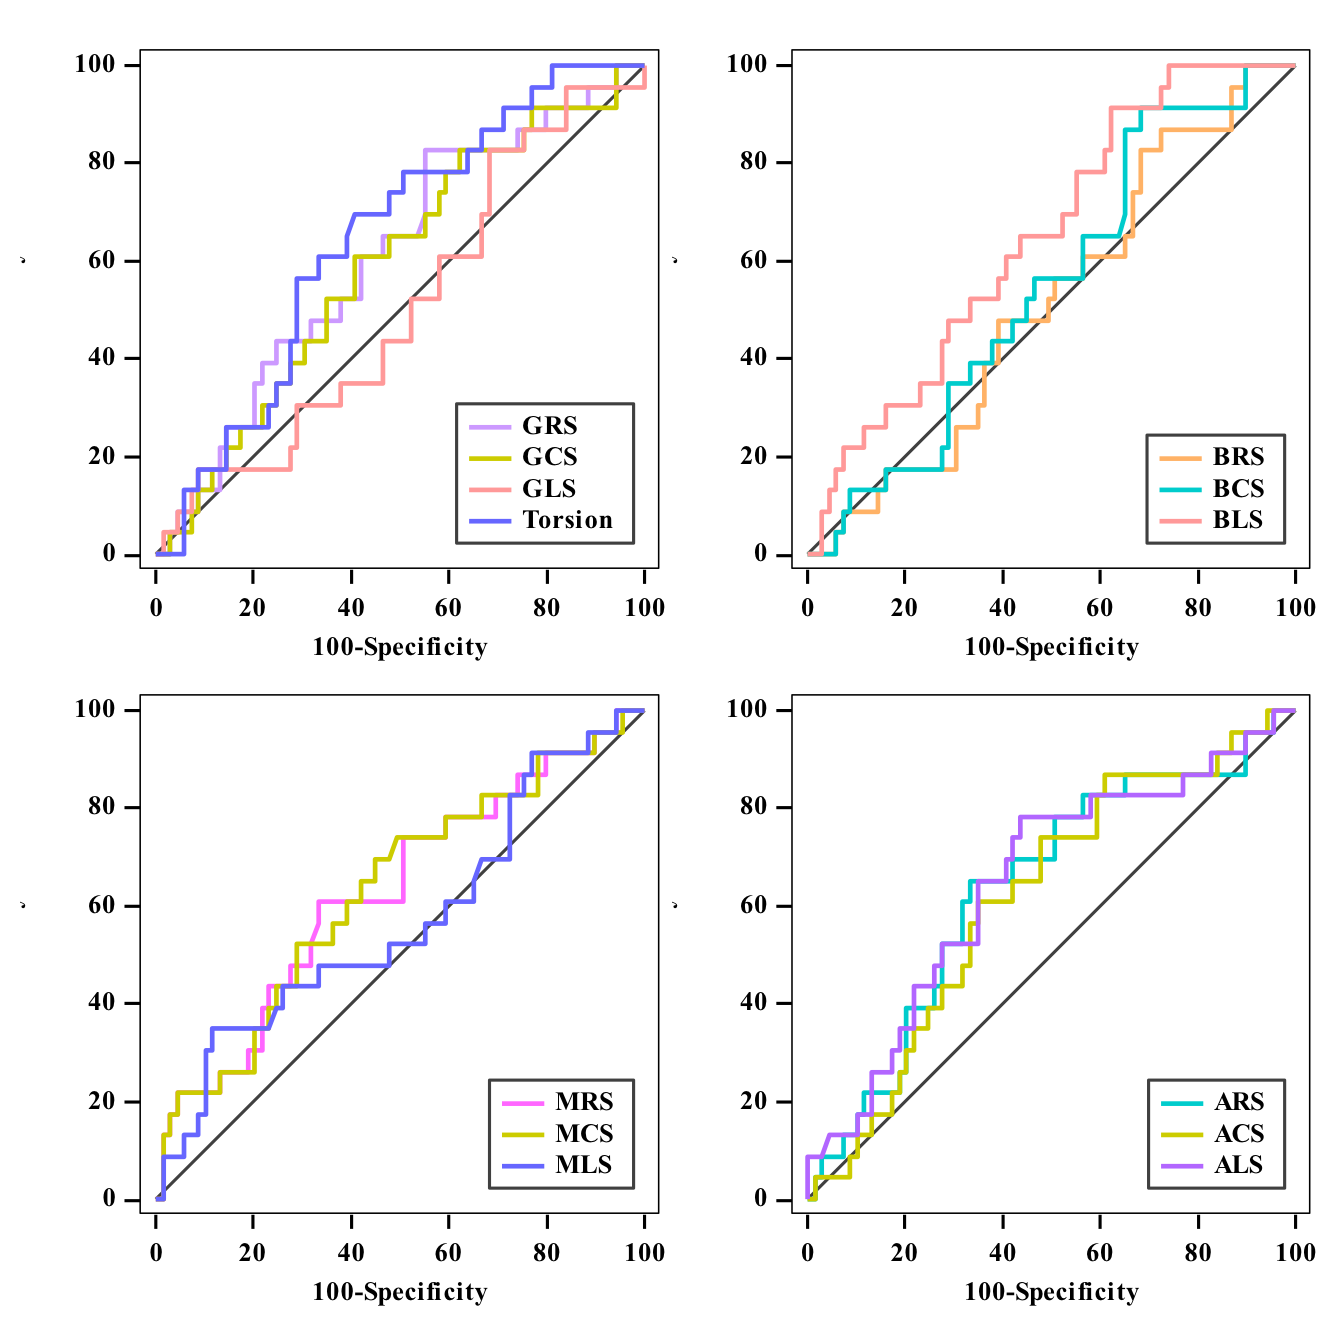
Clinicalcharacteristics were summarized in Table 1. 92 HCM (median age: 55) with 23 HOCM and 69 HNOCM (median age: 51 vs 47, P =0.04) patients were finally enrolled in this study. The mean age of control group was 55, which showed no differences with HCM group. For cardiac functional parameters, left ventricular ejection fraction (LVEF) was significantly lower in HCM group when compared with control group (60.14±11.58 vs 65.6±5.8, P<0.001). Heart rate (HR), LV end-diastolic volume index (EDVi) , LV end-systolic volume index (ESVi), interventricular septum thickness (IVST) min, IVST max and left ventricular mass index (LVMi) were significant higher in HCM group than those in control group (P<0.05). When it comes to HOCM and HNOCM groups, cardiac output (CO), LV EDVi,IVST max and LVMi were obviously higher in HOCM group compared with HNOCM group (P<0.05). For strain parameters, global and segmental strain showed significant differences (P<0.05), while there was no difference in torsion value between HCM and control group. BLS, MRS and torsion showed significant differences between HOCM and HNOCM groups (BLS: -13.78±4.4% vs -16.46±5.02%, P = 0.025; MRS: 24.10±8.56% vs 20.06±7.91%, P =0.045; Torsion: 1.89±0.47 vs 1.59±0.67 (deg/cm), P = 0.049) as showed in Table 2 and Figure 2. Furthermore, receiver operating characteristic (ROC) curves showed BLS and torsion had differential value between HOCM and HNOCM (Figure 3). Area under the curves (AUC) of BLS and torsion were 0.648 and 0.646 with good sensitivity of 91.3% and 69.57%, and acceptable specificity of 37.68% and 59.42%, respectively.Discussion
Feature tracking technology was used to evaluate myocardium deformation in HCM group and further comparison between HOCM and HNOCM groups. Our results showed that cardiac functional parameters, such as LVEF, HR, LV EDVi, LV ESVi were significantly different in HCM group and control group. Global and segmental strain also showed significant differential value, rather than torsion. Furthermore, for the comparison between HOCM and HNOCM groups, there were no obvious differences in LVEF and global myocardial strain, but BLS, MRS and torsion showed significant differences. Previous study illustrated that abnormal strain existed in patients with HCM, which was consistent with the result of this study (11). Researchers confirmed the correlation between impaired myocardium and deformation ability (12, 13). In addition, BLS and torsion could be used to distinguish from HOCM and HNOCM groups, which help build risk stratification in clinical treatment.Conclusion
Feature tracking could be used to evaluate impaired myocardium in HCM patients. Segmental strain analysis provide evidence for discriminating HOCM and HNCM.Acknowledgements
NoneReferences
1. Maron BJ. Clinical Course and Management of Hypertrophic Cardiomyopathy. N Engl J Med. 2018;379(20):1977.
2. Grupa Robocza Europejskiego Towarzystwa Kardiologicznego do spraw rozpoznawania i postepowania w kardiomiopatii p, Elliott PM, Anastasakis A, Borger MA, Borggrefe M, Cecchi F, et al. [2014 ESC Guidelines on diagnosis and management of hypertrophic cardiomyopathy]. Kardiol Pol. 2014;72(11):1054-126.
3. Arzu A, Kamil B, Mustafa A, Mete AH. Surgical management of hypertrophic obstructive cardiomyopathy. General thoracic and cardiovascular surgery. 2020;68(9).
4. Gennady K, Vasyl L, Kostyantyn R, Borys K, Vyacheslav B, Valery Z, et al. Is surgery the gold standard in the treatment of obstructive hypertrophic cardiomyopathy? Interactive cardiovascular and thoracic surgery. 2013;16(1).
5. Liu S, Li Y, Zhao Y, Wang X, Wu Z, Gu X, et al. The Combination of Feature Tracking and Late Gadolinium Enhancement for Identification Between Hypertrophic Cardiomyopathy and Hypertensive Heart Disease. Frontiers in cardiovascular medicine. 2022;9:865615.
6. Overhoff D, Ansari U, Hohneck A, Tülümen E, Rudic B, Kuschyk J, et al. Prediction of cardiac events with non-contrast magnetic resonance feature tracking in patients with ischaemic cardiomyopathy. ESC heart failure. 2021.
7. Nazir S, Shetye A, Khan J, Singh A, Arnold J, Squire I, et al. Inter-study repeatability of circumferential strain and diastolic strain rate by CMR tagging, feature tracking and tissue tracking in ST-segment elevation myocardial infarction. The international journal of cardiovascular imaging. 2020;36(6):1133-46.
8. Xu J, Yang W, Zhao S, Lu M. State-of-the-art myocardial strain by CMR feature tracking: clinical applications and future perspectives. European radiology. 2022.
9. Leng S, Ge H, He J, Kong L, Yang Y, Yan F, et al. Long-term Prognostic Value of Cardiac MRI Left Atrial Strain in ST-Segment Elevation Myocardial Infarction. Radiology. 2020;296(2):299-309.
10. A KA, Carolina D, Christian N, Matthias K, Robert S, Franz D, et al. Feature Tracking of Global Longitudinal Strain by Using Cardiovascular MRI Improves Risk Stratification in Heart Failure with Preserved Ejection Fraction. Radiology. 2020;296(2).
11. M VD, Eunice Y, J JP, W TM, Hoshang F, Linda C, et al. Left Ventricular Strain Is Abnormal in Preclinical and Overt Hypertrophic Cardiomyopathy: Cardiac MR Feature Tracking. Radiology. 2019;290(3).
12. Chirinos J, Sardana M, Ansari B, Satija V, Kuriakose D, Edelstein I, et al. Left Atrial Phasic Function by Cardiac Magnetic Resonance Feature Tracking Is a Strong Predictor of Incident Cardiovascular Events. Circulation Cardiovascular imaging. 2018;11(12):e007512.
13. Rajiah P, Kalisz K, Broncano J, Goerne H, Collins J, François C, et al. Myocardial Strain Evaluation with Cardiovascular MRI: Physics, Principles, and Clinical Applications. Radiographics : a review publication of the Radiological Society of North America, Inc. 2022;42(4):968-90.
Figures