4674
Same-day Comparison of 129Xe MRI Ventilation Across Two MRI Manufacturers1Centre for Heart Lung Innovation, St. Paul's Hospital, University of British Columbia, Vancouver, BC, Canada, 2BC Children's Hospital Research Institute, Vancouver, BC, Canada, 3Division of Respiratory Medicine, Department of Medicine, University of British Columbia, Vancouver, BC, Canada, 4Department of Radiology, University of British Columbia, Vancouver, BC, Canada, 5Department of Pediatrics, University of British Columbia, Vancouver, BC, Canada
Synopsis
Keywords: Lung, Hyperpolarized MR (Gas)
Hyperpolarized 129Xe gas MRI (XeMRI) is gaining traction globally as a primary endpoint in clinical trials, however it is unknown how images and measurements directly compare across different MRI scanner platforms. Here we compared same-day ventilation XeMRI across two MRI manufacturers at two sites in Vancouver Canada in patients with cystic fibrosis and healthy controls, to determine the interoperability across MRI platforms. Between-site ventilation images showed strong spatial overlap, and quantitative ventilation defect percent measurements showed strong agreement across all participants. These results support the use of XeMRI in multi-center studies irrespective of MRI platform.Introduction
Hyperpolarized 129Xe gas MRI (XeMRI) provides a way to sensitively visualize and measure ventilation abnormalities in people with respiratory disease.1 Although still primarily a research tool, XeMRI is gaining traction globally as a primary endpoint in multi-center clinical trials2,3 and for clinical examinations, with existing approval in the UK and US FDA submission currently under review.4 Most published XeMRI studies to date however have been single-center, therefore it is currently unknown how XeMR images and measurements compare across different MRI platforms. We aimed to compare same-day static ventilation XeMRI across two MRI manufacturers to determine the cross-platform interoperability of images and quantitative measurements.Methods
Participants and Data Acquisition: Participants with cystic fibrosis (CF) and healthy controls provided written informed consent to ethics-board-approved protocols and underwent same-day XeMRI at two sites in Vancouver Canada: BC Children’s Hospital (Site1) and St. Paul’s Hospital (Site2), approximately 3.9-miles apart by car. Site order was determined by respective scanner availability and was randomized to the best of our ability. Spirometry was performed at Site1 only, before or after MRI so as not to be between MRI studies. Ventilation XeMRI was performed at both sites according to published guidelines4 with paired anatomical 1H MRI using fast-spoiled gradient-echo sequences, using a 3.0T Discovery MR750 (GE Healthcare, USA) at Site1 and 3.0T Magnetom Vida (Siemens Healthineers, Germany) at Site2.All other imaging factors were the same across sites, using dedicated equipment at each. 129Xe gas was polarized using 9820 Hyperpolarizers (Polarean Inc., USA) and 129Xe images were acquired using flexible vest chest coils (Clinical MR Solutions, USA). 1H images were acquired using the inherent body coils. Number of slices for 129Xe/1H MRI was matched between sites. Participants inhaled a gas mixture from a 1.0L Tedlar-bag from functional residual capacity and image acquisition was performed under breath-hold conditions. 129Xe doses (0.45L or 0.50L) and total inhaled gas volumes (0.85L or 1.0L) were determined by participant height and duplicated between sites. 129Xe was diluted to the total volume using ultra-high purity N2 gas, and 1H MRI was performed using 100% medical air.
Data Analysis: Image analysis was performed using MATLAB R2021a (Mathworks, USA). Static ventilation images were segmented by a single observer in a randomized order to generate ventilation defect percent (VDP) defined as ventilation defect volume normalized to thoracic cavity volume (TCV).5 The VDP equivalence margin was pre-defined as the algorithm’s smallest detectable difference of 2%.5 Signal-to-noise ratio (SNR) was calculated on a slice-by-slice basis and averaged across all slices. Ventilation images from both sites were co-registered using the modality-independent neighbourhood descriptor (MIND) deformable registration method6 to quantify overlap of ventilated regions using the Dice similarity coefficient (DSC). Deformable registration consisted of voxel-wise similarity measurements of the MIND of the two images, with diffusion regularization of the deformation field and optimization using the Gauss-Newton framework. Registration was performed symmetrically with four levels (downsampling factor 6-4-2-1) so that the algorithm was not dependent on the choice of the moving/fixed image. Polarization efficiency, SNR, VDP and TCV were compared between sites using Wilcoxon signed-rank tests. VDP was further compared using the Spearman correlation coefficient and Bland-Altman analysis.
Results
We evaluated six participants with CF (38-years[28,48], 2F) and three healthy controls (32-years[29,47], 1F; Table 1). XeMRI was performed across sites within a maximum of 4-hours,41-minutes (median [interquartile-range (IQR)] 3-hours,0-minutes [2-hours,48-minutes, 4-hours,20-minutes]. Figure 1 shows center-slice XeMRI ventilation at both sites and corresponding overlap maps for three representative CF participants and one control, demonstrating qualitative agreement in ventilation patterns. DSC was 94.4 [91.5,96.5] across all participants, 92.9 [91.3,94.4] for CF participants and 98.1 [97.3,98.4] for controls. Polarization efficiency (29.1% [27.5,29.4] vs. 37.5% [36.8,38.9], p=0.008) and SNR (62.3 [48.8,77.4] vs. 84.3 [74.2,93.2], p=0.02) were significantly greater at Site2, however VDP (7.0% [0.2,28.0] vs. 8.2% [0.4,19.7], p=0.7) and TCV (4.7L [4.1,5.0] vs. 5.0L [4.1,5.1], p=0.09) were not different (Figure 2). VDP was strongly correlated between sites (ρ=0.93, p<0.001) and Bland-Altman 95% limits of agreement were [-5.2,7.2] with no significant bias (p=0.2; Figure 3). Three CF participants and all controls fell within the ±2% equivalence margin, whereas two CF participants narrowly fell outside the margin (+2.3%,-2.5%) but within Bland-Altman limits. One CF participant fell outside the Bland-Altman limits (+8.3%) but underwent an additional same-day XeMRI scan at Site1 30-minutes prior as part of a separate variability investigation (Figure 4). The ventilation pattern and quantitative VDP differences between the three same-day images demonstrate the variability likely related to CF pathophysiology, despite elexacaftor-tezacaftor-ivacaftor therapy.Discussion
In this interim analysis, XeMRI was qualitatively and quantitatively comparable in same-day investigations across two sites using different MRI scanner manufacturers, despite different site-specific 129Xe polarization and SNR. Only one CF participant fell outside the pre-defined equivalence margin and limits of agreement for VDP, which could be attributed to CF pathophysiology rather than imaging factors. Future phantom evaluations7 will help to further objectively characterize similarities and/or differences between MRI platforms by removing variability caused by pulmonary pathophysiology.Conclusion
XeMRI ventilation and VDP in the same patients were strongly spatially and quantitatively related across two MRI platforms in same-day imaging studies, supporting the use of XeMRI in multi-center studies and as a clinical tool irrespective of MRI platform.Acknowledgements
This work was supported by the CF Foundation.References
1. Mugler, J. P., 3rd & Altes, T. A. Hyperpolarized 129Xe MRI of the human lung. J Magn Reson Imaging 37, 313-331, doi:10.1002/jmri.23844 (2013).
2. ClinicalTrials.gov. BEGIN Novel ImagiNG Biomarkers (BEGINNING), <https://www.clinicaltrials.gov/ct2/show/NCT05517655> (2022).
3. ClinicalTrials.gov. A Study Of ¹²⁹XE MRI To Assess Disease Progression In Patients With COPD Treated With Or Without Azithromycin And Standard-of-Care Medications, <https://www.clinicaltrials.gov/ct2/show/NCT04353661> (2022).
4. Niedbalski, P. J. et al. Protocols for multi-site trials using hyperpolarized (129) Xe MRI for imaging of ventilation, alveolar-airspace size, and gas exchange: A position paper from the (129) Xe MRI clinical trials consortium. Magn Reson Med, doi:10.1002/mrm.28985 (2021).
5. Kirby, M. et al. Hyperpolarized 3He magnetic resonance functional imaging semiautomated segmentation. Acad Radiol 19, 141-152, doi:10.1016/j.acra.2011.10.007 (2012).
6. Heinrich, M. P. et al. MIND: modality independent neighbourhood descriptor for multi-modal deformable registration. Med Image Anal 16, 1423-1435, doi:10.1016/j.media.2012.05.008 (2012).
7. Bier, E. A. et al. A thermally polarized (129) Xe phantom for quality assurance in multi-center hyperpolarized gas MRI studies. Magn Reson Med 82, 1961-1968, doi:10.1002/mrm.27836 (2019).
Figures
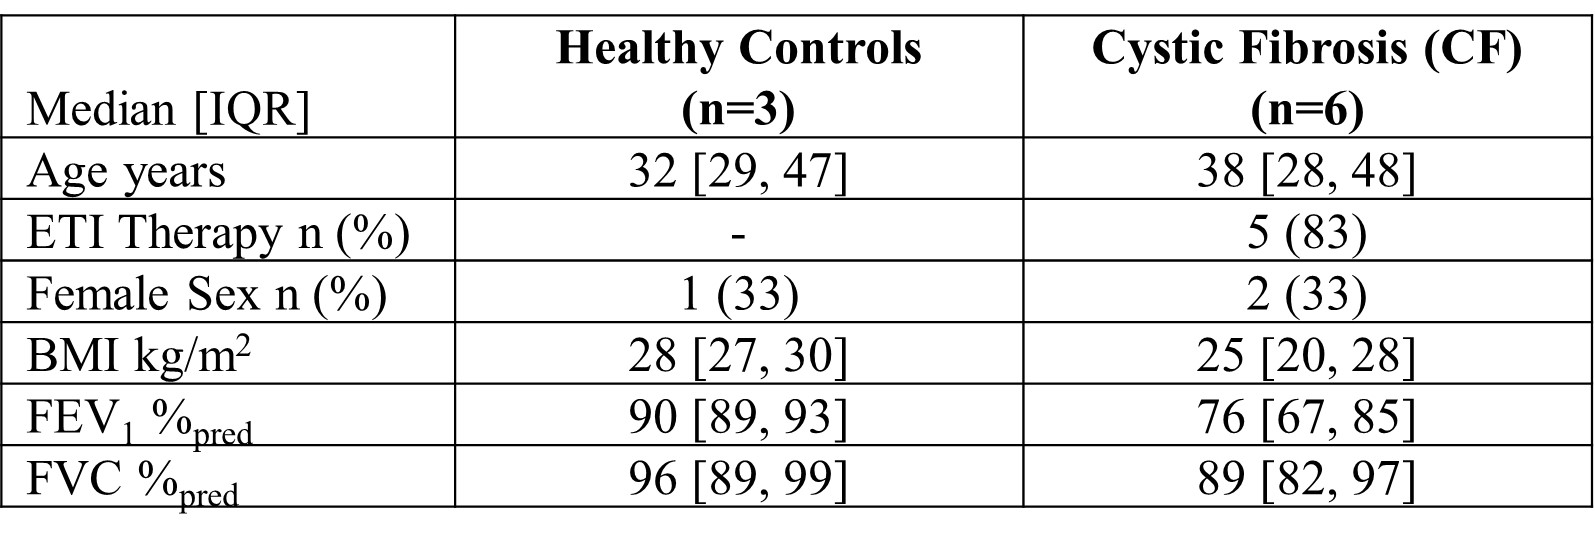
Table 1. Participant Demographics.
IQR=interquartile range; ETI=elexacaftor-tezacaftor-ivacaftor; BMI=body mass index; FEV1=forced expiratory volume in one second; %pred=percent of predicted; FVC=forced vital capacity.
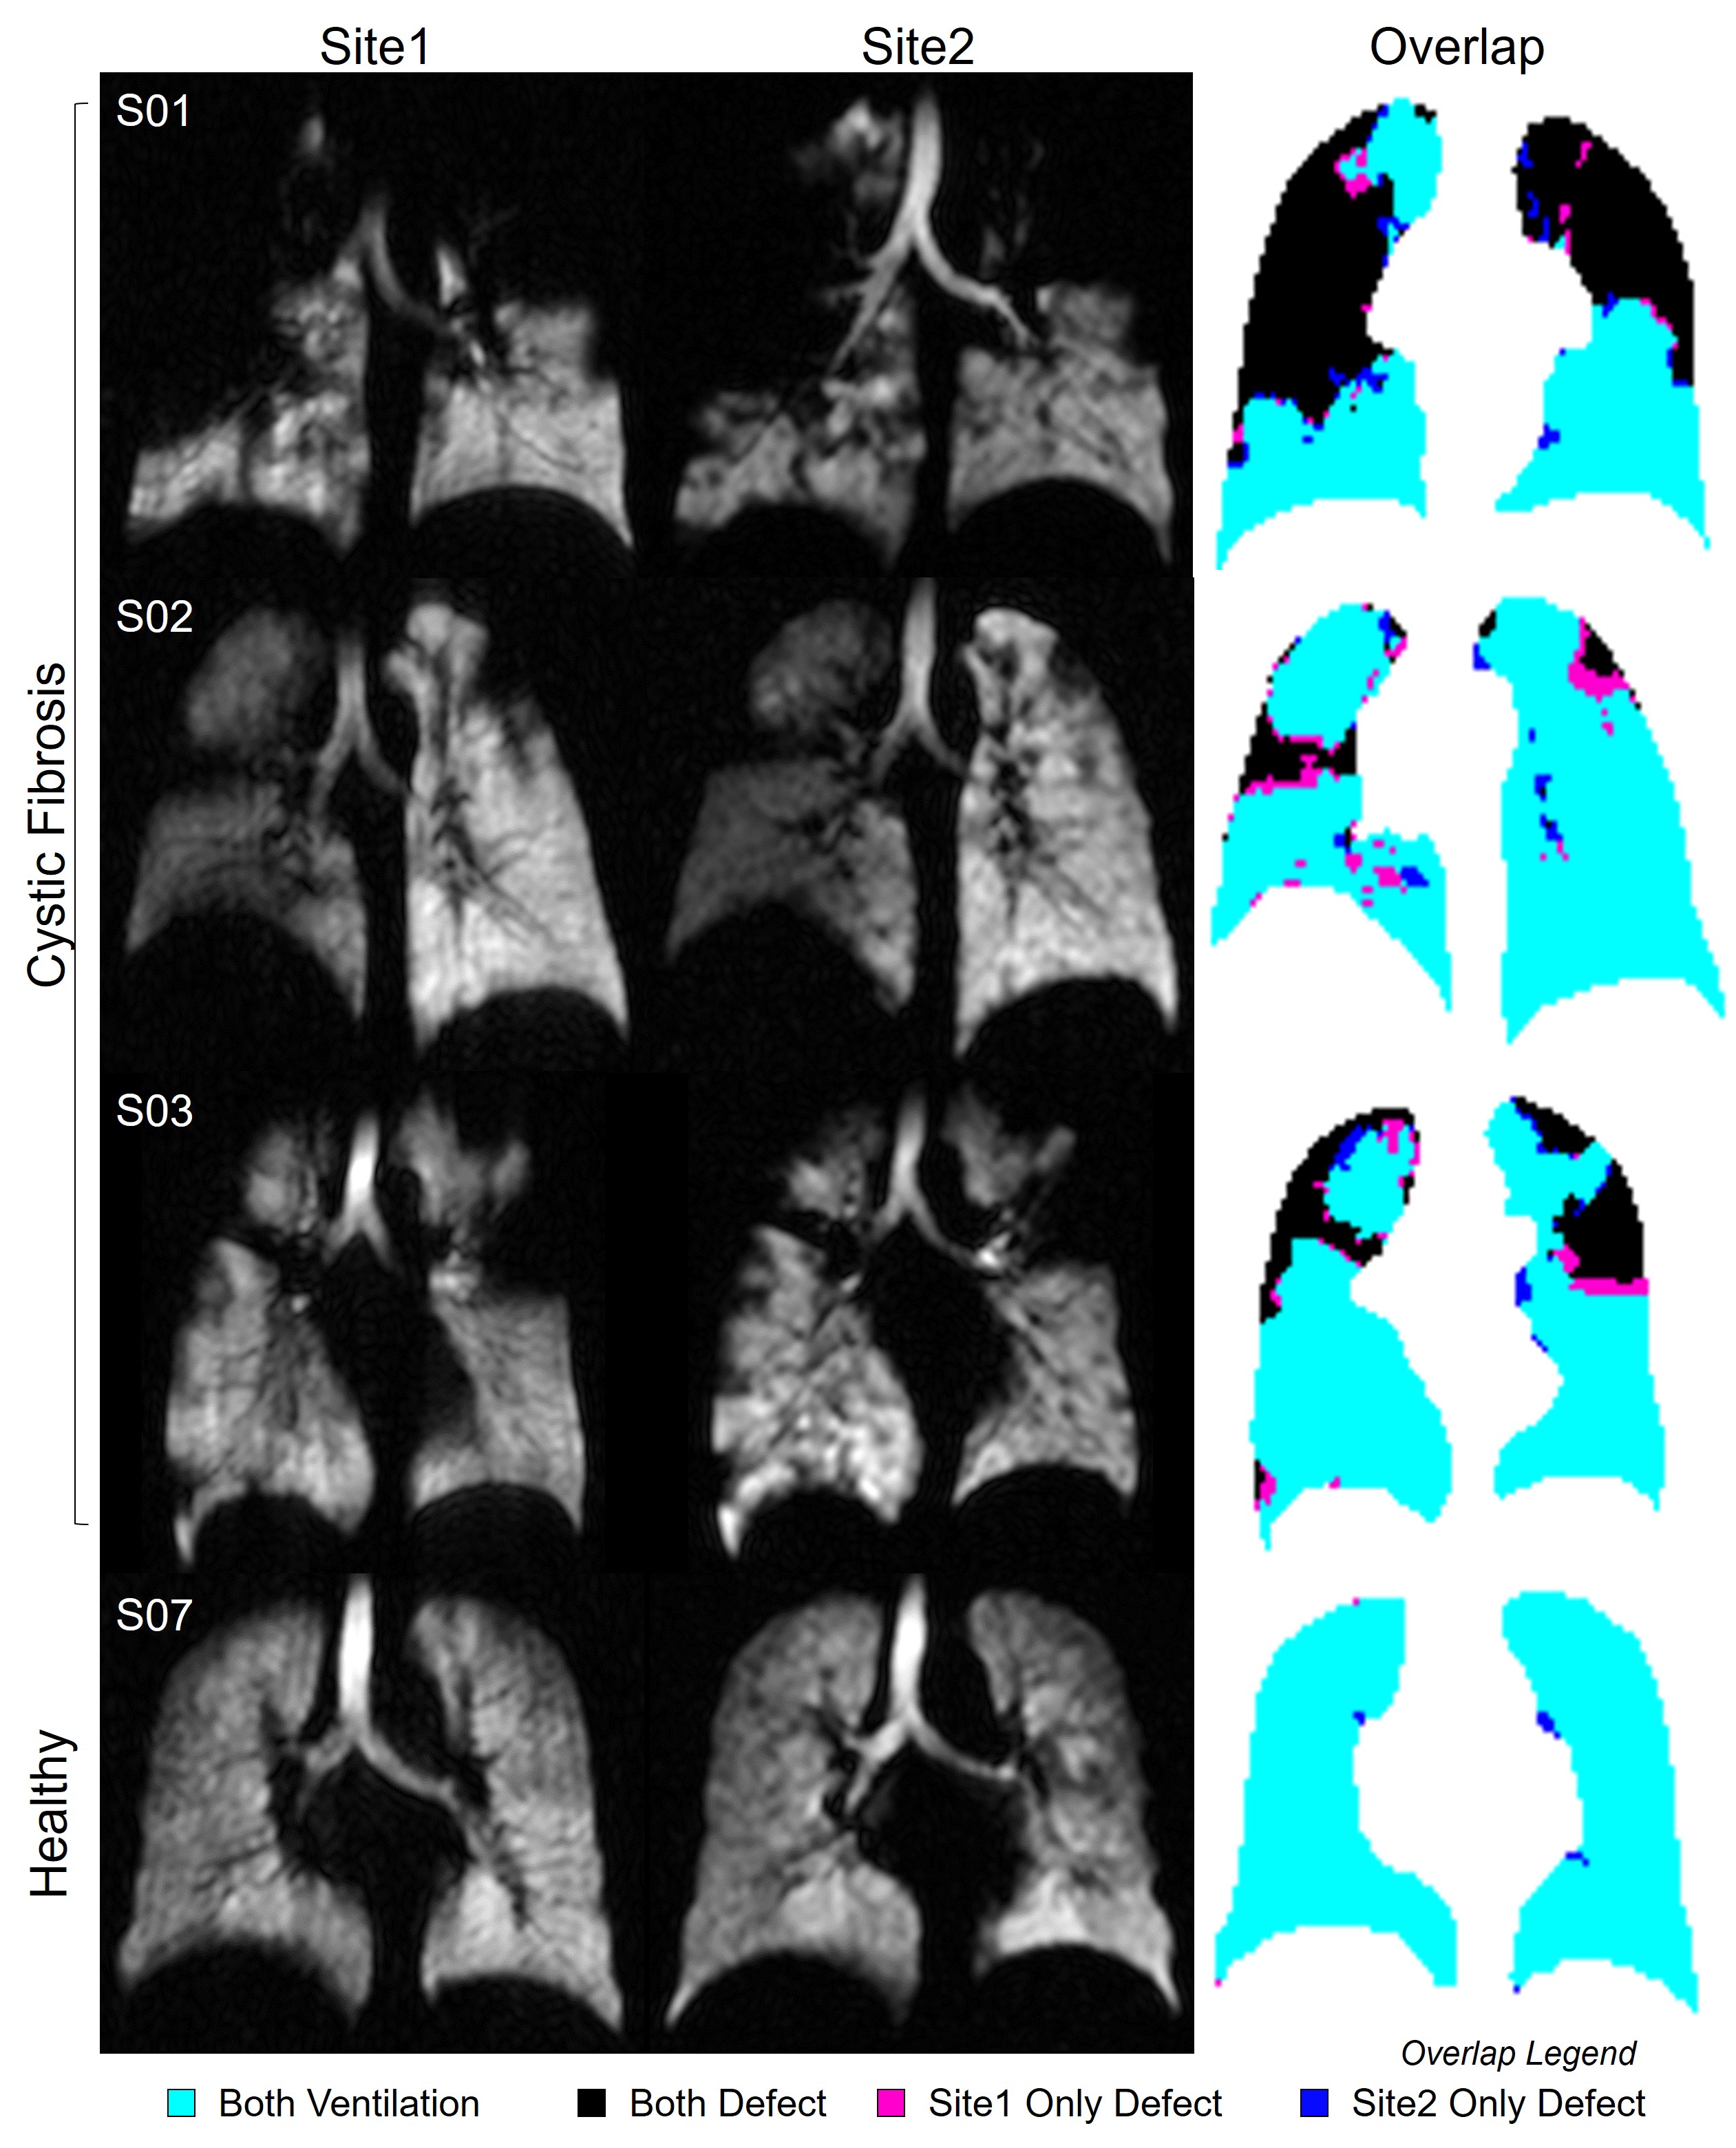
Figure 1. XeMRI at Each Site and Corresponding Overlap Maps.
Ventilation XeMRI at both sites and corresponding co-registered overlap maps for four representative participants (three CF, one healthy control) show qualitative agreement in ventilation pattern between both sites. Overlap legend: cyan=ventilation at both sites, black=defect at both sites, pink=defect at Site1 only, dark blue=defect at Site2 only.
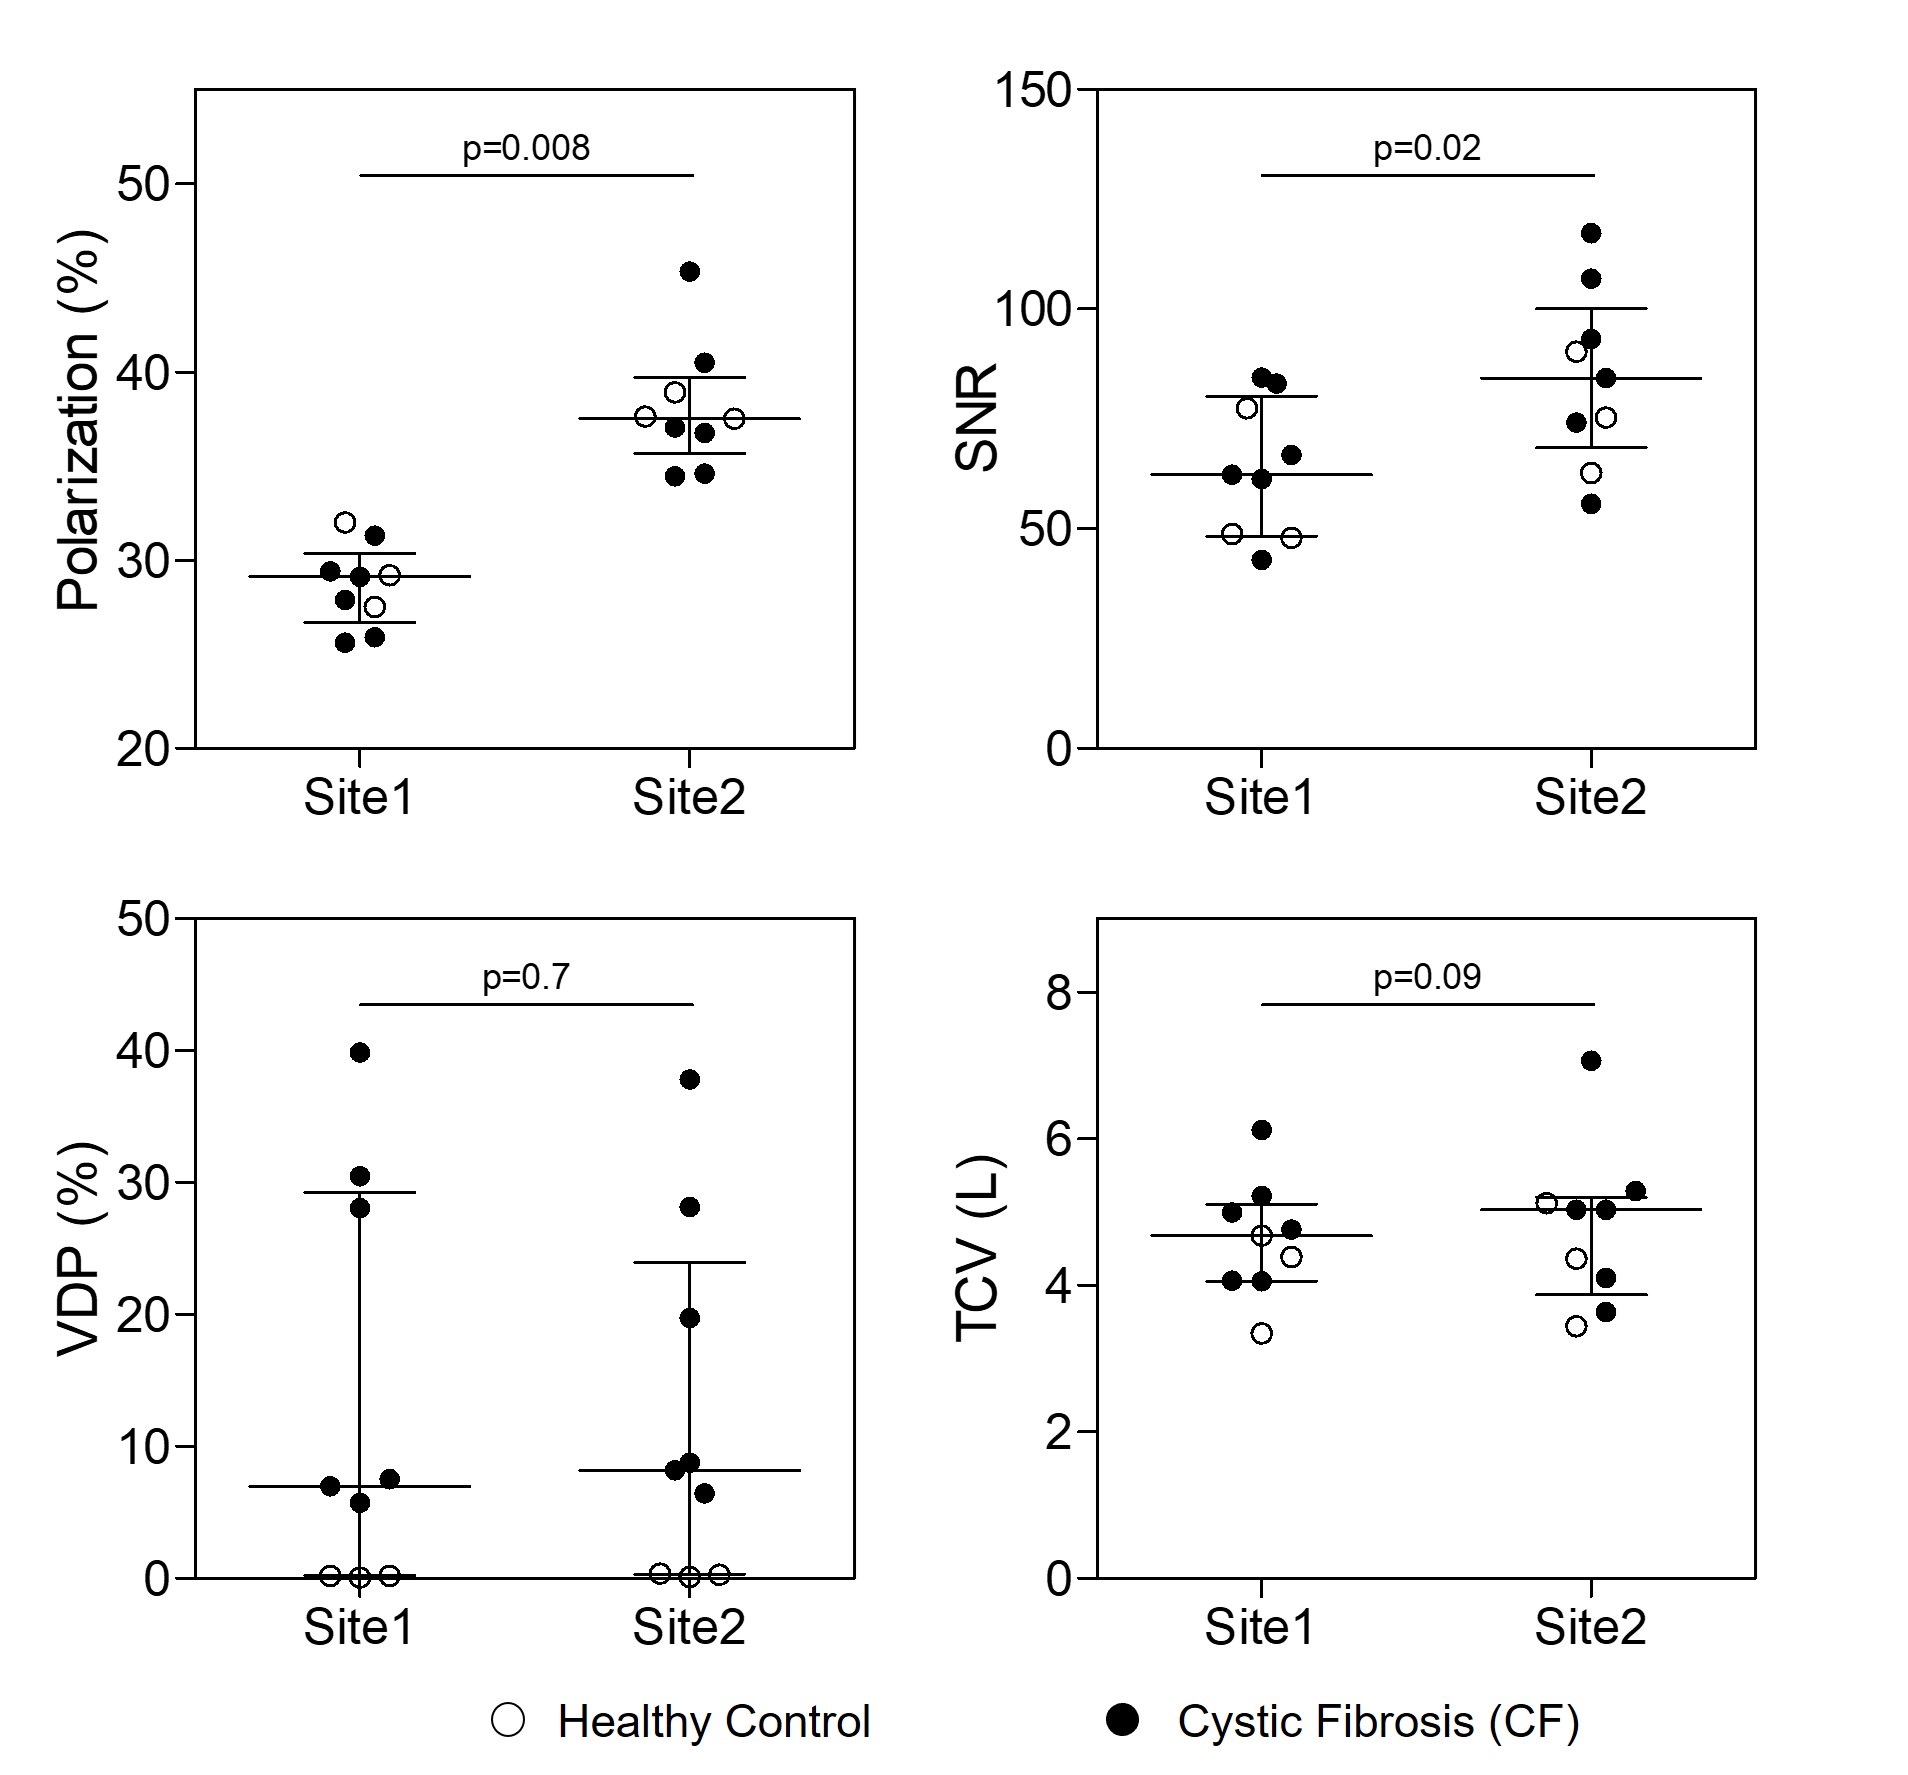
Figure 2. Comparison of Imaging Parameters and Measurements Between Sites.
Polarization efficiency (p=0.008) and signal-to-noise ratio (SNR; p=0.02) were significantly different between Site1 and Site2, however ventilation defect percent (VDP; p=0.7) and 1H thoracic cavity volume (TCV; p=0.09) were not different. Plot lines represent median and interquartile range.
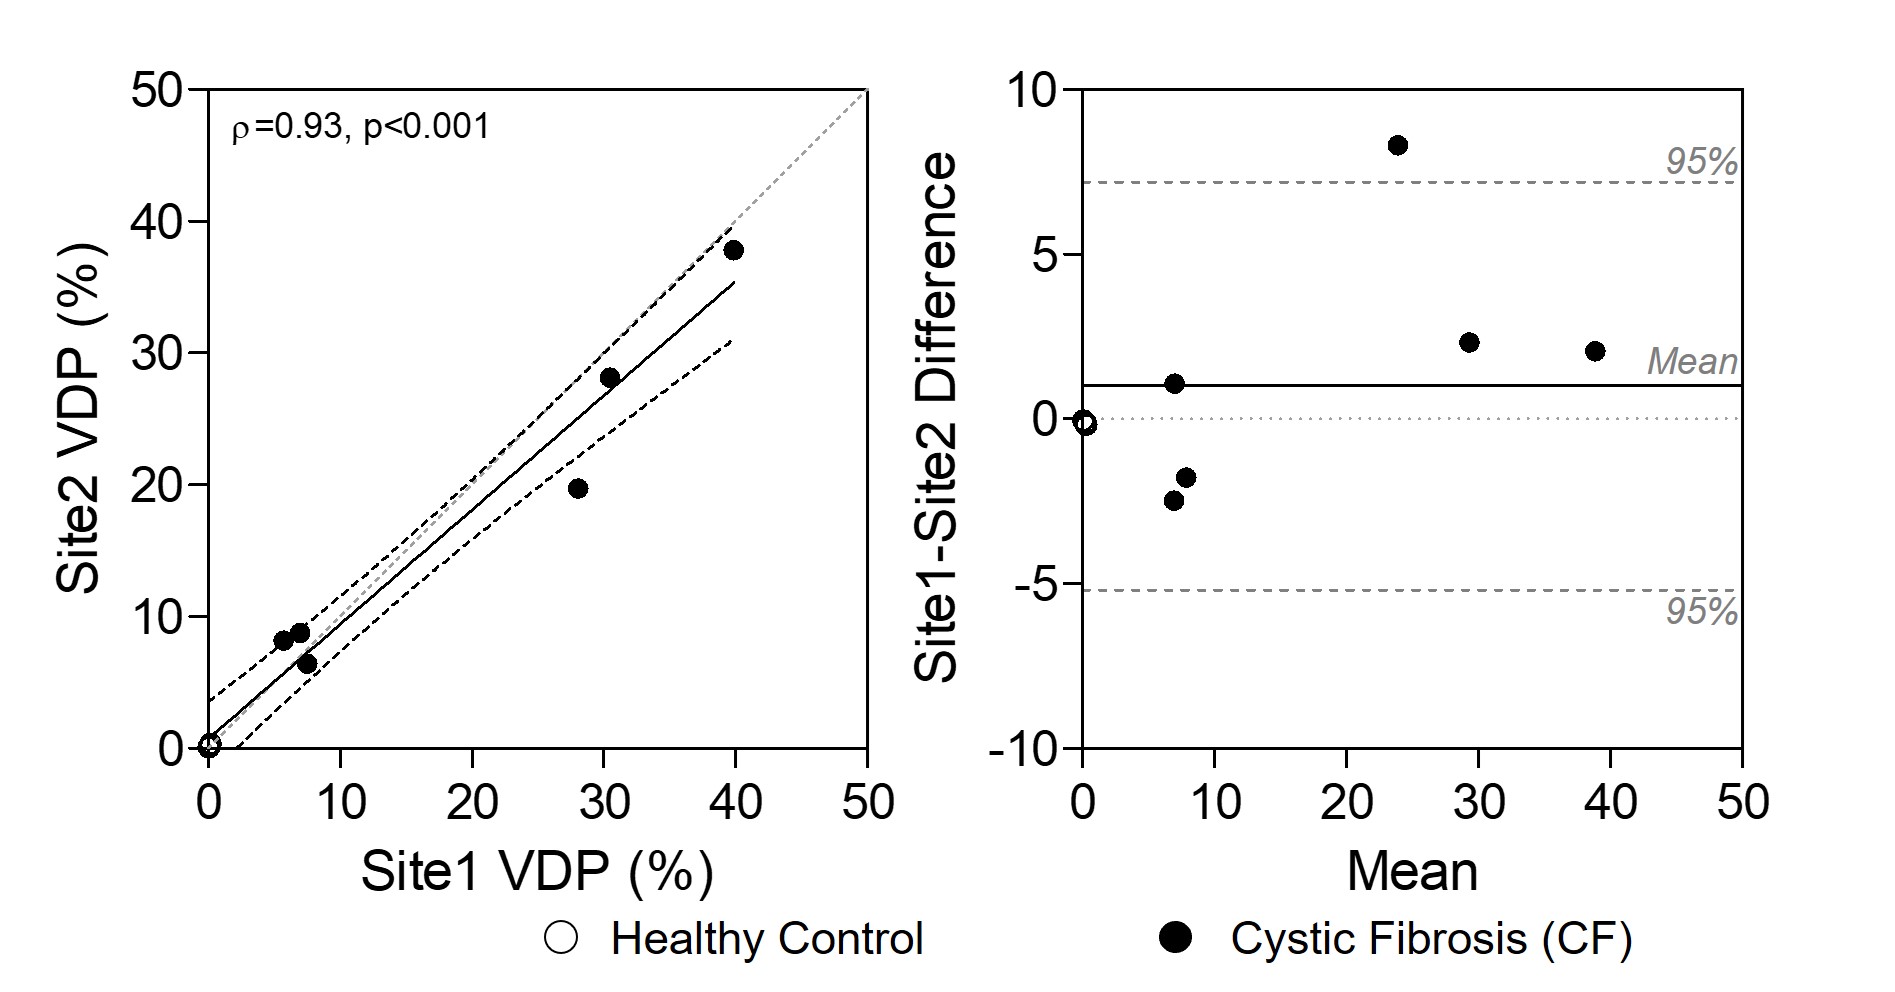
Figure 3. VDP Relationship and Bias Between Sites.
Ventilation defect percent (VDP) was significantly correlated between Site1 and Site2 (ρ=0.93, p<0.001). Bland-Altman limits of agreement were -5.2 to 7.2, with no significant bias (p=0.2). Note three healthy controls are clustered at 0 in both plots.
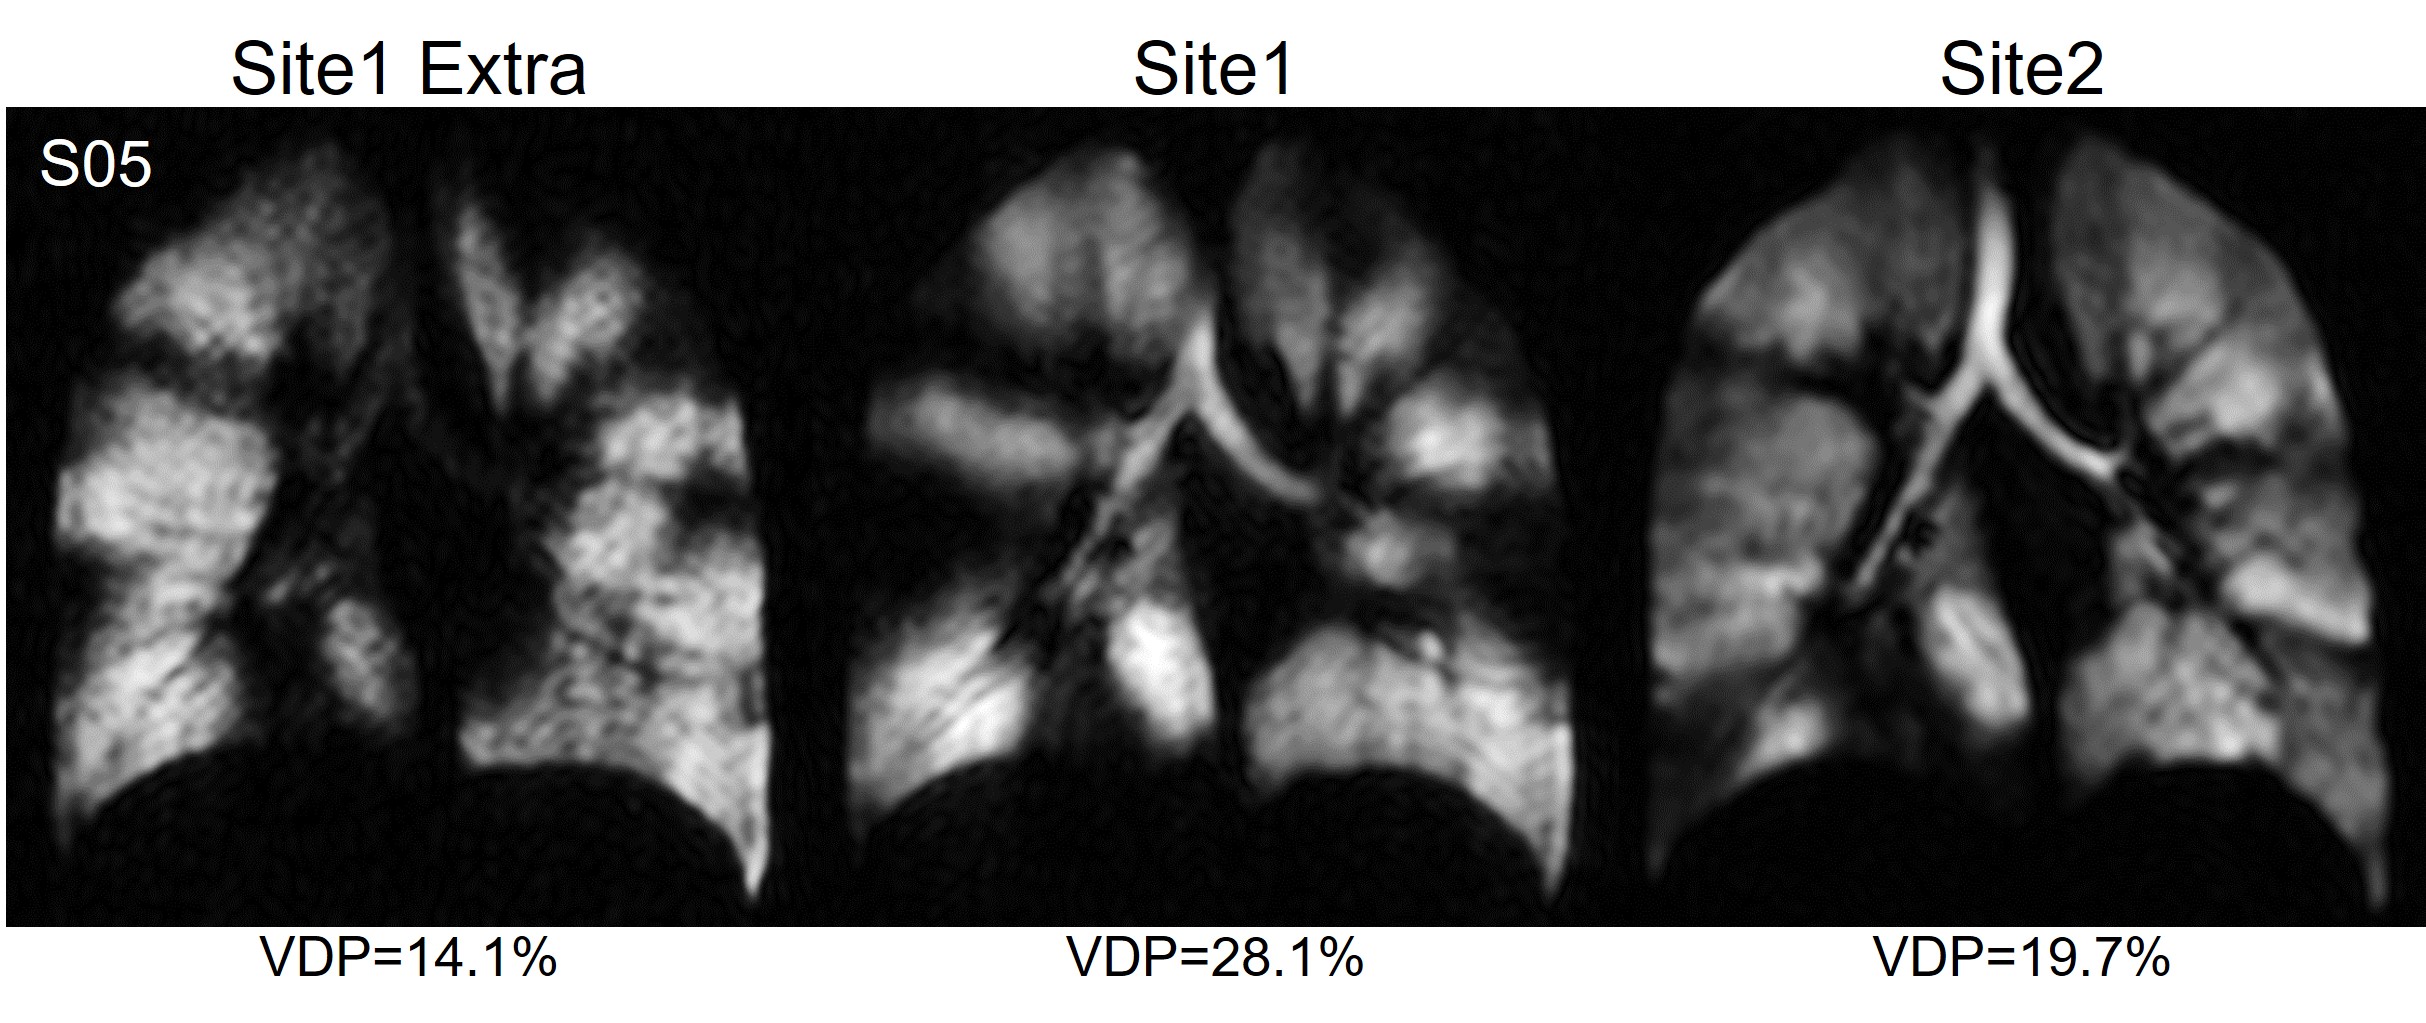
Figure 4. Three Repeated Ventilation XeMRI in CF Participant.
One cystic fibrosis (CF) participant fell outside the ±2% equivalence margin and Bland-Altman limits of agreement for VDP, but underwent an additional XeMRI ventilation scan at Site1. The differences in ventilation patterns and quantitative VDP suggest variability due to CF pathophysiology in this participant rather than imaging factors.