4672
Comparison of ventilation defects quantified by Technegas V-SPECT and hyperpolarized 129Xe MRI1Department of Medicine, Division of Respirology, McMaster University, Hamilton, ON, Canada, 2Imaging Research Centre, St. Joseph's Healthcare Hamilton, Hamilton, ON, Canada, 3Firestone Institute for Respiratory Health, St. Joseph's Healthcare Hamilton, Hamilton, ON, Canada, 4Department of Radiology, McMaster University, Hamilton, ON, Canada, 5Department of Nuclear Medicine, St. Joseph's Healthcare Hamilton, Hamilton, ON, Canada, 6Division of Thoracic Surgery, Department of Surgery, McMaster University, Hamilton, ON, Canada, 7Division of Thoracic Surgery, St. Joseph's Healthcare Hamilton, Hamilton, ON, Canada, 8Department of Electrical and Computer Engineering, McMaster University, Hamilton, ON, Canada
Synopsis
Keywords: Lung, Hyperpolarized MR (Gas)
Previous studies have demonstrated the comparability of ventilation assessed by SPECT and hyperpolarized gas MRI methods; however, these comparisons were qualitative and limited to visual scoring methods based on radiologist reporting. Thus, we quantified the relationship between ventilation-defect-percent (VDP) assessed from same-day Technegas ventilation-SPECT and hyperpolarized 129Xe MRI, in patients with early-stage lung cancer. We observed that ventilation defects quantified by Technegas V-SPECT and 129Xe MRI VDP were correlated and increased in patients with COPD. A bias towards higher Technegas V-SPECT VDP was detected and may be explained by differences in contrast agent properties, image acquisition conditions, and/or quantification pipelines.Introduction
Pulmonary ventilation imaging modalities have been developed to provide a regional evaluation of airflow obstruction at high-resolution and may aid in the clinical management of a variety of lung diseases. Nuclear medicine, magnetic resonance imaging (MRI), and computed tomography (CT) based methods have all demonstrated abnormal ventilation in patients with obstructive lung diseases, including chronic obstructive pulmonary disease (COPD) and asthma, but few are widely available or used in clinical practice.Ventilation (V) single photon emission computed tomography (SPECT) is a widely available and clinically approved method that is primarily used in conjunction with perfusion (Q) SPECT for the diagnosis of pulmonary embolism,1 but is rarely utilized to quantify ventilation for other clinical indications. Alternatively, inhaled hyperpolarized xenon-129 (129Xe) gas MRI has undergone extensive research and development for airway disease applications, but its availability is currently limited to specialized academic centres. Previous studies have demonstrated comparability of ventilation assessed by SPECT and hyperpolarized gas MRI methods,2–5 however these comparisons were qualitative and limited to visual scoring methods based on radiologist reporting.2,3 Thus, the objective of this study was to quantify the relationship between ventilation defect percent (VDP), assessed from same-day Technegas V-SPECT and hyperpolarized 129Xe MRI, in patients with early-stage lung cancer.
Methods
In a study approved by our research ethics board, patients scheduled to undergo lung cancer resection performed same-day Technegas V-SPECT-CT and hyperpolarized 129Xe MRI one-week prior to surgery.Ventilation SPECT using 99mTc Technegas: Technegas was prepared with a Technegas Generator (Cyclomedica, Sydney) and a 40 MBq dose was administered to the patient in a supine position via inhalation. Following inhalation, V-SPECT was performed supine during tidal-breathing using an Optima NM/CT 640 hybrid imaging system (GE Healthcare, Milwaukee) and the following parameters: LEHR collimator, energy window: 140keV±10%, zoom factor 1.0, 128x128 matrix, step and shoot, 25 seconds/image, 60 images/acquisition (30 images/camera head), 360º rotation, 6º steps, body contour. Reconstruction was performed using a Hermes workstation with the following settings: OSEM reconstruction (2 iterations, 10 subsets), 3D Gaussian filter with 1.20cm FWHM with corrections for attenuation, scatter, and collimator resolution recovery6.
Ventilation MRI using hyperpolarized 129Xe: Isotopically enriched 129Xe gas was polarized to 9-32% using a commercially available polarizer system (Polarean 9800 or 9820, Polarean, Durham). Following inhalation of a 1L dose (600mL of 129Xe + 400mL of N2) from functional residual capacity, 129Xe static-ventilation images were acquired using a Discovery MR750 3.0T system (GE Healthcare; Milwaukee), custom-built quadrature-asymmetric bird-cage coil, and a 3D fast gradient recalled echo sequence (10s data acquisition, TE=1.5ms, TR=5.1ms, initial flip angle=1.3○, variable flip angle, receive bandwidth=16kHz, FOV=40x40x24cm3; reconstructed matrix size=128x128x16; voxel size=3x3x15mm3)7.
Quantification of the ventilation defect percent (VDP): The VDP was quantified for Technegas V-SPECT and 129Xe MRI using previously described adaptive threshold and k-means pipelines, respectively8,9.
Statistics: Correlation and agreement between VDP quantified by Technegas V-SPECT and 129Xe MRI were determined by Spearman correlation and Bland-Altman analysis, respectively. Differences in VDP based on history of lung disease (no history, asthma, COPD) was determined using Kruskal Wallis with Tukey’s multiple comparisons test. Analyses were performed using GraphPad Prism V9.2.1 (GraphPad Inc., San Diego).
Results
Demographics and clinical characteristics for 41 participants (67±7 years old) that completed same day Technegas V-SPECT and 129Xe MRI are summarized in Table 1. 22 (54%) reported no history of lung disease, while 10 (24%) and 6 (15%) reported a history of COPD and asthma, respectively. Technegas V-SPECT and 129Xe MRI coronal slices for three representative participants are shown in Figure 1. Participant 33 had homogenous ventilation visualized by both modalities. Participants 16 and 59 had abnormal ventilation with spatially concordant ventilation defects observed by both modalities. Figure 2 summarizes the correlation and agreement of VDP measured by Technegas V-SPECT and 129Xe MRI. VDP measured by both modalities were correlated (r=0.65, p<0.0001). Bland-Altman analysis indicated a statistically significant bias for higher VDP measured by Technegas V-SPECT (23±14% vs 8±10%, p=0.0001). As shown in Figure 3, VDP measured by both modalities was significantly higher for patients with COPD than those with asthma and no history of lung disease.Discussion
In most participants, qualitative assessment showed spatial agreement between ventilation defects observed by Technegas V-SPECT and 129Xe MRI. The burden of ventilation defects quantified by Technegas V-SPECT and 129Xe MRI VDP was correlated, with the burden increasing in participants with COPD. Thus, both modalities exhibit sensitivity to airway obstruction. We did however detect a statistically significant bias towards higher Technegas V-SPECT VDP. This bias and lack of absolute agreement in VDP was not unexpected and may be explained by several factors. Notably, V-SPECT and MRI have fundamental differences in contrast agent properties (aerosolized particle vs. gas), inhalation technique (multi vs. single-breath), acquisition procedure (15 minute tidal-breathing vs. 10 second breath-hold), and resolution. In addition, different registration and segmentation pipelines were used to quantify VDP.Conclusion
The burden of ventilation defects quantified by Technegas V-SPECT and 129Xe MRI VDP was correlated and increased in patients with COPD. A bias towards higher Technegas V-SPECT VDP was detected and may be explained by differences in contrast agent properties and inhalation technique that affect lung deposition, image acquisition conditions, and/or quantification pipelines.Acknowledgements
This was an investigator initiated study funded by Cyclomedica Australia Pty Ltd. The funder had no role in the design of the study, the collection and analysis of data, or the preparation of the abstract.
We thank MRI technologists J. Lecomte, C. Awde, S. Weir, and S. Faseruk for performing the MRI and Nuclear Medicine technologists L. Speziale, M. Jamal for performing the SPECT/CT.
References
- Mirza, H. & Hashmi, M. F. Lung Ventilation Perfusion Scan (VQ Scan). StatPearls (2021).
- Altes, T. A. et al. Ventilation imaging of the lung: Comparison of hyperpolarized helium-3 MR imaging with Xe-133 scintigraphy. Acad Radiol 11, 729–734 (2004).
- Stavngaard, T. et al. Hyperpolarised 3He MRI and 81mKr SPECT in chronic obstructive pulmonary disease. Eur J Nucl Med Mol Imaging 32, 448–457 (2005).
- Kim, M., Doganay, O., Matin, T., Povey, T. & Gleeson, F. Comparison of the thoracic CT-based computational model with hyperpolarized Xenon-129 MRI and SPECT images to assess pulmonary ventilation in COPD patients. European Respiratory Journal 54, OA1931 (2019).
- Doganay, O. et al. Time-series hyperpolarized xenon-129 MRI of lobar lung ventilation of COPD in comparison to V/Q-SPECT/CT and CT. Eur Radiol 29, 4058 (2019).
- Venegas, C. et al. Ventilation and perfusion abnormalities following recovery from noncritical COVID-19. https://doi.org/10.1080/24745332.2022.2054047 (2022) doi:10.1080/24745332.2022.2054047.
- Svenningsen, S. et al. Reproducibility of Hyperpolarized 129Xe MRI Ventilation Defect Percent in Severe Asthma to Evaluate Clinical Trial Feasibility. Acad Radiol 28, 817–826 (2021).
- Farrow, C. E. et al. Peripheral ventilation heterogeneity determines the extent of bronchoconstriction in asthma. J Appl Physiol 123, 1188–1194 (2017).
- Kirby, M. et al. Hyperpolarized
3He Magnetic Resonance Functional Imaging Semiautomated Segmentation. Acad
Radiol 19, 141–152 (2012).
Figures
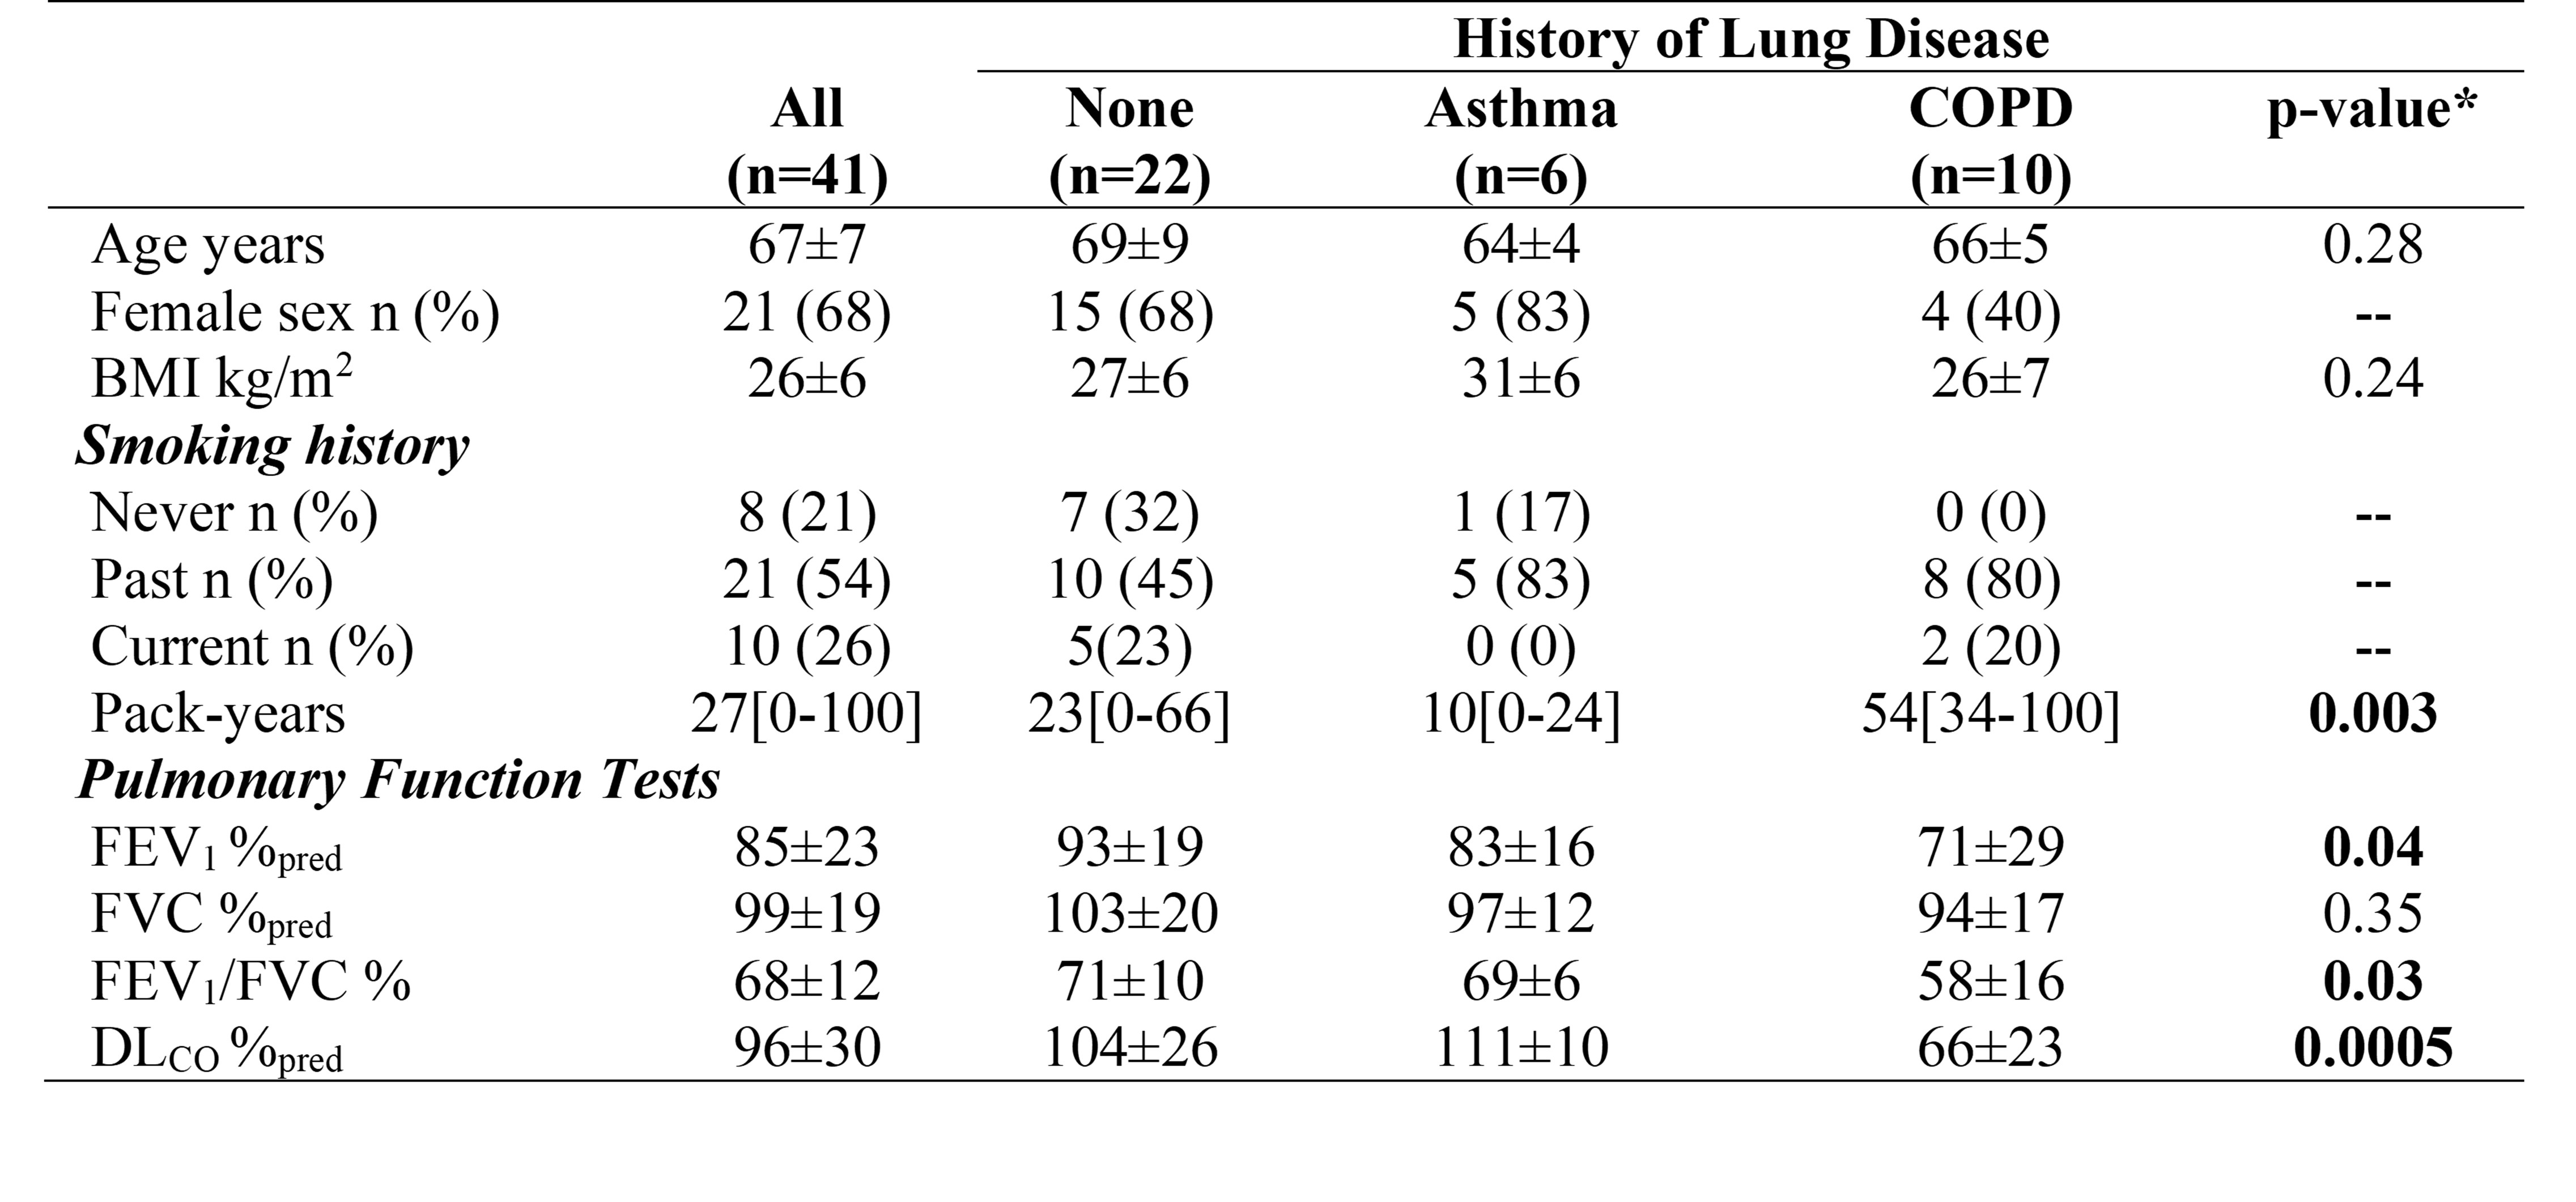
Table 1. Participant demographics and clinical characteristics
Mean ± standard deviation; median [minimum-maximum]; BMI=body mass index; COPD=chronic obstructive pulmonary disease; FEV1=forced expiratory volume in one second; FVC=forced vital capacity; DLCO=diffusion capacity for carbon monoxide; *Significance of difference between groups was determined using a one-way ANOVA with Tukey’s multiple comparisons test (parametric data) or Kruskal Wallis with Dunn's multiple comparisons test (non-parametric data).
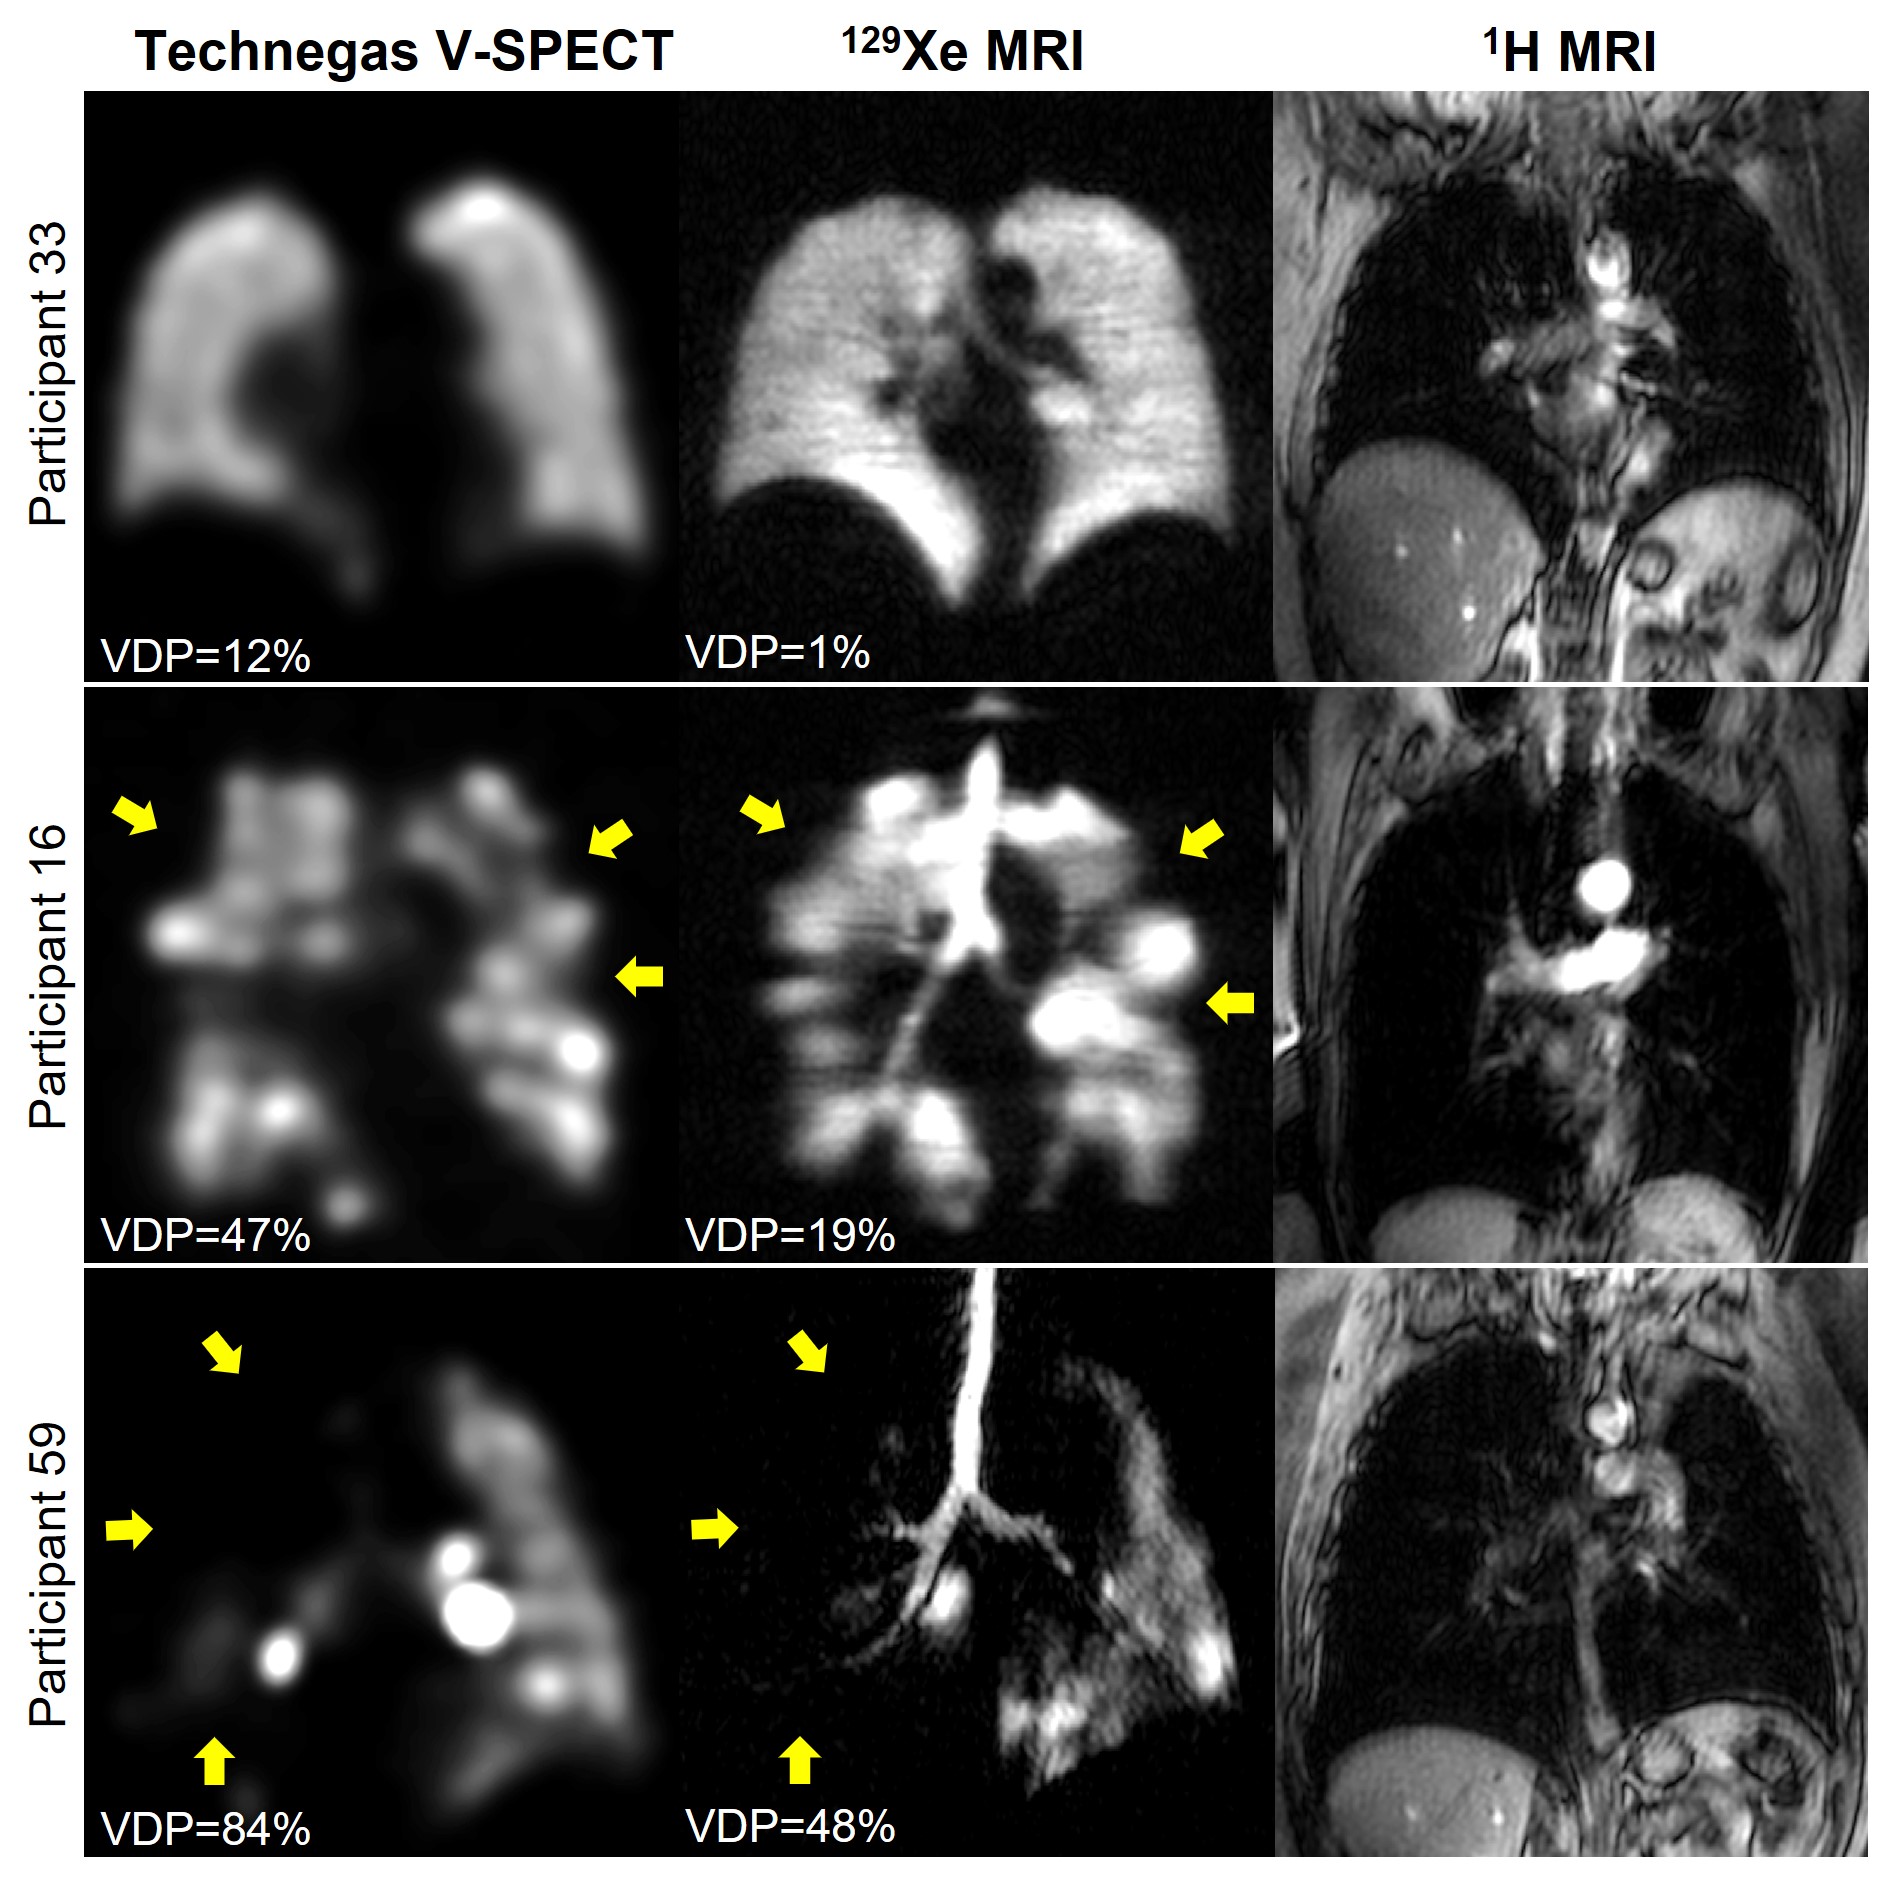
Figure 1. Comparison of pulmonary ventilation visualized by Technegas V-SPECT and hyperpolarized 129Xe MRI for three representative participants. Yellow arrows highlight spatially concordant ventilation defects.
Participant 33: 62 yo female with no history of lung disease and left upper lobe tumour.
Participant 16: 78 yo female with COPD and left upper lobe tumour.
Participant 59: 62 yo male with COPD and left upper lobe tumour.
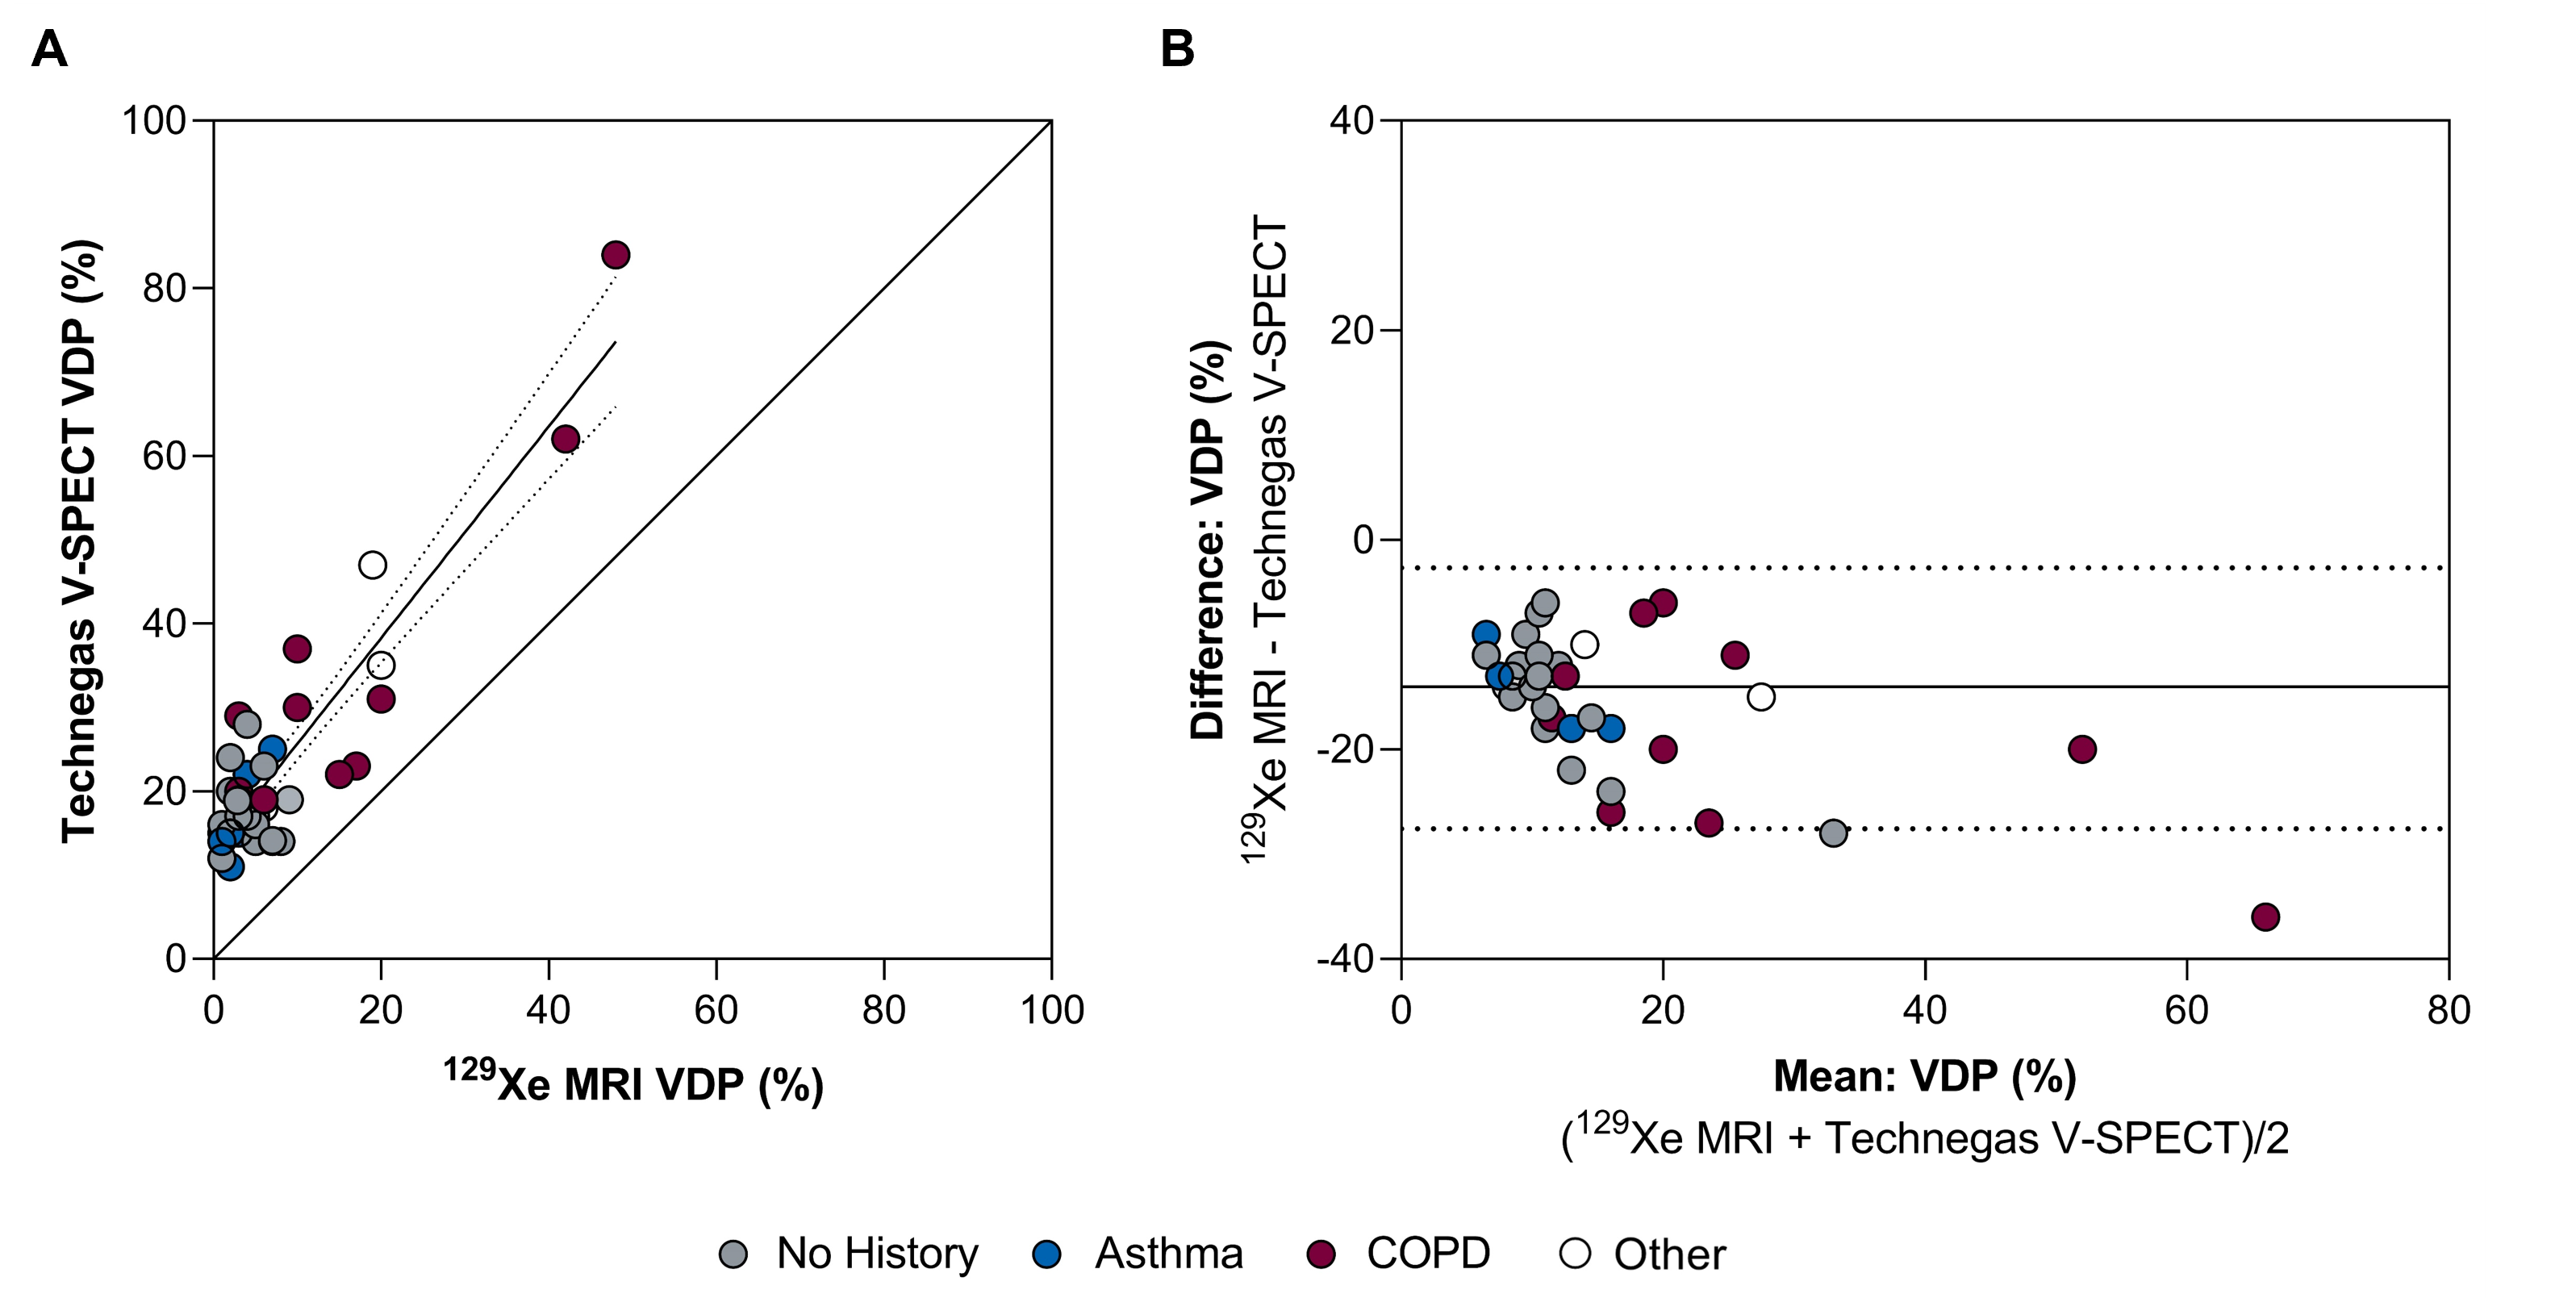
(A) Correlation between Technegas V-SPECT and 129Xe MRI VDP (r=0.65, r2=0.83, p=0.0001). Dotted lines represent 95% confidence intervals of linear regression line.
(B) Bland-Altman plot of the difference between Technegas V-SPECT and 129Xe MRI VDP. Solid line represents mean of the paired differences (bias=-15%), dotted lines represent the 95% limits of agreement (-28% to -3%).
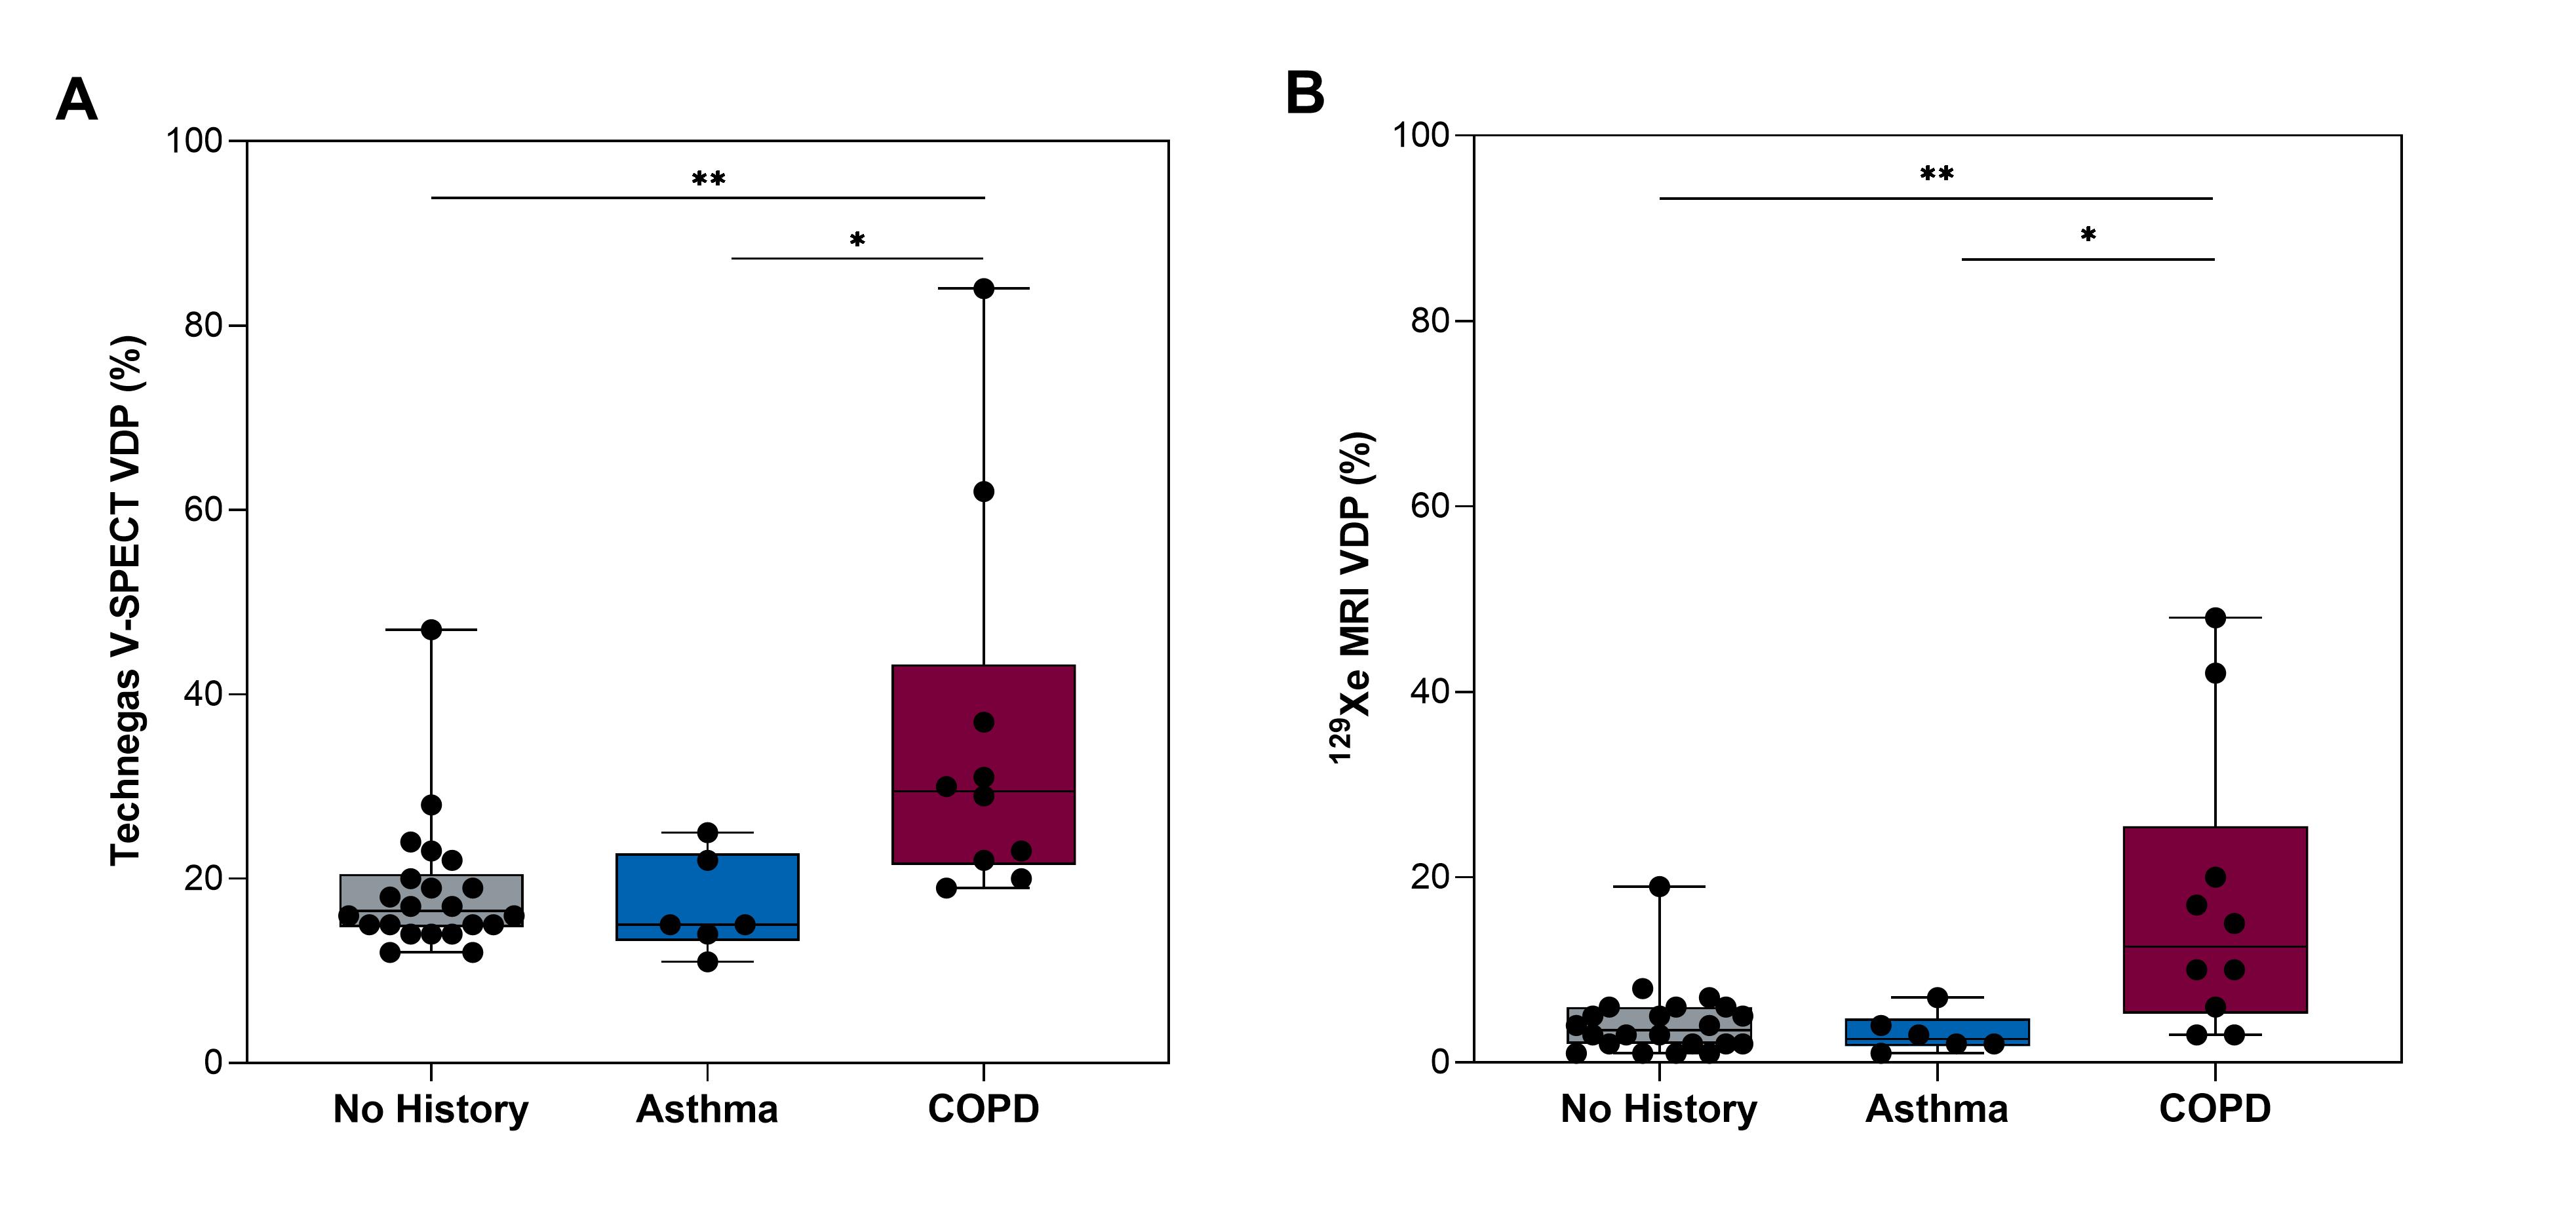
Figure 3. Ventilation defect percent (VDP) and history of respiratory disease.
(A) Technegas V-SPECT VDP and (B) 129Xe MRI VDP were greater in participants with COPD than asthma (SPECT 36±21% vs 19±8%, p=0.002; MRI 17±16% vs 3±2%, p=0.006) and those with no history of respiratory disease (SPECT 36±21% vs 17±5%, p=0.01; MRI 17±16% vs 4±4%, p=0.02). Box plots show min, first quartile, median, third quartile, and max VDP with individual values for all participants superimposed on the plot. Difference between groups determined using Kruskal Wallis with Dunn’s multiple comparisons test.