4669
Detection of Emphysema using Phase-Resolved functional Lung Imaging Parametric Response Mapping (PREFULPRM)1Institute of Diagnostic and Interventional Radiology, Medical School Hannover, Hannover, Germany, 2Biomedical Research in Endstage and Obstructive Lung Disease Hannover (BREATH), German Center for Lung Research (DZL), Hannover, Germany, 3Department of Diagnostic and Interventional Radiology, University Hospital of Heidelberg, Heidelberg, Germany, 4Translational Lung Research Center Heidelberg (TLRC), Member of the German Lung Research Center (DZL), Heidelberg, Germany, 5Clinic of Pneumology, Medical School Hannover, Hannover, Germany
Synopsis
Keywords: Lung, Data Processing
Ventilation measurements using signal differences between expiratory and inspiratory respiration states gained popularity as a biomarker for ventilation abnormalities. One method, which incorpartes such measurements is Phase-resolved functional lung imaging (PREFUL). A further classification of abnormalities such as emphysema and air-trapping beyond the current gas-exchange measurement is desirable. Therefore a MR adaption of CT’s parametric-response mapping (CTPRM) method is proposed as an additional post-processing method for PREFUL. The analysis of 34 patients with chronic obstructive pulmonary disease (COPD), shows that there is a high regional (Overlap normal 91%) and total lung concordance (r>0.86) for the proposed method PREFULPRM and CTPRM.
Introduction
Phase-resolved functional lung imaging (PREFUL) is a MRI method to extract ventilation and perfusion information from 2D image-timeseries acquired in free-breathing without any contrast-agent application1. The ventilation measurement relies on a two-compartment model – The signal (S) will directly depend on the proportion of lung tissue (P) and air in a volume (V): S~P/V, with the proton density P/V. Regional ventilation (RVent) is derived from a signal change:RVent(x) = (Sexp(x)-SInsp(x))/Sref(x),
with signal in end-expiration Sexp or end-inspiration SInsp and signal of the registrated reference volume Sref2. Being a gas-exchange measurement, a signal drop due to lung tissue change, may result in normal RVent if volume changes remain identical (Figure 1). Also, ventilation defects can not be further classified.
Considering that for CT, a threshold based method, parametric response mapping (PRM), is successfully used to distinguish between different lung ventilation abnormalities3, the aim of this study was to establish an analogous MRI method and compare to CTPRM.
Methods
Data of 34 subjects (20 female, median age 63 (42-76), GOLD status I (9), II (9), III (12), IV (4)) from the COSYCONET study was used for retrospective analysis4. The first part consisted of calculating PRMPREFUL for four coronal slices acquired with a spoiled gradient echo sequence during free breathing: Field-of-view 500x500 mm2, matrix 128x96, slice thickness 15 mm, echo time/repetition time 0.82 ms/3 ms, flip angle 5°, bandwidth 1500 Hz/px, imaging-time/slice ∼1 minute and a temporal resolution of 288 ms. Post-processing was as follows:1. PREFUL provided a RVent map with corresponding ventilation defect (VD) map and one respiration cycle, which includes registered averaged images during expiration and inspiration1.
2. The N4ITK algorithm was used to correct for field inhomogeneities5.
3. A region of interest (ROI) was automatically constructed in the liver using a lung boundary ROI, which was derived with a convolutional neuronal network6.
4. The images were normalized to have the same mean signal in the liver for all four slice positions and for both respiration states.
5. Average T2* values from literature were used to correct for signal decay inside the lung7.
6. Known Hounsfield Units (HU) in the liver (58 HU)8 and in the air (-1024 background) were used to scale MR-signals to pseudo HU.
7. Analogous to CT, values above -856 HU in inspiration and below -950 HU in expiration were defined as regions of airtrapping due to functional small airways disease (fSAD) and values below -856 HU in inspiration and below -950 HU in expiration were defined as emphysema. Otherwise lung voxel were considered normal.
8. Additionaly, a risk map for fSAD or emphysema was defined as 1 minus the cumulative normal distribution probability of the respective regional HU signal (expiration or inspiration) – with Mean = respective threshold defined in step 7 and σfSAd=80 HU/ σEmphysema =40 (empirically estimated from one image).
For PRMCT, images in full in- and expiration acquired on a 64-slice scanner were downsampled (factor 2) and registered to expiration. CT slices were matched and averaged to MRI and used for PRM3. Finally, PREFUL lung volumes were registered to CT.
For regional comparison, the dice and overlap coefficients regarding total normal, fSAD, and emphysema (three classes) were calculated. Additionaly, a two classes analysis (normal and VD = fSAD+emphysema) was performed with RVent VD maps. Test for significant differences were performed with a paired Wilcoxon signed rank test.
Global comparisons were performed accordingly, but using total lung percentages of the different classes.
Results
The visual agreement (Figure 2) of exemplary maps was confirmed by good regional correspondence (Overlap Normal: 91(83 - 99)%; fSAD 47(29 - 58)%; emphysema 17(3 - 29)%) as shown in Figure 3.Both PRM methods provided total percentages in a similar range, but with significantly different (P<0.001) median values: CT/PREFUL Normal: 73.50%/80.77%; fSAD: 24.11%/18.31%; Emphysema: 1.74%/0.23%. Similar results were obtained for the two-class comparison with VD (Figure 4).
The total lung values were highly correlated for both PRM methods (r>=0.86, Figure 4).
Discussion
Detection of fSAD and emphysema similar to CT using PREFUL MRI is presented. For total-lung-values high correlations were found for all three classes. The regional comparison revealed lower consensus. The low dice and overlap for emphysema can be explained by proportionally low amount of such regions.PRMPREFUL showed examples of abnormalities undetected by conventional regional ventilation approach and had a better correspondence to CT for two-classes and three-classes analysis. Nevertheless correlations and regional overlap for RVent VD were also high. A possible explanation is that RVent measures functional gas exchange, which is highly correlated to the functional state of the lung tissue. Therefore, changes in the later without alternation of the first are probably comparably rare. Furthermore, differences between MRI and CT can be caused by different respiration (free-breathing vs. breath-hold).
Improvements can be achieved in regard to acquisition (ultra-short TE), bias field correction and HU mapping, which can e.g. be replaced by deep-learning9.
Since MRI suffers from increased uncertainty of HU-thresholds, binary classifications might be supported by a risk-factor map (Figure 5).
Conclusion
A novel processing pipeline can classify three ventilation states (normal, fSAD, emphysema) with a high agreement to CT and may provide added value to functional lung MRI.Acknowledgements
This work was supported by the German Centre for Lung Research (DZL).References
1. Voskrebenzev A, Gutberlet M, Klimeš F, et al. Feasibility of quantitative regional ventilation and perfusion mapping with phase-resolved functional lung (PREFUL) MRI in healthy volunteers and COPD, CTEPH, and CF patients. Magn Reson Med. 2018;79(4):2306-2314. doi:10.1002/mrm.26893
2. Klimeš F, Voskrebenzev A, Gutberlet M, et al. Free-breathing quantification of regional ventilation derived by phase-resolved functional lung (PREFUL) MRI. NMR Biomed. 2019;32(6):e4088. doi:10.1002/nbm.4088
3. Galbán CJ, Han MK, Boes JL, et al. Computed tomography-based biomarker provides unique signature for diagnosis of COPD phenotypes and disease progression. Nat Med. 2012;18(11):1711-1715. doi:10.1038/nm.2971
4. Kahnert K, Föhrenbach M, Lucke T, et al. The impact of COPD on polyneuropathy: results from the German COPD cohort COSYCONET. Respir Res. 2020;21(1):28. doi:10.1186/s12931-020-1293-6
5. Tustison NJ, Avants BB, Cook PA, et al. N4ITK: improved N3 bias correction. IEEE Trans Med Imaging. 2010;29(6):1310-1320. doi:10.1109/TMI.2010.2046908
6. Ronneberger O, Fischer P, Brox T. U-Net: Convolutional Networks for Biomedical Image Segmentation. In: Navab N, Hornegger J, Wells WM, Frangi AF, eds. Medical Image Computing and Computer-Assisted Intervention – MICCAI 2015. Lecture Notes in Computer Science. Springer International Publishing; 2015:234-241. doi:10.1007/978-3-319-24574-4_28
7. Yu J, Xue Y, Song HK. Comparison of Lung T2* During Free-Breathing at 1.5T and 3.0T with Ultrashort Echo Time (UTE) Imaging. Magn Reson Med Off J Soc Magn Reson Med Soc Magn Reson Med. 2011;66(1):248-254. doi:10.1002/mrm.22829
8. Tisch C, Brencicova E, Schwendener N, Lombardo P, Jackowski C, Zech WD. Hounsfield unit values of liver pathologies in unenhanced post-mortem computed tomography. Int J Legal Med. 2019;133(6):1861-1867. doi:10.1007/s00414-019-02016-1
9. Nie D, Cao X, Gao Y, Wang L, Shen D. Estimating CT Image from MRI Data Using 3D Fully Convolutional Networks. Deep Learn Data Labeling Med Appl First Int Workshop LABELS 2016 Second Int Workshop DLMIA 2016 Held Conjunction MICCAI 2016 Athens Greece Oct 21 2016 Proc. 2016;2016:170-178. doi:10.1007/978-3-319-46976-8_18
Figures
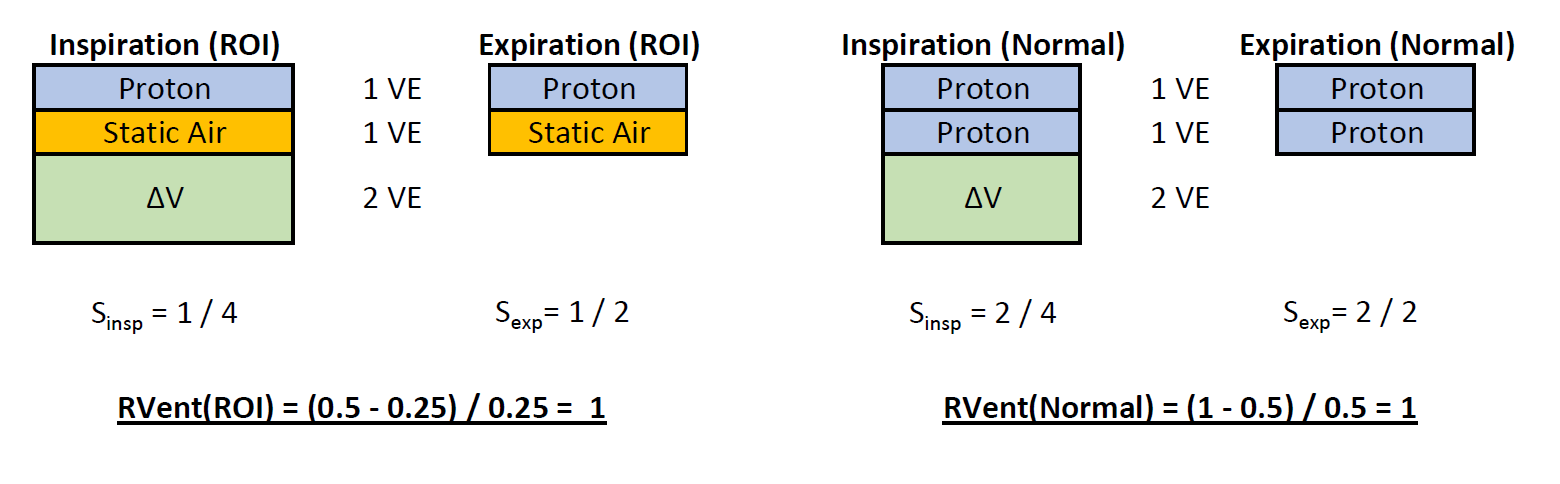
Figure 1: Ilustration of the fact that regional ventilation (RVent) only measures gas exchange: a region of interest (ROI) with reduced lung tissue (one proton unit) and static air, results in the same result in comparison to a normal region (two proton units). With no loss of generality, the inspiration signal was used as the reference signal. VE – Volume Element; ΔV – Ventilated Volume, Signal in end-expiration Sexp or end-inspiration SInsp.
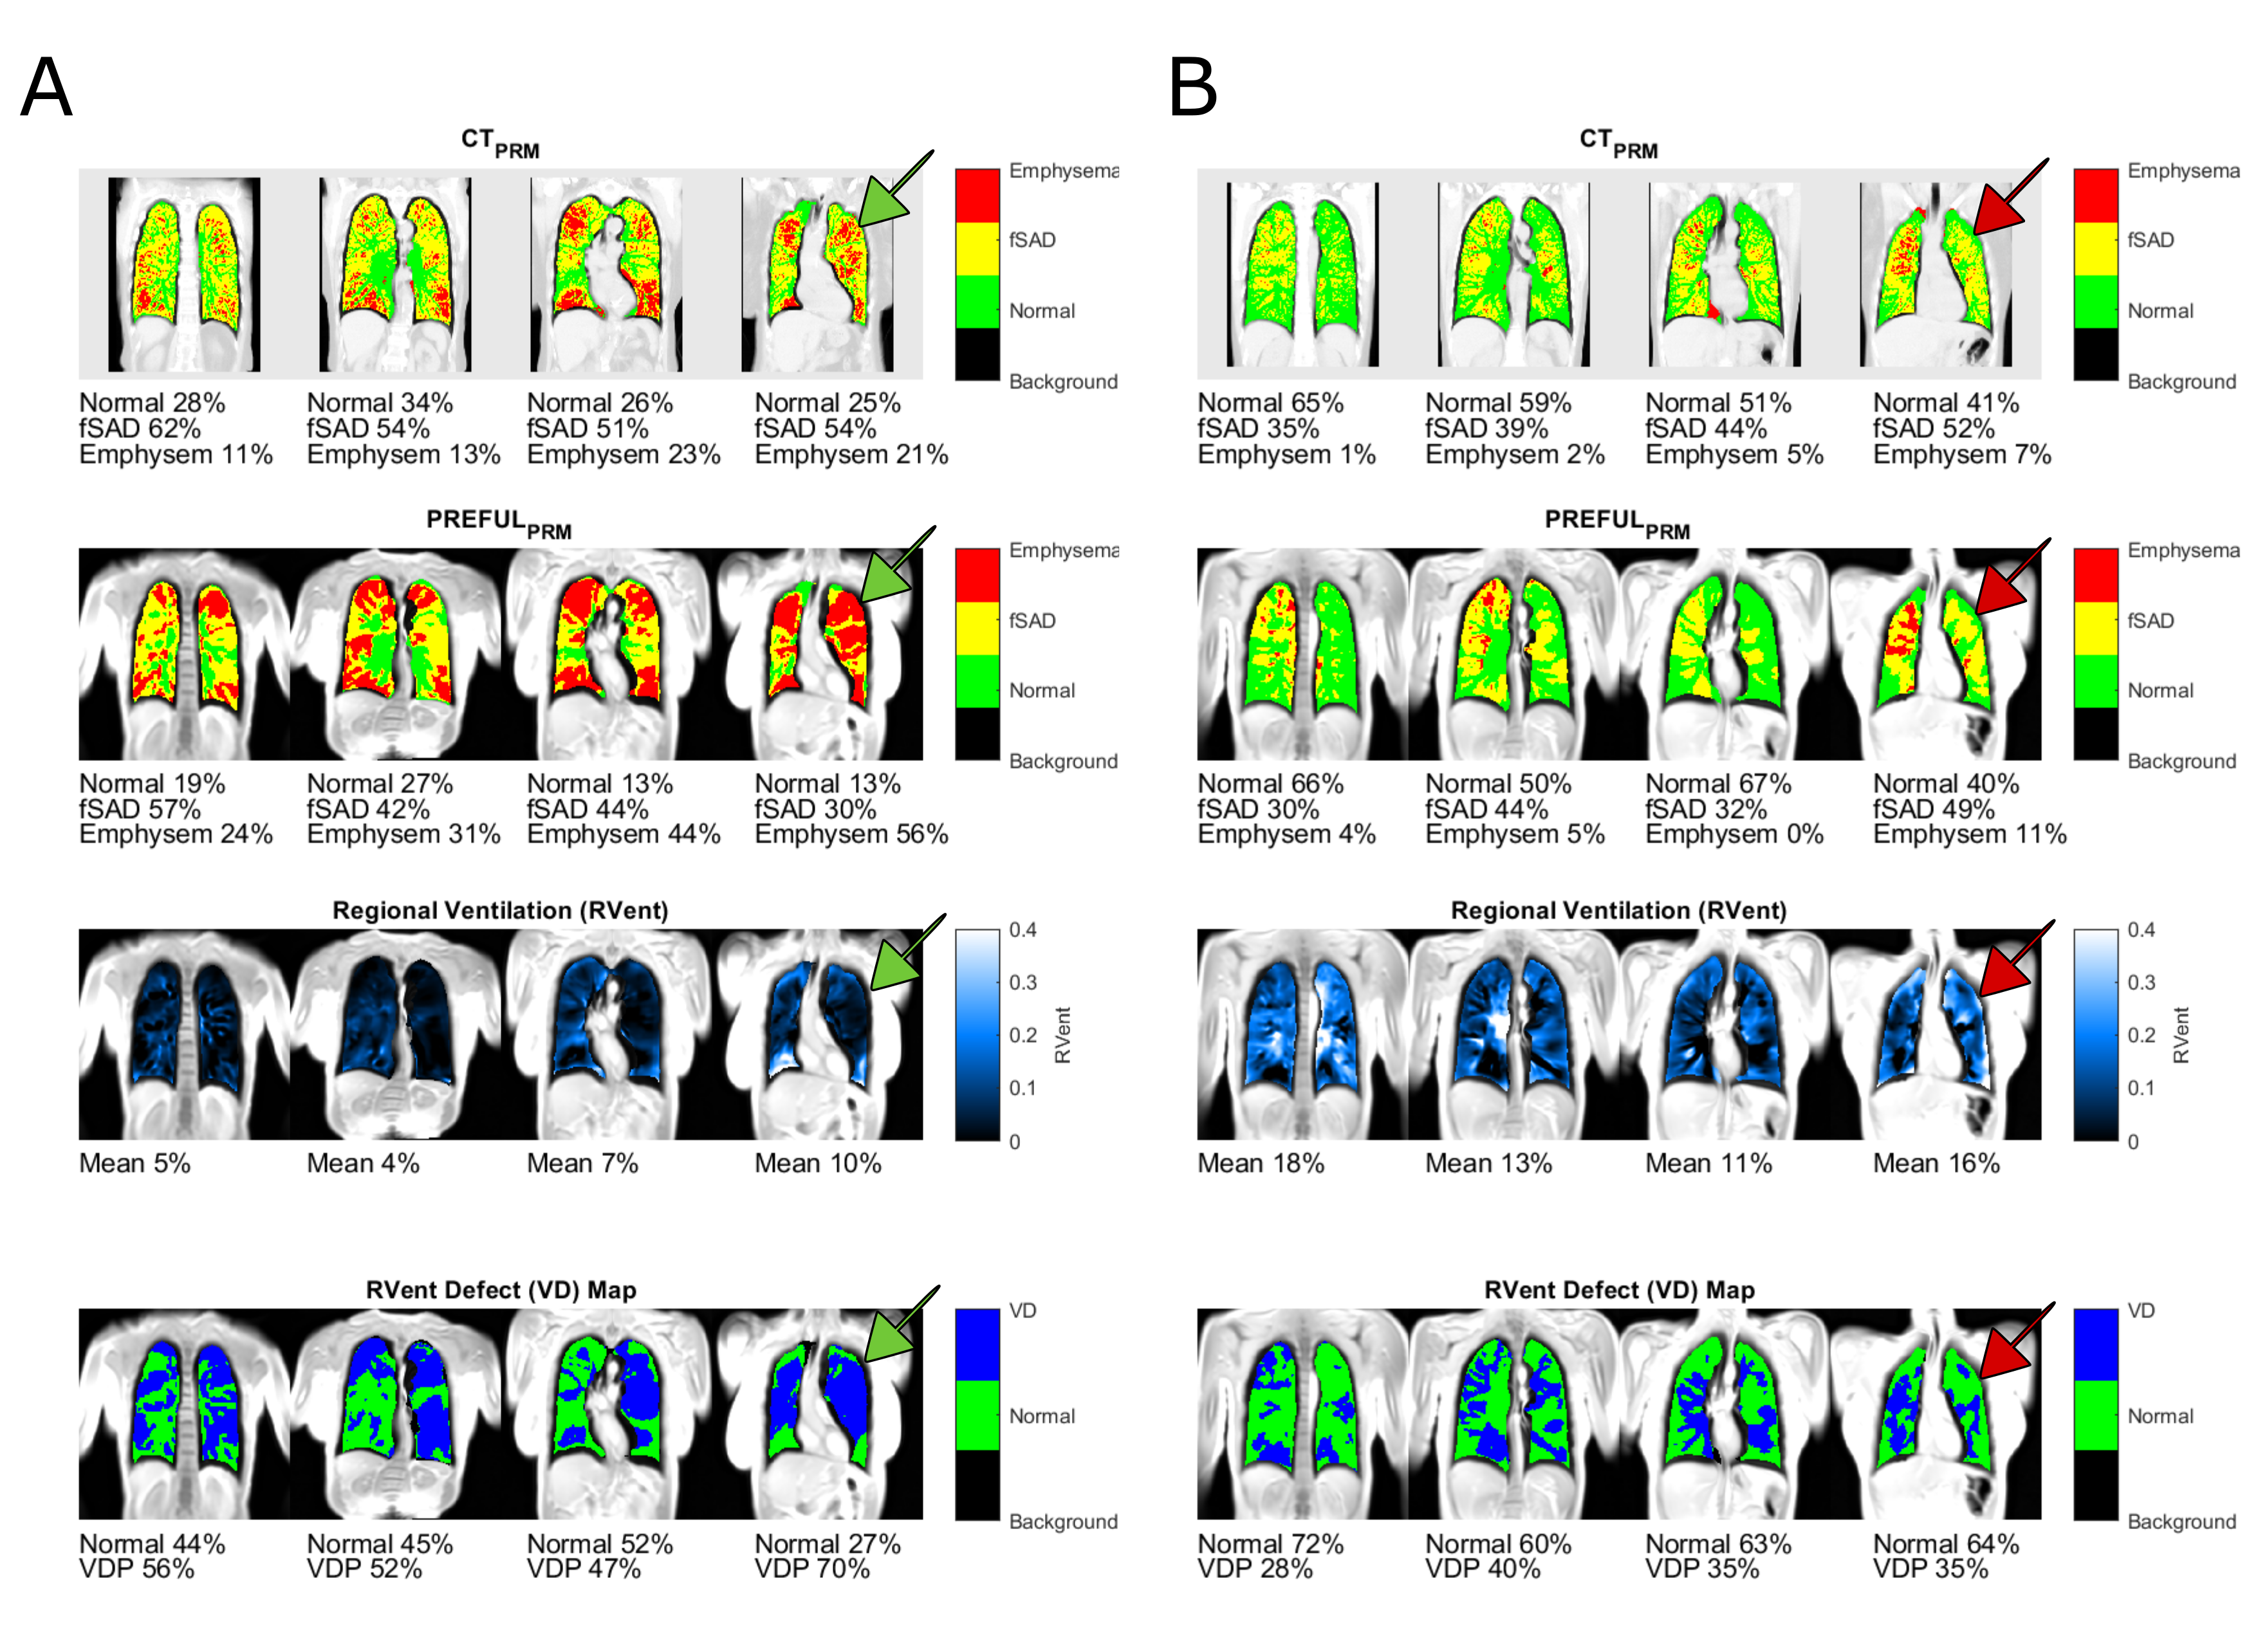
Figure 2: Examplary results for two cases (A, female 70, Gold IV; B, female 42, Gold III) showing the CTPRM (1st row), PREFULPRM (2nd row), RVent (3rd row) and RVent Defect (VD) map (4th row). Please note the regional correspondence of fSAD and Emphysema classification between CT and PREFUL. Also note, that many regions of RVent / VD correspond (green arrows), but some completely differ to PRM measures (red arrows).
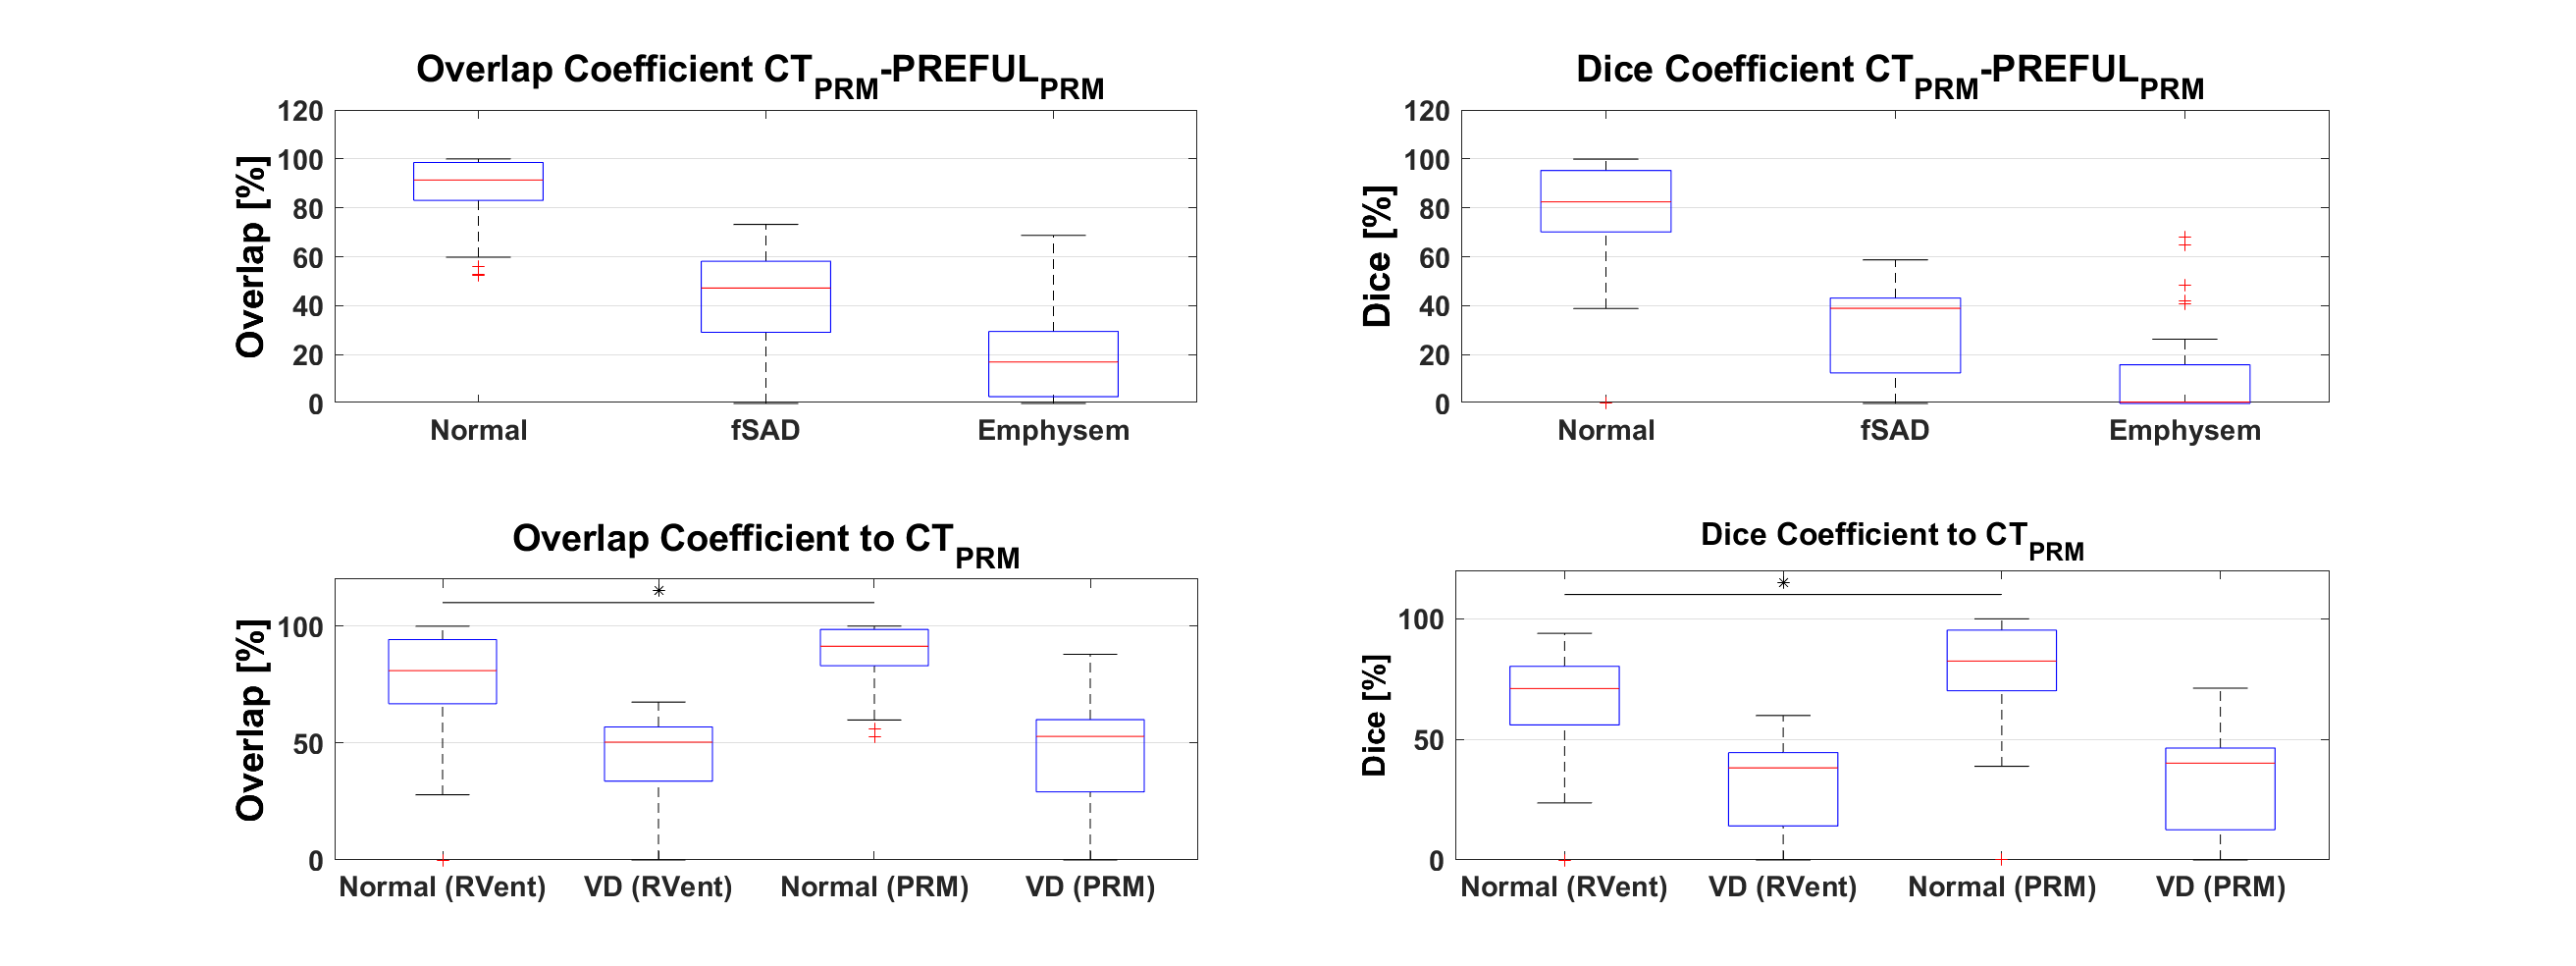
Figure 3: Upper row shows the comparison on regional level for PRM methods using three classes (normal, fSAD and emphysema). Lower row shows the analogous comparison for two classes (normal, ventilation defect). In all cases the methods are compared against CTPRM as the gold standard. Left column shows overlap and right column the dice coefficient. Both, overlap and dice of normal regions are significantly higher for PREFULPRM in comparison to conventional RVent VD map (P<0.0001).
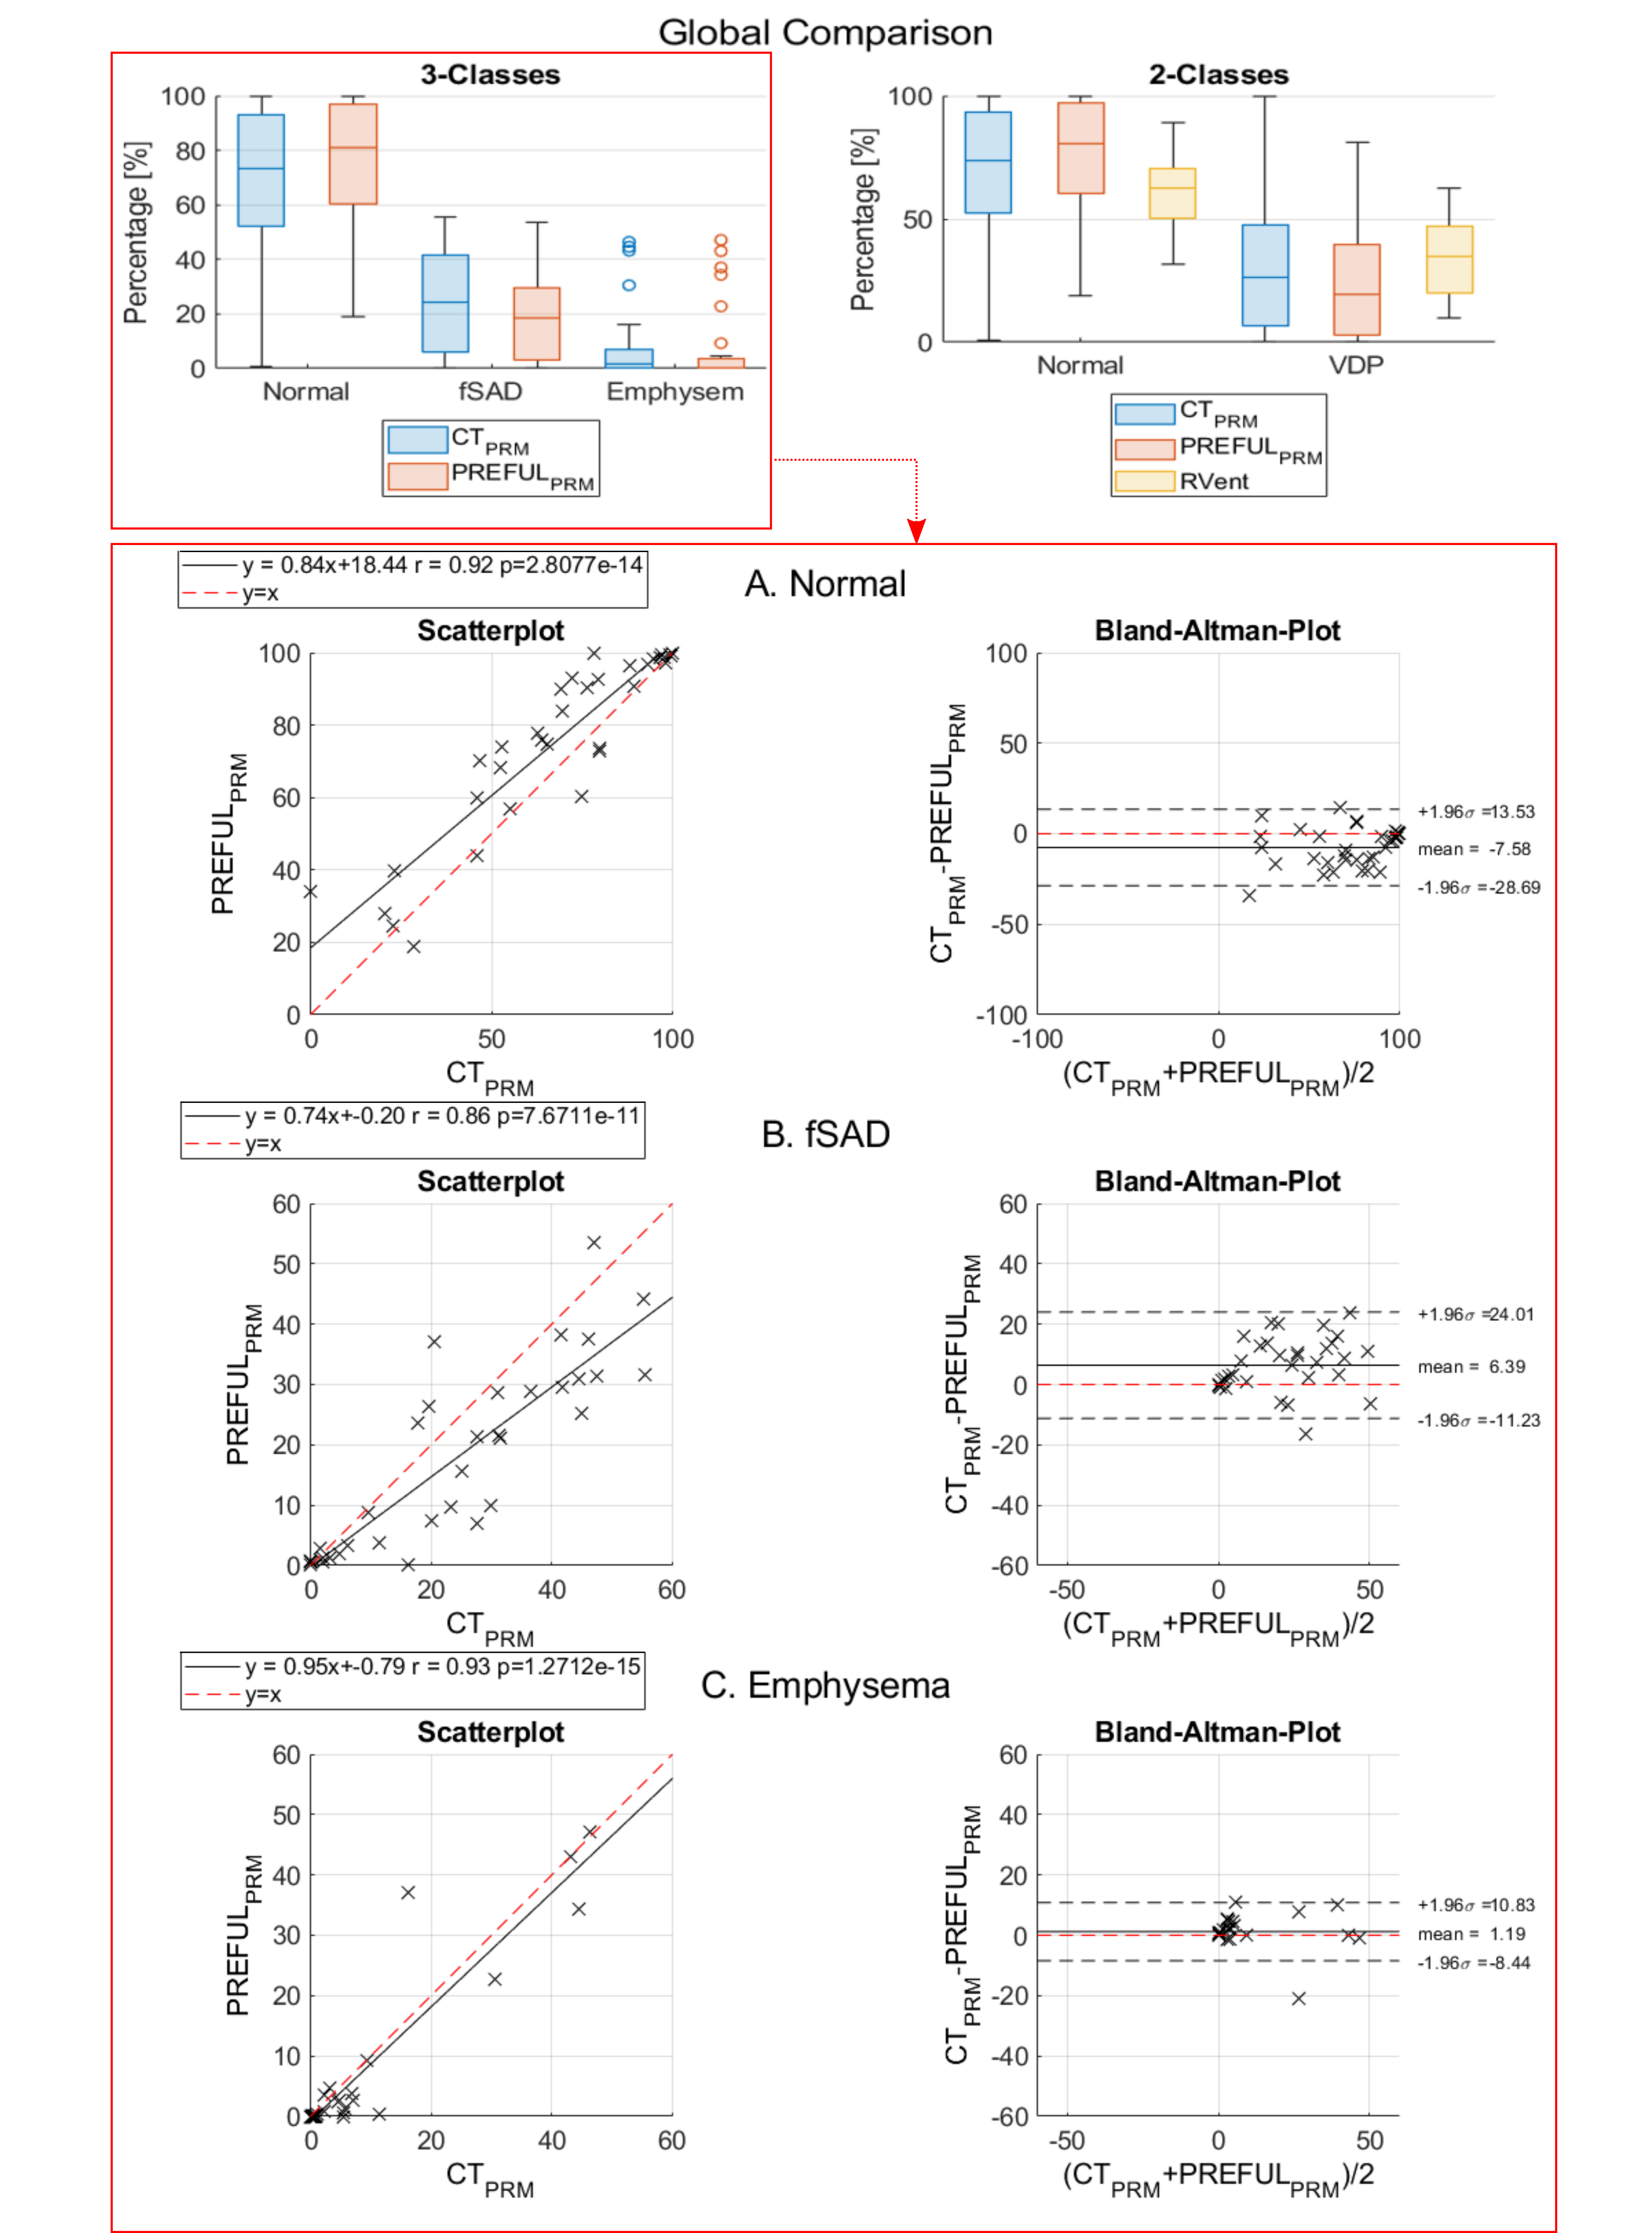
Figure 4: Upper row shows the global comparison (number of voxels of a certain class in relation to total lung voxels) for 3-classes (left) and 2-classes (right). Additional Scatter and Bland-Altman plots for 3-classes show only minor bias and deviation between CTPRM and PREFULPRM. For all classes the pearson correlations are high (r>=0.86) and significant. For two classes (not shown): The correlation for RVent VD / PREFULPRM was r=0.78 / 0.92 (normal) and 0.76 / 0.92 (VD).
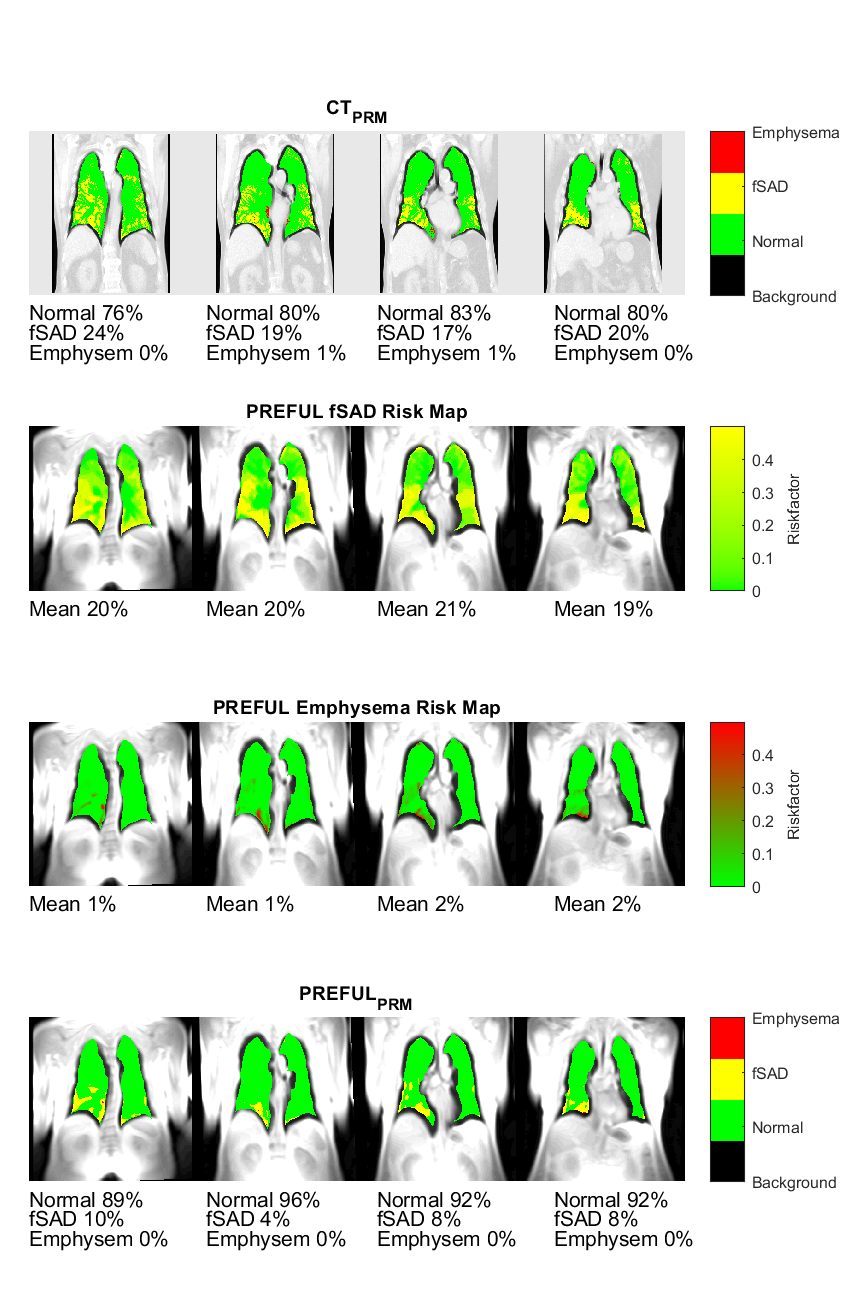
Figure 5: In addition to binary classifications, the 2nd and 3rd row show risk-maps indicating probabilities for fSAD and emphysema of a male (age 74, Gold II) patient. The maps were generated based on the assumption, that a probability of ~100% is reached below the threshold - 3σ, with σ empirically set. Please note that the risk-maps show increased probabilities in consensus with PRMCT, which are partially missed by the binary PRMPREFUL.