4668
129Xe gas transfer lung MRI before and after bronchodilator inhalation in patients with asthma and/or COPD1University of Sheffield, Sheffield, United Kingdom, 2Priory Medical Group, York, United Kingdom, 3AstraZeneca, Gothenburg, Sweden, 4AstraZeneca, Cambridge, United Kingdom
Synopsis
Keywords: Lung, Hyperpolarized MR (Gas)
Lung ventilation increases after bronchodilator inhalation in patients with asthma or COPD but there is little MRI data on how bronchodilator inhalation affects gas transfer. 117 patients with asthma and/or COPD were scanned with 129Xe gas transfer MRI before and after bronchodilator inhalation. There were no significant changes in red blood cell (RBC) / membrane (M), RBC/gas or M/gas in response to bronchodilator when all patients were considered, but RBC/gas and M/gas increased post-bronchodilator in a sub-group of patients with asthma+COPD. The amplitude of RBC oscillations increased post-bronchodilator in patients with asthma or COPD, and when all patients were considered.Introduction
Bronchodilators are the mainstay of treatment for patients with asthma and/or COPD. Lung ventilation, measured by hyperpolarized gas MRI, has been shown to increase after bronchodilator (BD) inhalation in patients with asthma1,2 and patients with COPD3. Previous studies have used ventilation MRI alongside dynamic contrast enhanced perfusion MRI to investigate the effect of bronchodilator on ventilation and perfusion4,5. 129Xe MRI can directly measure the signal from 129Xe dissolved in the alveolar membrane and red blood cells, providing metrics of gas transfer6. Whilst preliminary data on the effect of combination bronchodilators in a small cohort of patients with COPD has been reported6, the effect of bronchodilator inhalation on such metrics in patients with asthma, or asthma+COPD has not yet been reported.The aim of this work was to assess patients with a broad range of asthma and/or COPD with 129Xe gas transfer MRI before and after bronchodilator inhalation.
Methods
117 patients (aged 29 – 83) with asthma and/or COPD taking part in the NOVELTY study7 (NCT02760329) were recruited from 2 primary care centres in the UK. Patients withheld bronchodilator medications for 24 hours prior to assessment.Patients were scanned using a 1.5T whole body MRI system (GE HDx) and 129Xe transmit-receive vest coil (CMRS) at breath-hold after inhaling hyperpolarised 129Xe (1L or less according to height) from functional residual capacity. 3D dissolved-phase 129Xe spectroscopic images8 were acquired before and > 20 minutes after inhalation of 400 µg of salbutamol.
Images of 129Xe in the airspaces (gas), 129Xe dissolved in red blood cells (RBC), and 129Xe dissolved in the membrane (M) were used to calculate whole-lung ratios (gas transfer metrics) of RBC/M, RBC/gas and M/gas8. The amplitude of RBC oscillations (ARBCO; a metric of cardio-pulmonary blood flow) was also calculated where sufficient RBC signal was available.
Paired t-tests or Wilcoxon signed rank tests evaluated statistical difference between data acquired before and after bronchodilator for all patients and for patients grouped according to physician-assigned diagnosis of asthma, asthma+COPD or COPD.
Results
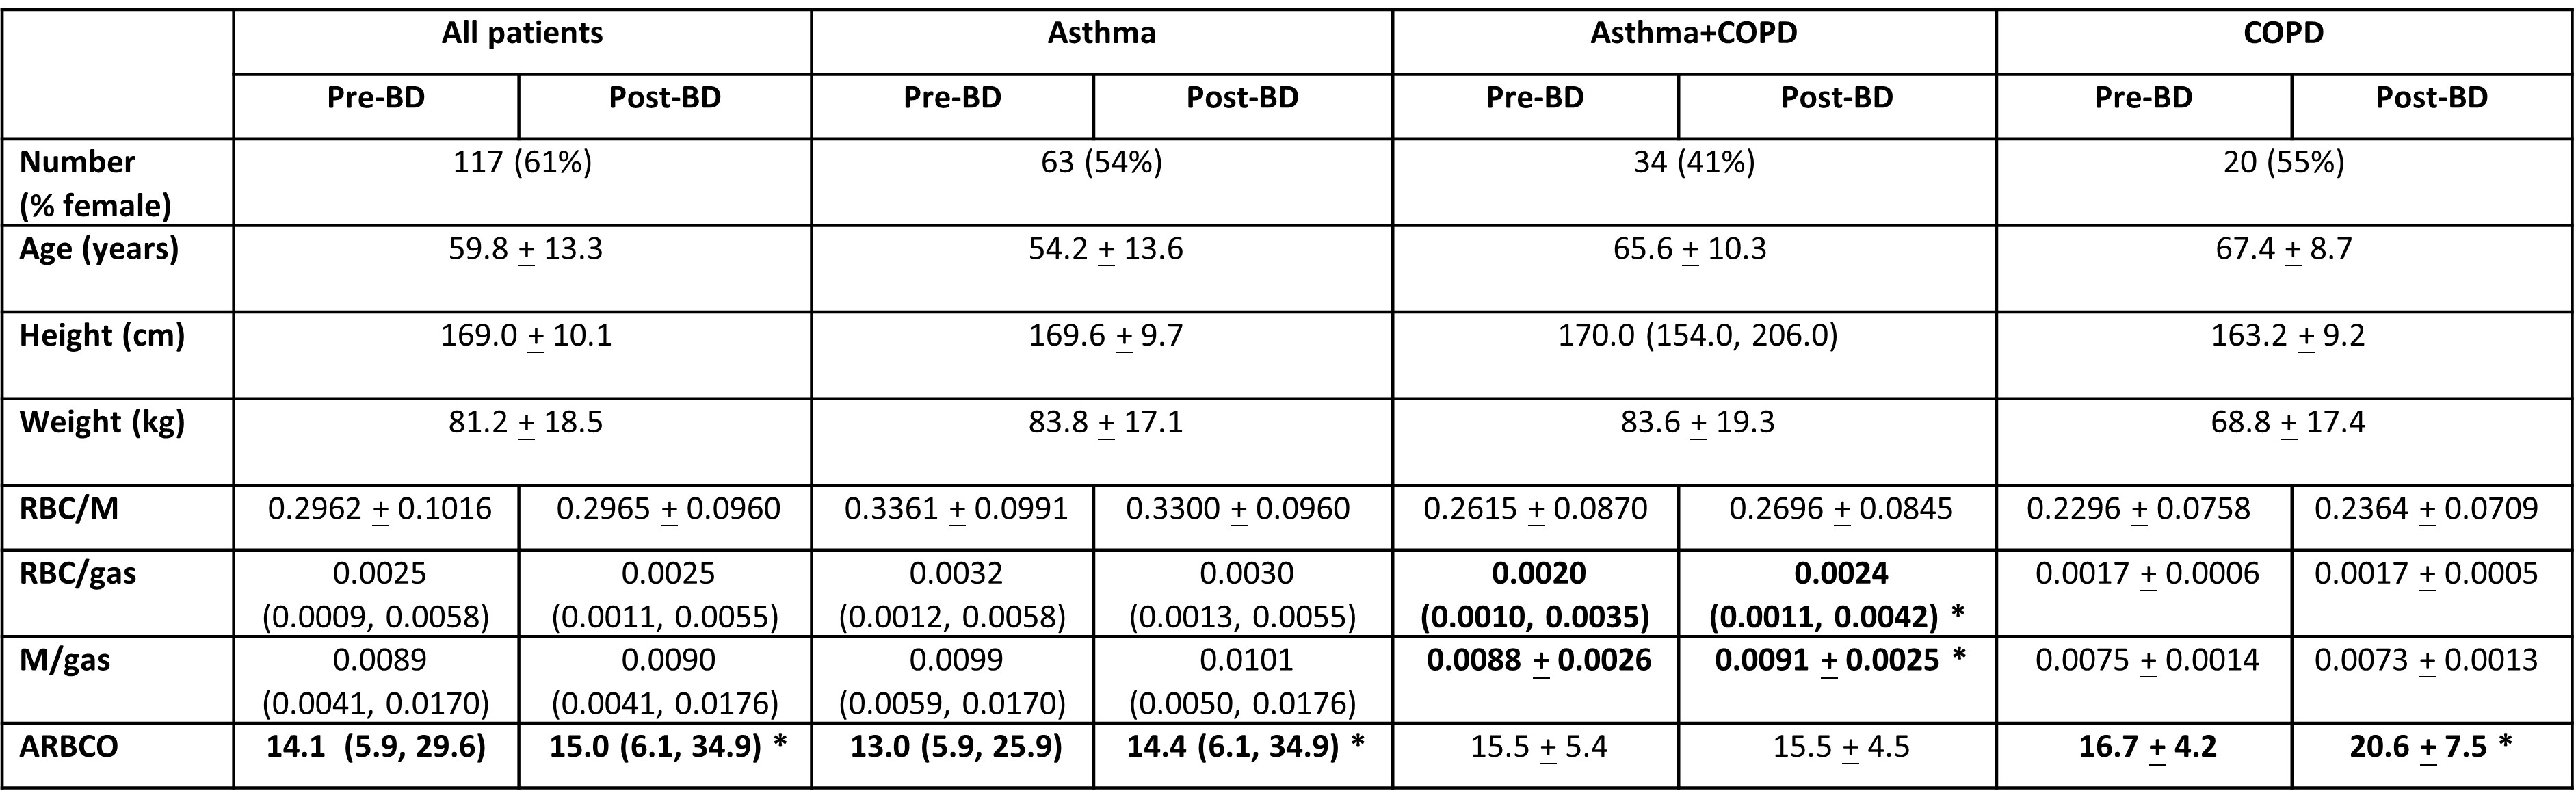
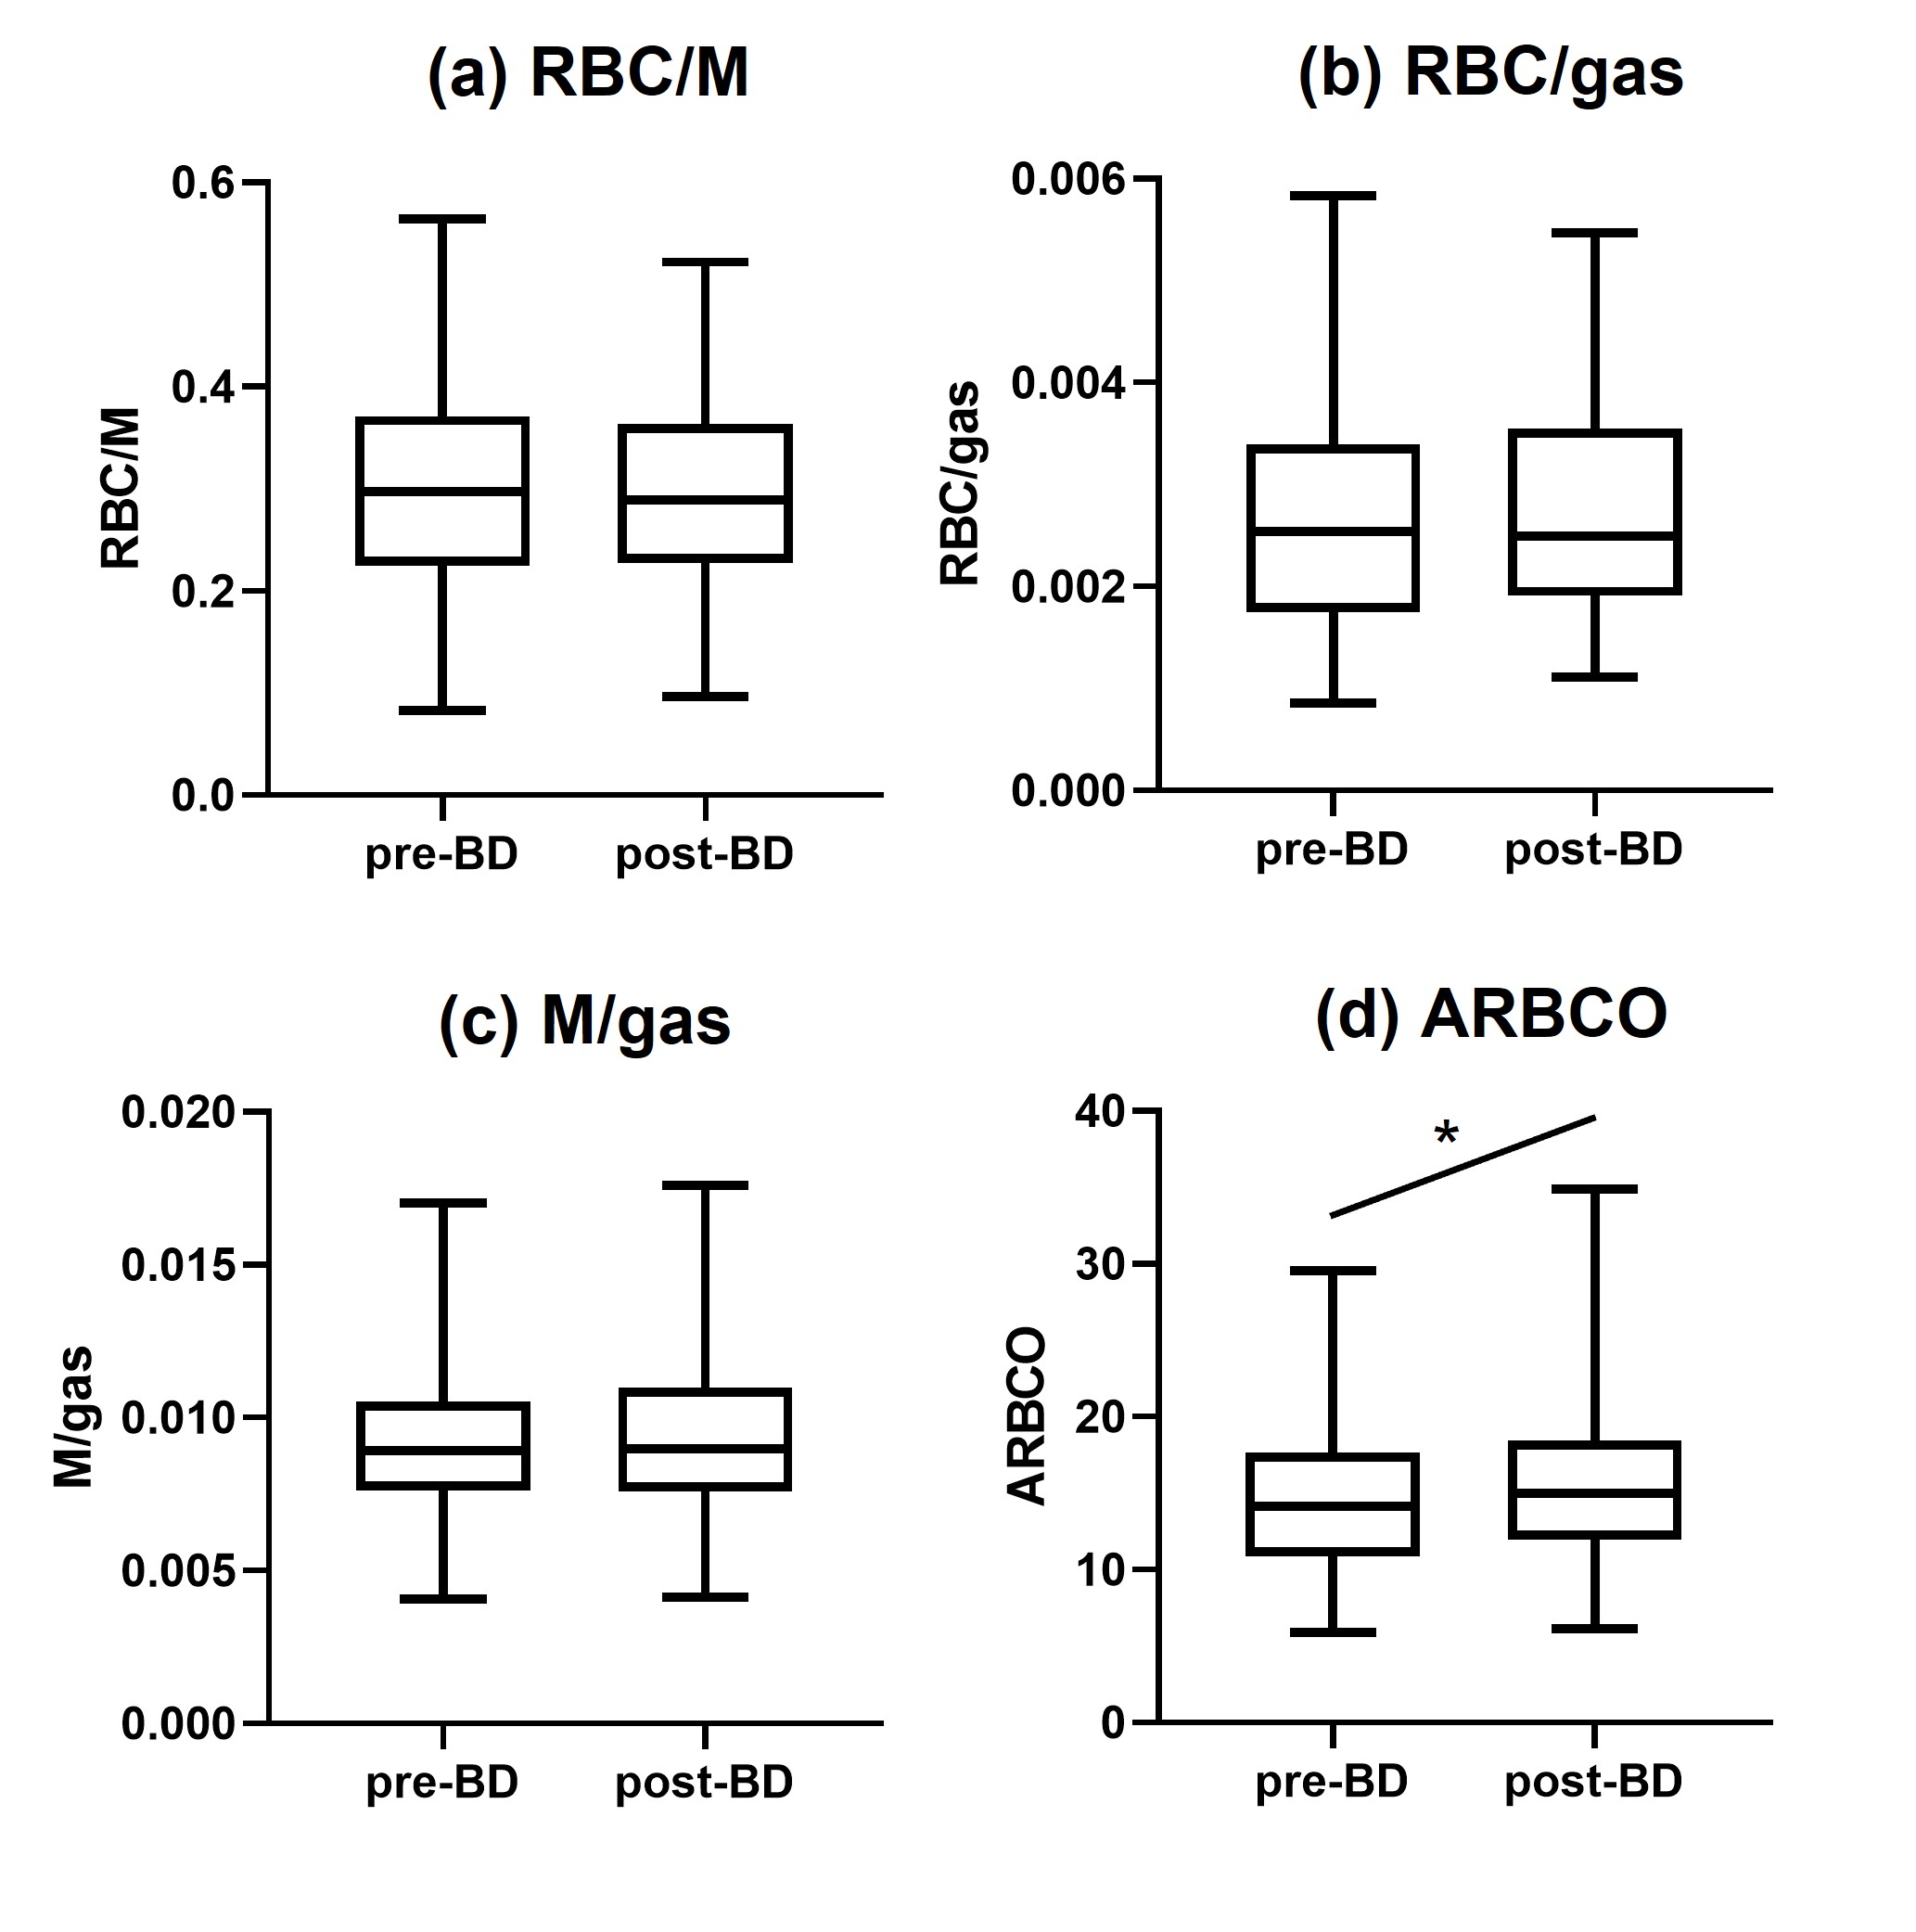
Table 1 shows patient demographics and gas transfer metrics. 63 patients with asthma, 34 patients with asthma+COPD and 20 patients with COPD were scanned. ARBCO was calculated for 89 patients (52 with asthma, 25 with asthma+COPD and 12 with COPD).There was an increase in ARBCO post-bronchodilator (from 14.1 to 15.0, p=0.0019), but no significant changes in RBC/M, RBC/gas or M/gas in response to bronchodilator when all patients were considered (figure 1).
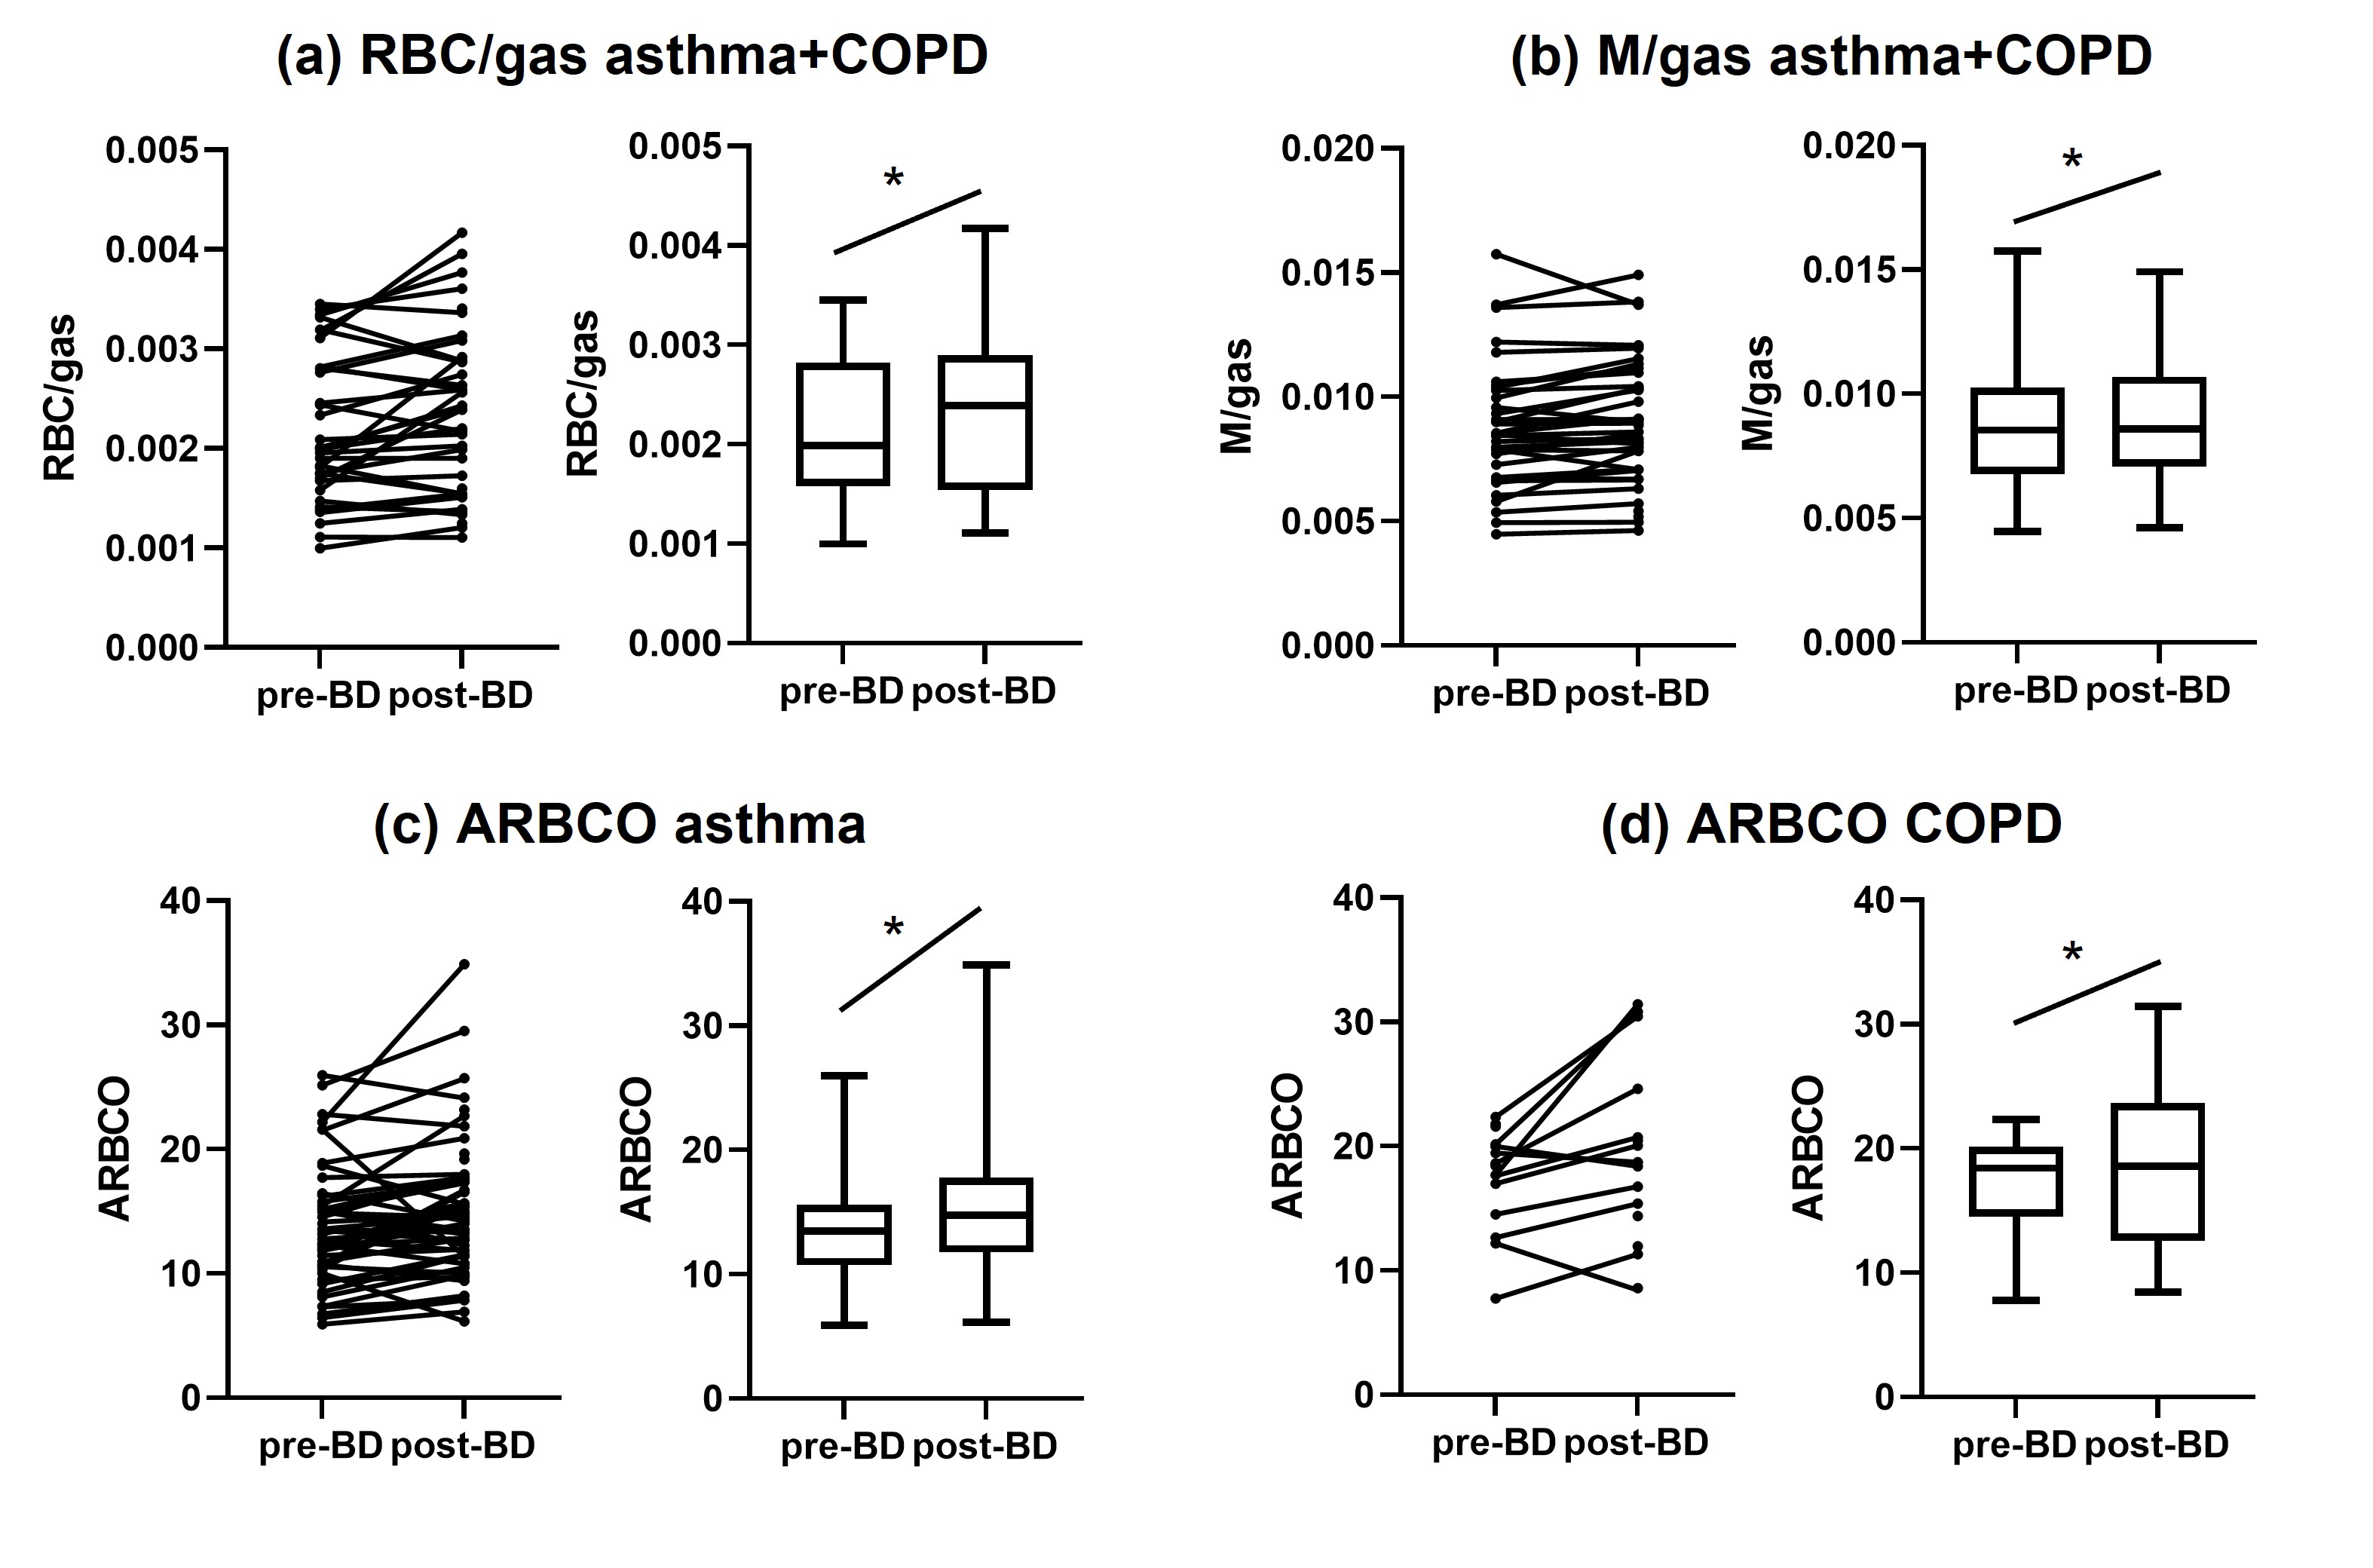
When patients were divided into diagnosis groups, RBC/gas (pre-BD=0.0020, post-BD=0.0024, p=0.0169) and M/gas (pre-BD=0.0088, post-BD=0.0091, p=0.0120) increased post-bronchodilator in patients with asthma+COPD (figure 2). ARBCO increased post-bronchodilator in patients with asthma (from 13.0 to 14.4, p=0.0019) and patients with COPD (from 16.7 to 20.6, p=0.0208). There were no other significant changes in metrics grouped according to diagnosis.
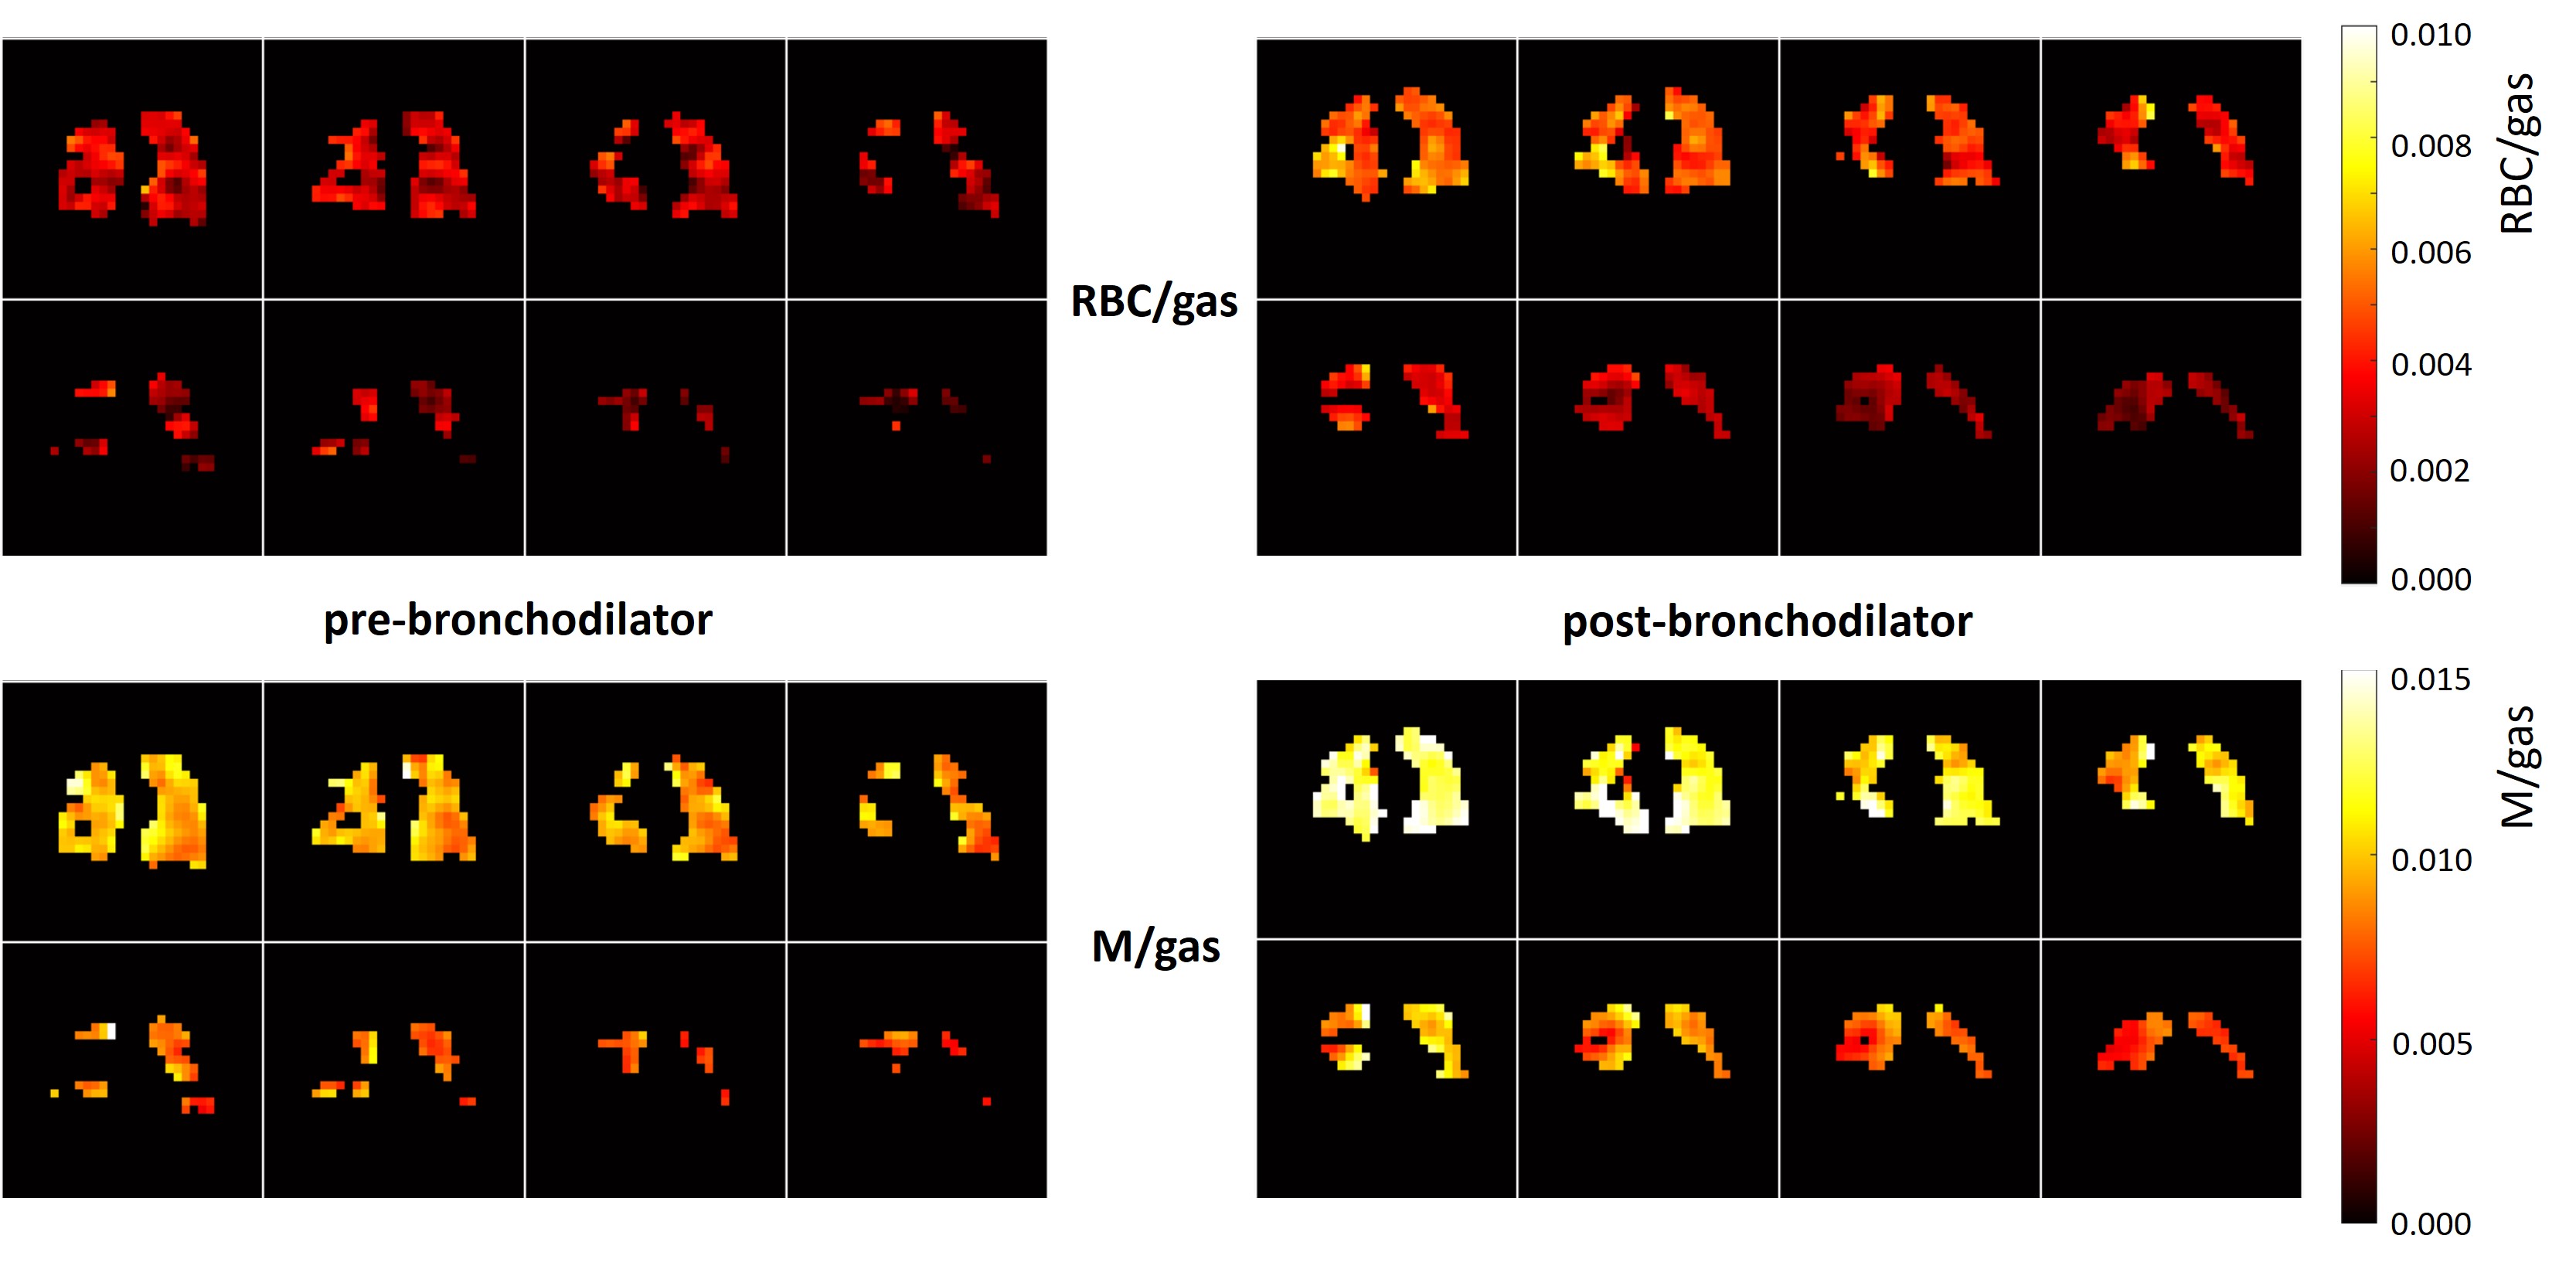
Example images are shown in figure 3.
Discussion
In a broad population of patients with asthma and/or COPD, ARBCO increased in response to bronchodilator but there was no change in RBC/M, RBC/gas or M/gas. When separate diagnosis groups were considered, RBC/gas and M/gas increased post-bronchodilator in patients with asthma+COPD, and ARBCO increased post-bronchodilator in patients with asthma only and in patients with COPD only.The amplitude of red blood cell oscillations is driven by right ventricular ejection fraction and affected by pulmonary capillary resistance9. Salbutamol has previously been found to increase cardiac output and reduce pulmonary vascular resistance in patients with primary pulmonary hypertension10, and a similar effect may be causing increased ARBCO after salbutamol inhalation here.
The mechanisms behind the findings of increased RBC/gas and M/gas post-bronchodilator in patients with asthma+COPD are currently unclear. Future work will look at these gas transfer MRI data alongside 129Xe ventilation MRI and pulmonary function test data. A limitation of the diagnostic group analysis was the uneven number of patients in the three groups and particularly the relatively small number of patients with COPD.
129Xe gas transfer MRI has previously been used to image response to bronchodilator in patients with COPD and found that 129Xe transfer to the RBCs decreased post-bronchodilator in 10/17 patients6.
Conclusion
The whole-lung 129Xe gas transfer MRI metrics of RBC/M, RBC/gas and M/gas did not change after bronchodilator inhalation in a broad population of patients with asthma and/or COPD, however, RBC/gas and M/gas increased post-bronchodilator in a sub-group of patients with asthma+COPD. The amplitude of red blood cell oscillations increased post-bronchodilator in patients with asthma or COPD, and when considering all patients together.Acknowledgements
Study funded by AstraZenecaReferences
1 Svenningsen, S. et al. Hyperpolarized (3) He and (129) Xe MRI: differences in asthma before bronchodilation. J Magn Reson Imaging 38, 1521-1530, doi:10.1002/jmri.24111 (2013).
2 Marshall, H. et al. Peripheral and proximal lung ventilation in asthma: Short-term variation and response to bronchodilator inhalation. J Allergy Clin Immunol 147, 2154-2161 e2156, doi:10.1016/j.jaci.2020.11.035 (2021).
3 Kirby, M. et al. Chronic obstructive pulmonary disease: quantification of bronchodilator effects by using hyperpolarized (3)He MR imaging. Radiology 261, 283-292, doi:10.1148/radiol.11110403 (2011).
4 Vogel-Claussen, J. et al. Effect of Indacaterol/Glycopyrronium on Pulmonary Perfusion and Ventilation in Hyperinflated Patients with Chronic Obstructive Pulmonary Disease (CLAIM). A Double-Blind, Randomized, Crossover Trial. Am J Respir Crit Care Med 199, 1086-1096, doi:10.1164/rccm.201805-0995OC (2019).
5 Singh, D. et al. Effect of indacaterol/glycopyrronium on ventilation and perfusion in COPD: a randomized trial. Respir Res 23, 26, doi:10.1186/s12931-022-01949-3 (2022).
6 Mummy, D. G. et al. Regional Gas Exchange Measured by (129) Xe Magnetic Resonance Imaging Before and After Combination Bronchodilators Treatment in Chronic Obstructive Pulmonary Disease. J Magn Reson Imaging 54, 964-974, doi:10.1002/jmri.27662 (2021).
7 Reddel, H. K. et al. Prospective observational study in patients with obstructive lung disease: NOVELTY design. ERJ Open Res 5, doi:10.1183/23120541.00036-2018 (2019).
8 Collier, G. J. et al. Dissolved (129) Xe lung MRI with four-echo 3D radial spectroscopic imaging: Quantification of regional gas transfer in idiopathic pulmonary fibrosis. Magn Reson Med 85, 2622-2633, doi:10.1002/mrm.28609 (2021).
9 Wang, Z. et al. Diverse cardiopulmonary diseases are associated with distinct xenon magnetic resonance imaging signatures. Eur Respir J 54, doi:10.1183/13993003.00831-2019 (2019).
10 Spiekerkoetter, E., Fabel, H. & Hoeper, M. M. Effects of inhaled salbutamol in primary pulmonary hypertension. Eur Respir J 20, 524-528, doi:10.1183/09031936.02.02572001 (2002).
Figures