4665
Local correlation of echo-time dependent observed lung T1 and quantitative perfusion in patients with chronic obstructive pulmonary disease
Simon Michael Florian Triphan1,2, Marilisa Konietzke1,2,3, Jürgen Biederer1,2,4,5, Hans-Ulrich Kauczor1,2, Claus Peter Heußel1,6, and Mark Oliver Wielpütz1,2
1Diagnostic and Interventional Radiology, University Hospital Heidelberg, Heidelberg, Germany, 2Translational Lung Research Center Heidelberg (TLRC), German Center for Lung Research (DZL), Heidelberg, Germany, 3Boehringer Ingelheim Pharma GmbH & Co. KG, Biberach, Germany, 4Faculty of Medicine, University of Latvia, Riga, Latvia, 5Christian-Albrechts-Universität zu Kiel, Kiel, Germany, 6Department of Diagnostic and Interventional Radiology with Nuclear Medicine, Thoraxklinik at the University Hospital of Heidelberg, Heidelberg, Germany
1Diagnostic and Interventional Radiology, University Hospital Heidelberg, Heidelberg, Germany, 2Translational Lung Research Center Heidelberg (TLRC), German Center for Lung Research (DZL), Heidelberg, Germany, 3Boehringer Ingelheim Pharma GmbH & Co. KG, Biberach, Germany, 4Faculty of Medicine, University of Latvia, Riga, Latvia, 5Christian-Albrechts-Universität zu Kiel, Kiel, Germany, 6Department of Diagnostic and Interventional Radiology with Nuclear Medicine, Thoraxklinik at the University Hospital of Heidelberg, Heidelberg, Germany
Synopsis
Keywords: Lung, Quantitative Imaging, T1 mapping, perfusion quantification, UTE
Observed TE-dependent T1 has been shown to correlate with MRI perfusion scores. Here, 22 patients with COPD were examined using DCE MRI and 2D UTE. Perfusion and T1(TE) was quantified based on these, respectively. Correlations of T1(TE) with perfusion measures were examined, with the strongest inter-patient correlation at TE2=500μs but stronger local correlations at TE1=70μs and TE3=1200μs than at TE2. The average T1 in defect areas according to DCE was shorter than in normal areas, with the smallest difference at TE2. This implies that the local TE-dependence in defect voxels is further away from previously published behaviour in healthy volunteers.Introduction
Diagnosis and monitoring of chronic obstructive pulmonary disease (COPD) is commonly focused on pulmonary function testing and computed tomography. MRI has been proposed to evaluate functional impairment of the lungs. The most widely practiced approach is Dynamic Contrast Enhanced (DCE) MRI to evaluate lung perfusion, which reflects both the destruction of the pulmonary vasculature and lung ventilation defects in response to hypoxic vasoconstriction. Visual perfusion scores have been shown to correlate with disease severity but require trained radiologists and are limited in spatial and numerical resolution1,2. Pulmonary blood flow (PBF) and the extent of perfusion defects (QDP) using DCE have been demonstrated3. Alternatively, shorter lung T1 was found in patients with COPD and CF as well as inter-patient correlations with perfusion scores4,5. It was subsequently demonstrated that observed lung T1 (T1(TE)) depends on TE, which was assumed to reflect proton compartments inside each voxel, since the inter-patient correlations of T1(TE) and other metrics varied with TE in patients6,7,8. In order to investigate this approach further, this work focused on local, voxel-wise comparison of T1-mapping and automated quantitative evaluation of DCE- MRI in COPD patients.Methods
22 patients (GOLD stage 0-4, age 68.0±6.2) with COPD from a prospective cohort study were included. Patients gave informed consent and the study was approved by the local ethical board. Measurements were performed on a 1.5T scanner (Magnetom Aera, Siemens Healthineers, Erlangen, Germany). Patients were examined using an MRI protocol which included morphological imaging, Time-resolved angiography With Stochastic Trajectories (TWIST) for DCE imaging and inversion recovery multi-echo 2D UTE for T1(TE) mapping9. For DCE, 3D images were acquired during contrast injection at 1.7s time-resolution. 2D UTE was run directly before contrast injection in free breathing, with 5 echoes at TE1-5 = 70μs, 500µs, 1200µs, 1650µs, and 2300µs with 1-2 coronal slices, matrix size 128×128, Field of View 500×500×15mm3. 6000 radial spokes with an adiabatic inversion pulse every 300 spokes were acquired including 3s delay before inversions. Spokes were sorted by inversion time (TI) and reconstructed along a sliding window with 120 spokes width and 50% overlap using a non-uniform Fourier transform. T1(TE) maps were calculated based on these UTE images10. DCE and UTE images were segmented separately. DCE segmentation was based on additional morphological images3. PBF maps were calculated from DCE images by automatically detecting an arterial input function and applying a deconvolution. Otsu's method was applied to the maxima of the residual of this deconvolution to determine two thresholds, which split the lungs into normal and perfusion defect voxels. The fraction of defect voxels in these classification maps was defined as QDP. Only the averaged partitions in DCE images corresponding to UTE slices were used. DCE and UTE images were averaged over their time-courses and registered. The resulting transformation fields were applied to PBF and defect classification maps. Spearman's correlation coefficients were calculated for inter-patient correlations for median T1(TE) with PBF and QDP as well as local correlations of T1(TE) with PBF. T1(TE) in defect and normal areas according to classification maps was determined and compared using Wilcoxon rank-sum tests.Results
Figure 1 shows an example set of base images and parameter maps in one patient. The inter-patient correlation coefficients were ρIP1-5=0.56, 0.64, 0.59, 0.60, 0.29 at TE1-5 for T1(TE) with median PBF and ρIQ1-5=-0.56, -0.76, -0.63, -0.53, -0.26 with QDP. The average local correlation coefficients of T1(TE) with PBF were ρLP1-5=0.44, 0.39, 0.42, 0.39, 0.24. Figure 2 shows the coefficients for individual patients. At TE1=70µs, in 18 out of 22 patients, T1 was shorter in defect areas compared to normal areas. When considered over all patients, T1 was shorter on average at all TE in defect areas. As shown in Figure 3, the relative difference in mean T1 in these areas averaged over all patients was smaller at TE2 than at TE1 and TE3. Visual inspection of parameter maps suggested that stronger local correlations appeared in those patients where areas with recognizable perfusion and longer T1 remained.Discussion
Inter-patient correlations of T1(TE) with perfusion measures showed the strongest correlation at TE2=500µs. This agrees well with previously published inter-patient correlations between T1(TE) and clinical metrics, quantitative CT and MRI perfusion scores8. However, local correlations instead showed the strongest correlations at TE1=70µs and weaker correlations at TE2 than at TE3=1200µs. This coincides with the relative difference of T1 in normal and defect areas being smallest at TE2. Since it was previously shown that T1 increases with TE more slowly in healthy volunteers than in patients with COPD8, this supports the hypothesis that the TE-dependence of T1 in normal areas is closer to that in healthy subjects than in defect areas: At TE2, the differentiation between both is weakest. This implies that the disease state locally affects both baseline T1 as well as its TE-dependence. Altogether, these results are promising and further research is warranted to investigate the potential clinical value of quantitative T1(TE) imaging for regional lung function assessment.Acknowledgements
No acknowledgement found.References
1. Eichinger M, Optazaite D-E, Kopp-Schneider A, et al. Morphologic and functional scoring of cystic fibrosis lung disease using MRI. European Journal of Radiology 2012:81:1321–1329.2. Wielpütz MO, Puderbach M, Kopp-Schneider A, et al. Magnetic Resonance Imaging Detects Changes in Structure and Perfusion, and Response to Therapy in Early Cystic Fibrosis Lung Disease. Am J Respir Crit Care Med 2014:189:956–965.
3. Schiwek M, Triphan SMF, Biederer J, et al. Quantification of pulmonary perfusion abnormalities using DCE-MRI in COPD: comparison with quantitative CT and pulmonary function. European Radiology 2022:32:1879–1890.
4. Jakob PM, Wang T, Schultz G, Hebestreit H, Hebestreit A, Hahn D. Assessment of human pulmonary function using oxygen-enhanced T1 imaging in patients with cystic fibrosis. Magn Reson Med 2004:51:1009–1016.
5. Jobst BJ, Triphan SMF, Sedlaczek O, et al. Functional Lung MRI in Chronic Obstructive Pulmonary Disease: Comparison of T1 Mapping, Oxygen-Enhanced T1 Mapping and Dynamic Contrast Enhanced Perfusion. PLoS ONE 2015:10:e0121520-e0121520.
6. Triphan SMF, Jobst BJ, Breuer FA, Wielpütz MO, Kauczor H-U, Biederer J, Jakob PM. Echo time dependence of observed T1 in the human lung. Journal of Magnetic Resonance Imaging 2015:42:610–616.
7. Triphan SMF, Stahl M, Jobst BJ, et al. Echo Time-Dependence of Observed Lung T1 in Patients With Cystic Fibrosis and Correlation With Clinical Metrics. J Magn Reson Imaging 2020:52:1645–1654.
8. Triphan SMF, Weinheimer O, Gutberlet M, et al. Echo Time-Dependent Observed Lung T1 in Patients With Chronic Obstructive Pulmonary Disease in Correlation With Quantitative Imaging and Clinical Indices. J Magn Reson Imaging 2021:54:1562–1571.
9. Triphan SMF, Breuer FA, Gensler D, Kauczor H-U, Jakob PM. Oxygen enhanced lung MRI by simultaneous measurement of T1 and T2* during free breathing using ultrashort TE. Journal of Magnetic Resonance Imaging 2015:41:1708–1714.
10. Deichmann R, Haase A. Quantification of T1 values by SNAPSHOT-FLASH NMR imaging. J Magn Reson Imaging 1992:96:608–612.
Figures
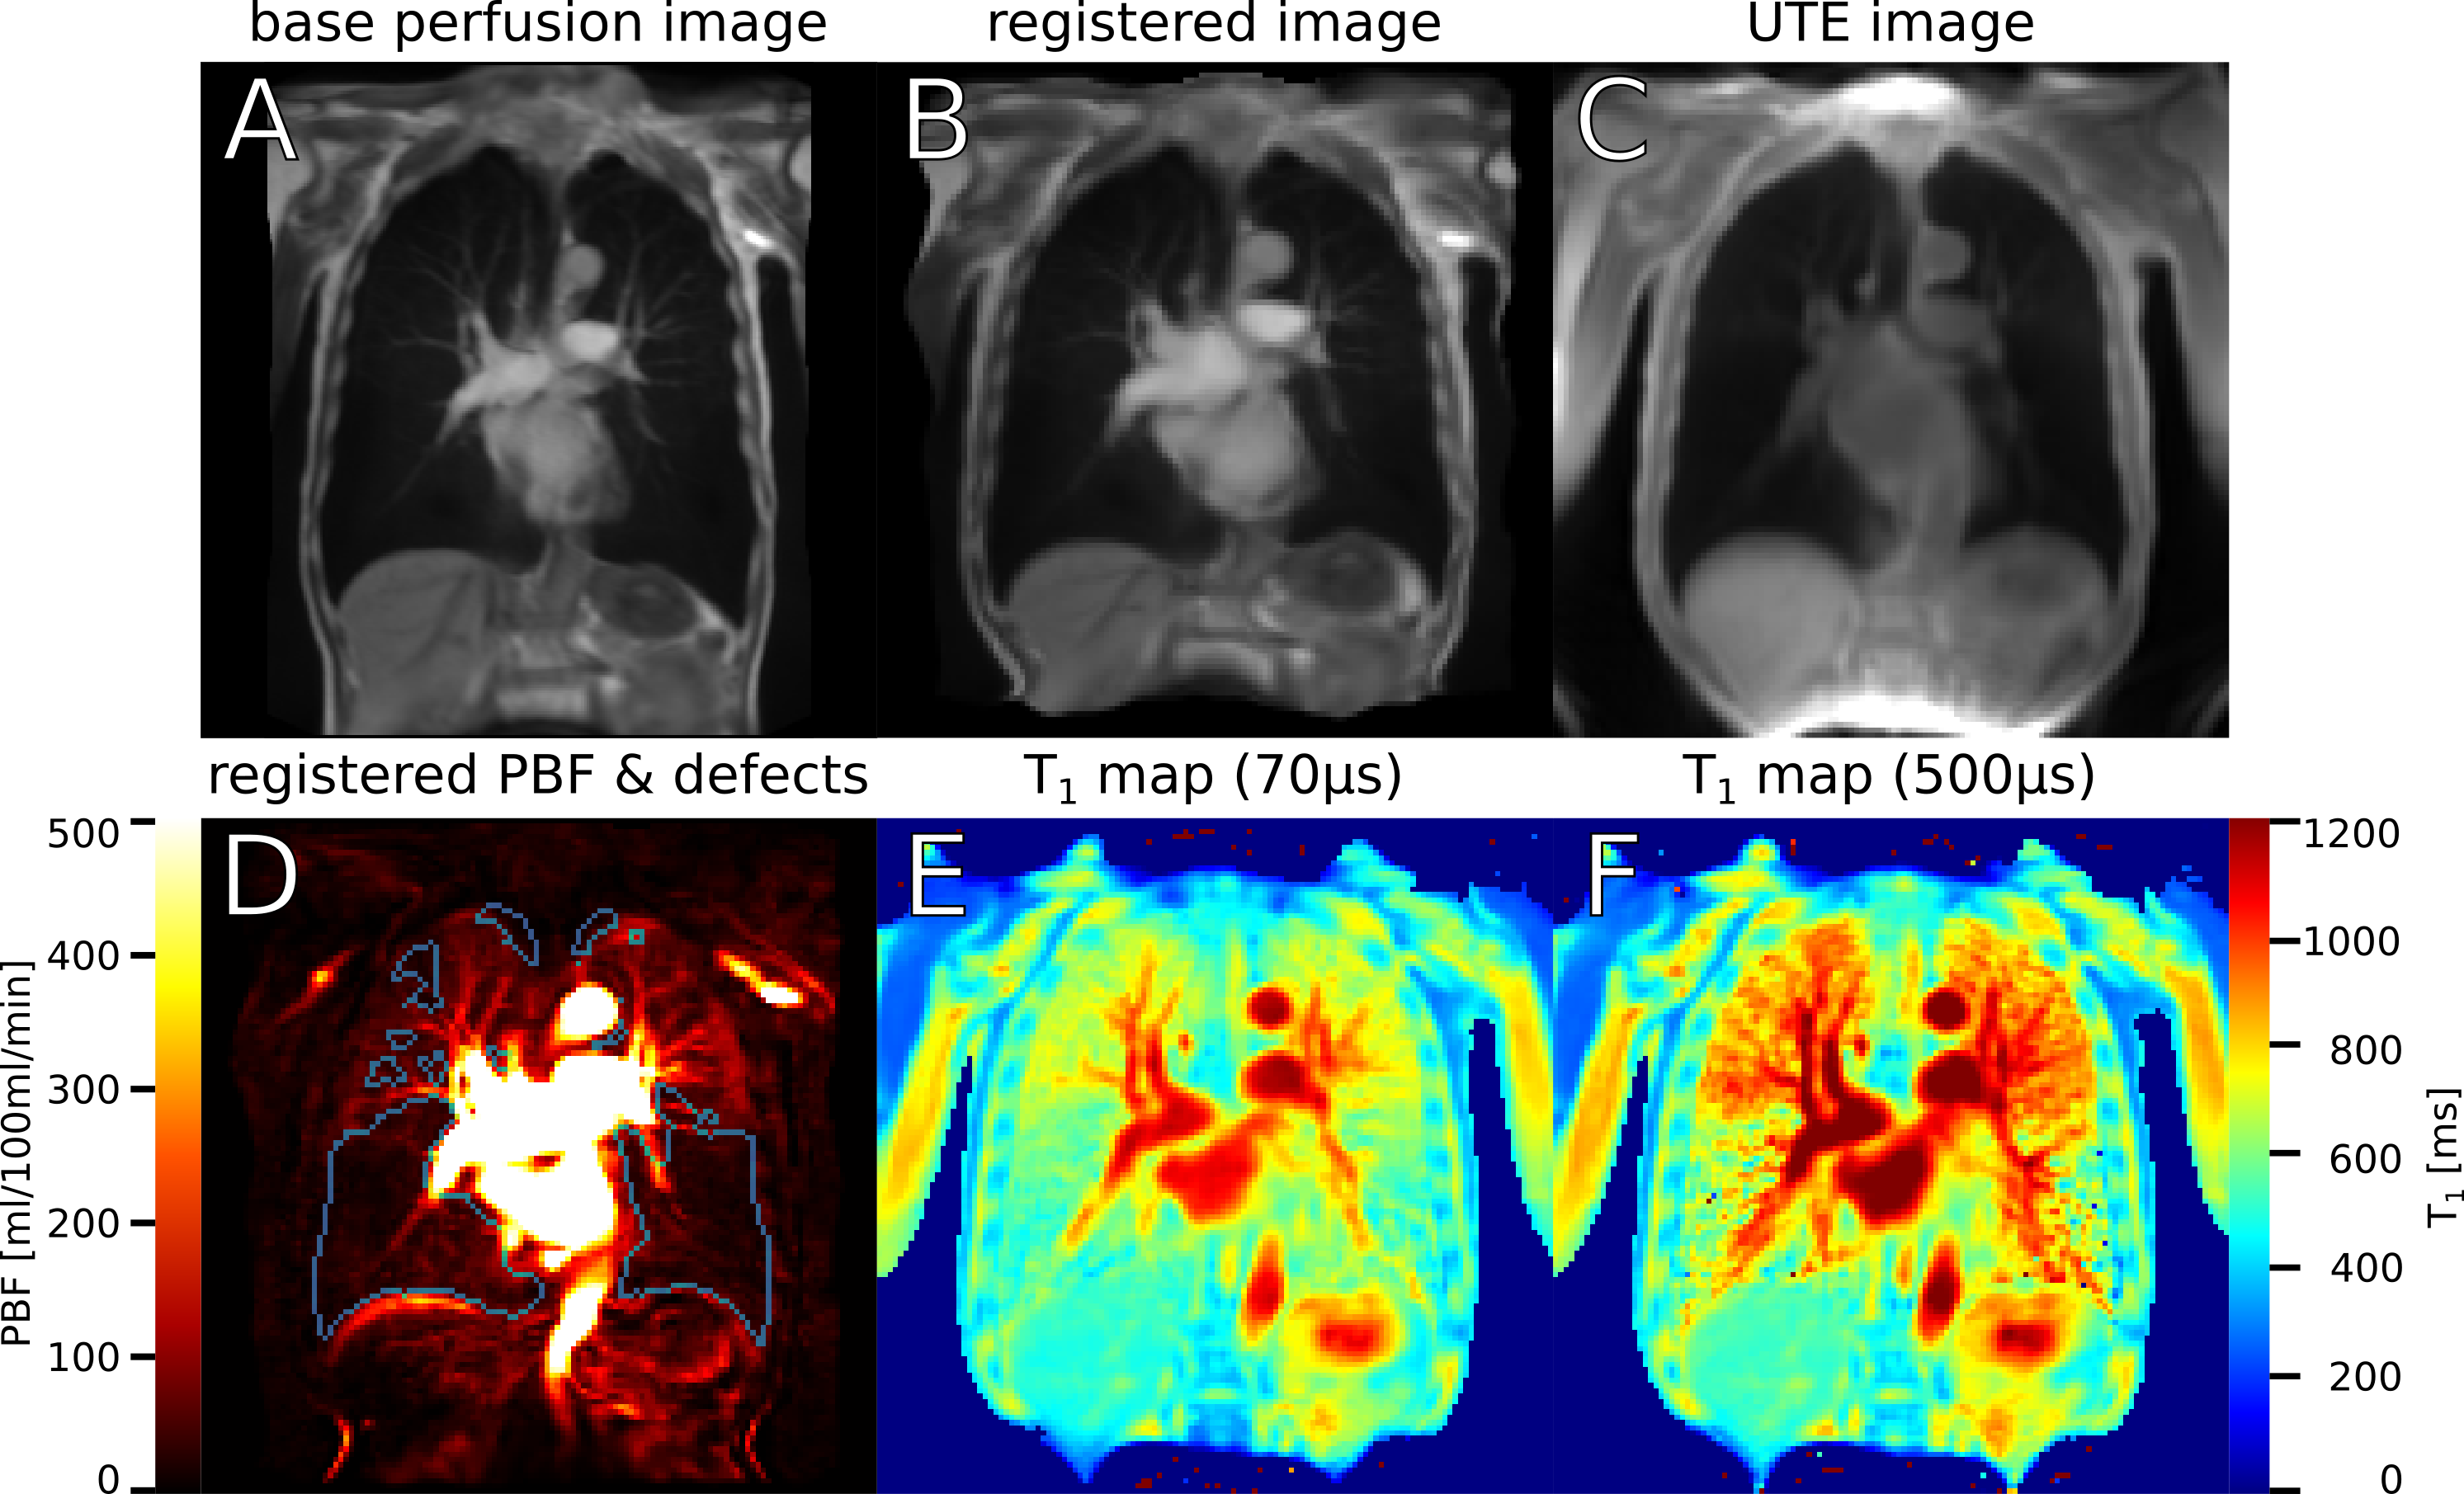
A:
Original image from DCE MRI, averaged over all timepoints and three
slices. B: The same image, registered to the UTE image. C: Image
derived from inversion recovery UTE that was used as registration
target. D: PBF map after application of the distortion field produced
by the image registration, with perfusion defects delineated in blue.
E: T1 map acquired using UTE at TE1=70µs.
F: T1 map at TE2=500µs.
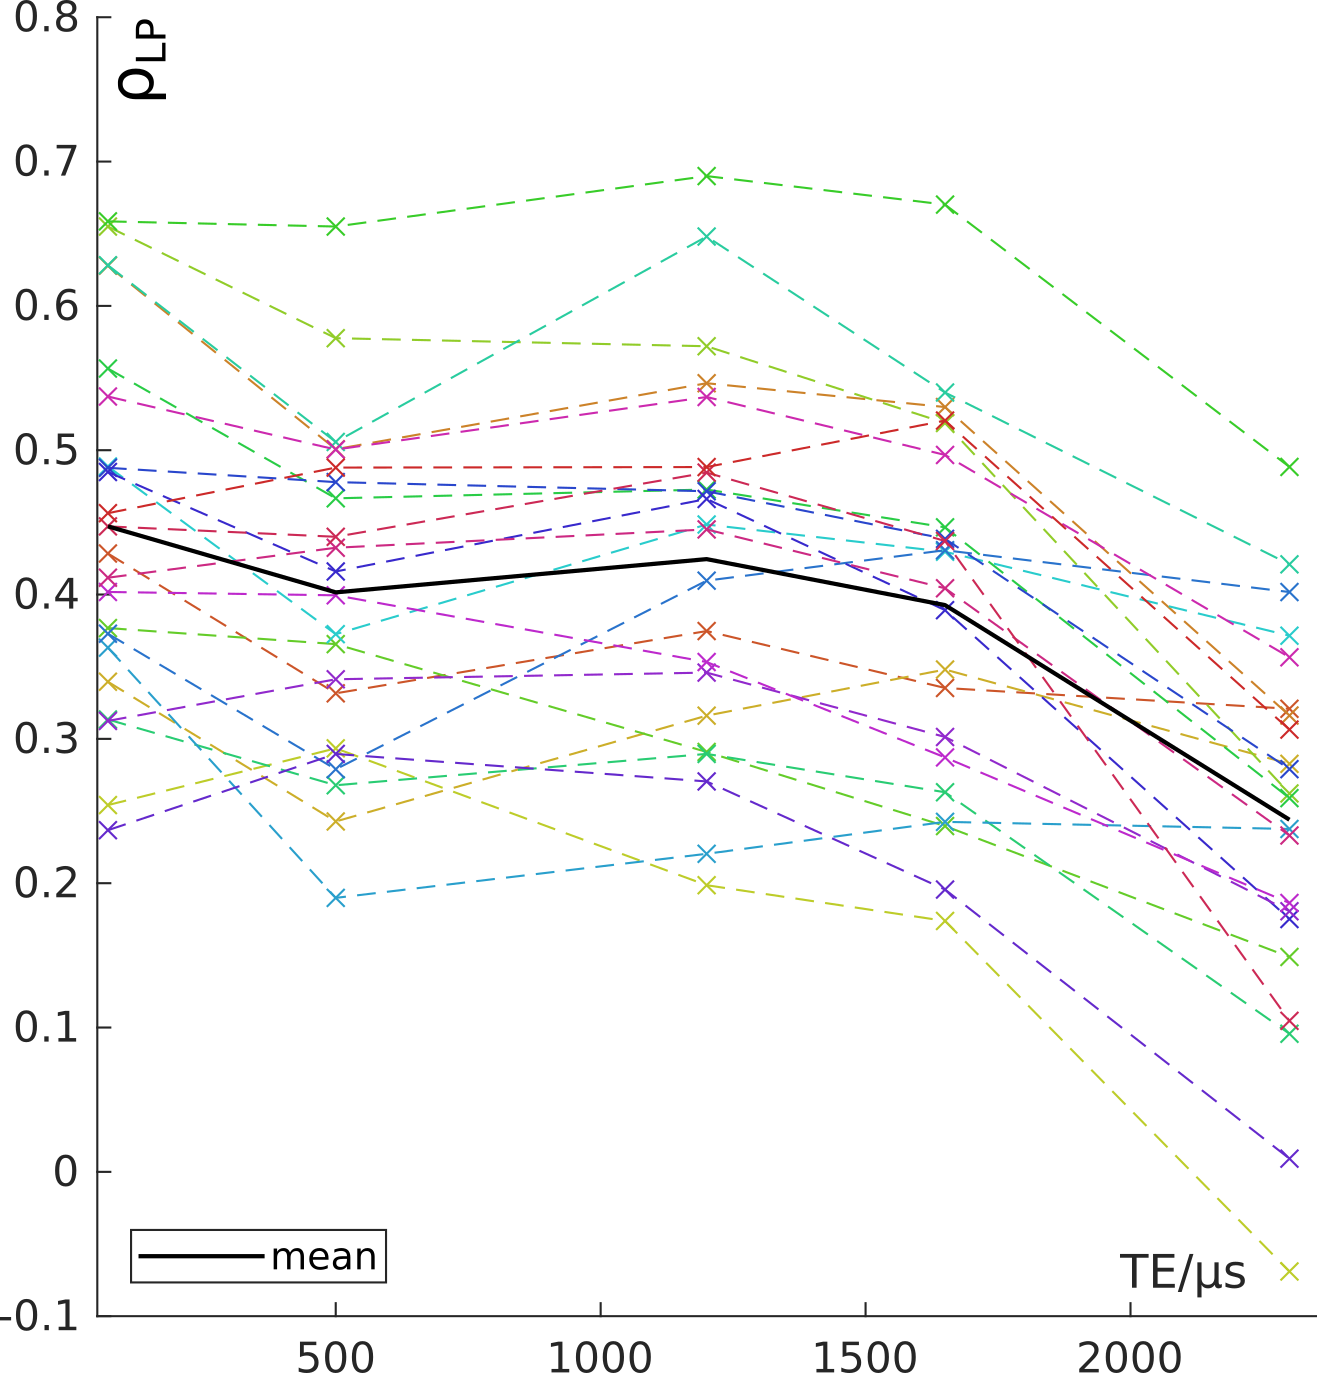
Spearman's
correlation coefficients for the voxel-wise local correlation of
T1(TE) with PBF.
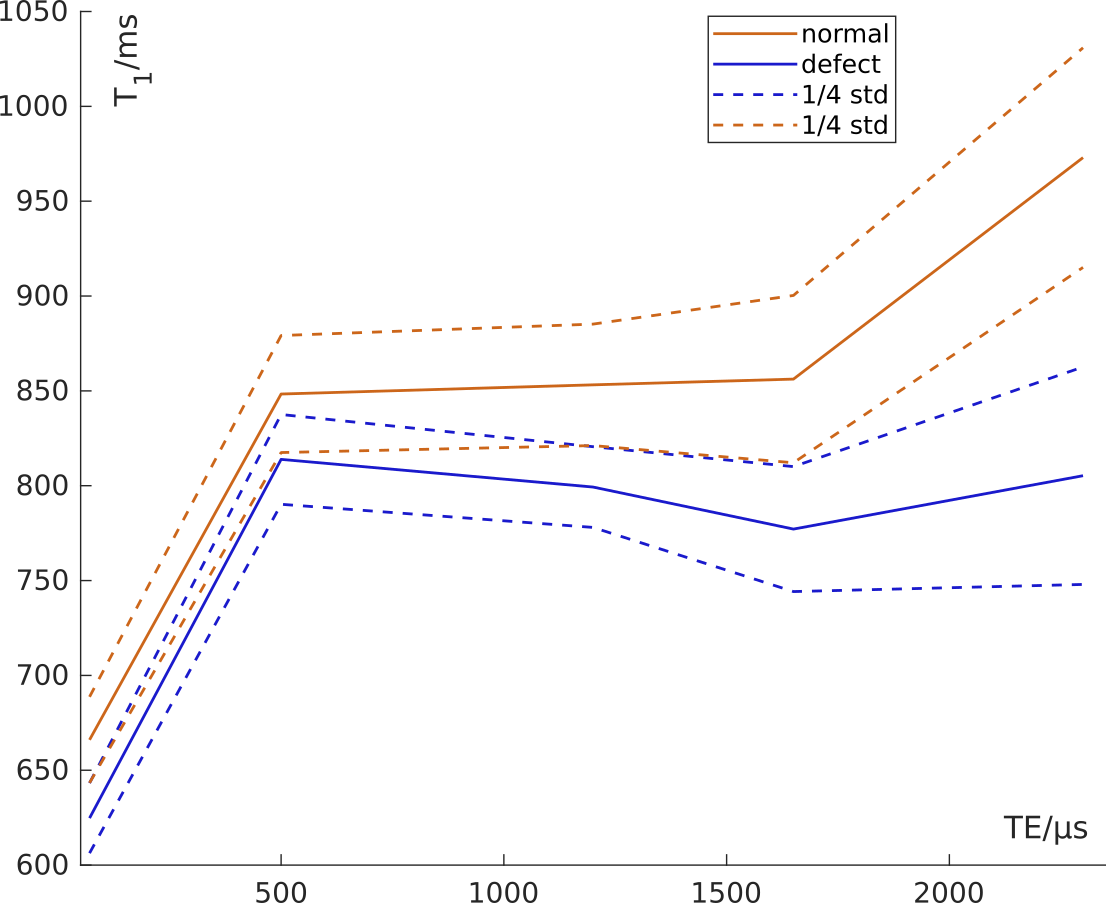
Mean
T1 over all patients at each TE, calculated from the median T1 in
defect classification areas.
DOI: https://doi.org/10.58530/2023/4665