4663
Longitudinal 129Xe MRI assessment of lung gas transfer and microstructure over 1 year in patients with asthma and/or COPD1University of Sheffield, Sheffield, United Kingdom, 2Priory Medical Group, York, United Kingdom, 3AstraZeneca, Gothenburg, Sweden, 4AstraZeneca, Cambridge, United Kingdom
Synopsis
Keywords: Lung, Hyperpolarized MR (Gas)
Longitudinal changes of 129Xe MRI metrics in patients with asthma and/or COPD have not yet been reported. 140 patients with asthma and/or COPD were scanned at 2 visits, 1 year apart, using 129Xe gas transfer and diffusion MRI. From visit 1 to visit 2 red blood cell (RBC) / membrane (M) and RBC/gas decreased and the amplitude of red blood cell oscillations (ARBCO) increased when all patients were considered. RBC/M and RBC/gas decreased in asthma+COPD, and RBC/M decreased and ARBCO increased in asthma from visit 1 to visit 2. M/gas and acinar microstructure metrics did not change significantly between visits.Introduction
Sensitive measures of lung function are required for effective monitoring of disease progression. Previously, 3He ventilation MRI has been found to be sensitive to longitudinal change over 2.5 years in patients with COPD1. Hyperpolarised 129Xe MRI can assess gas transfer2,3 in addition to ventilation4,5 and acinar microstructure6. However, longitudinal changes of 129Xe MRI metrics in patients with asthma and/or COPD have not yet been reported.The aim of this work was to assess gas transfer and microstructure in patients with a broad range of asthma and/or COPD with 129Xe MRI at two visits 1 year apart.
Methods
165 patients (aged 28 – 82) with asthma and/or COPD taking part in the NOVELTY study7 (NCT02760329) were recruited from 2 primary care centres in the UK. Patients were scanned at 2 visits, 1 year apart, and in both cases > 20 minutes after inhalation of 400 µg of salbutamol.Patients were scanned using a 1.5T whole body MRI system (GE HDx) and 129Xe transmit-receive vest coil (CMRS) at breath-hold after inhaling a mix of hyperpolarised 129Xe and N2 (1L or less according to height) from functional residual capacity. 3D dissolved-phase 129Xe spectroscopic images8 and 3D multiple b-value 129Xe diffusion images9 were acquired at each visit to assess gas transfer and microstructure, respectively.
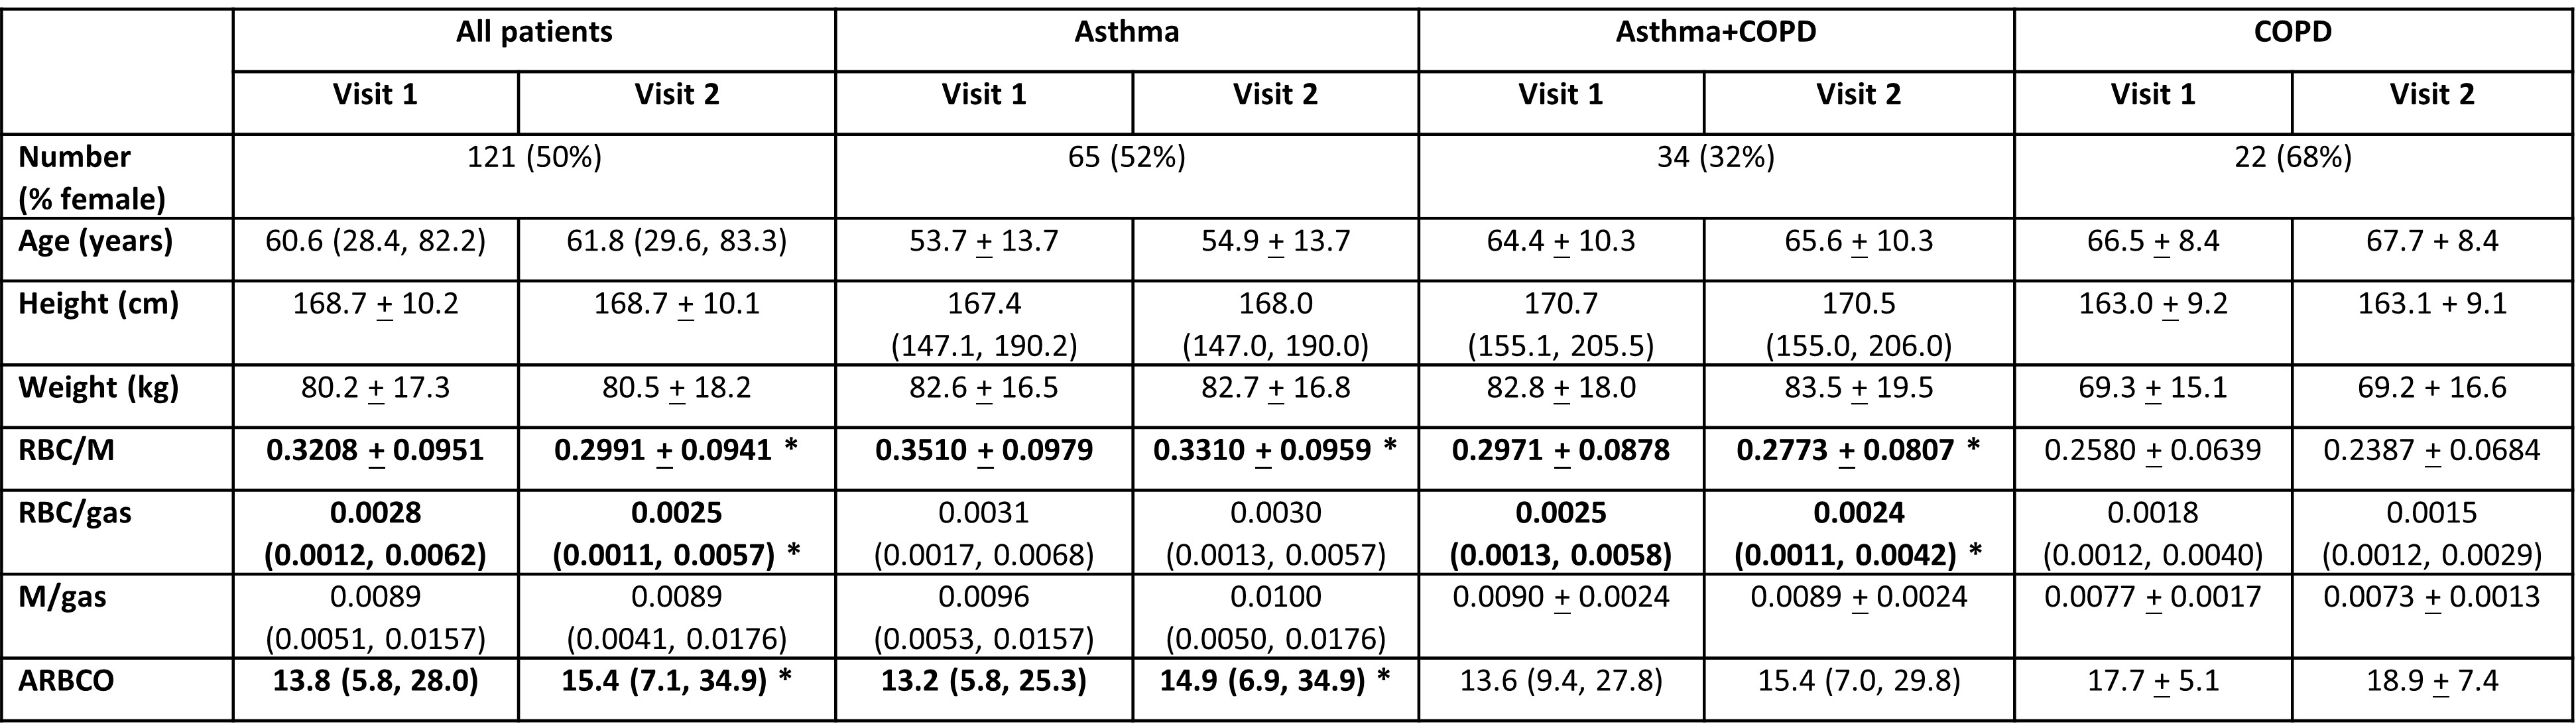
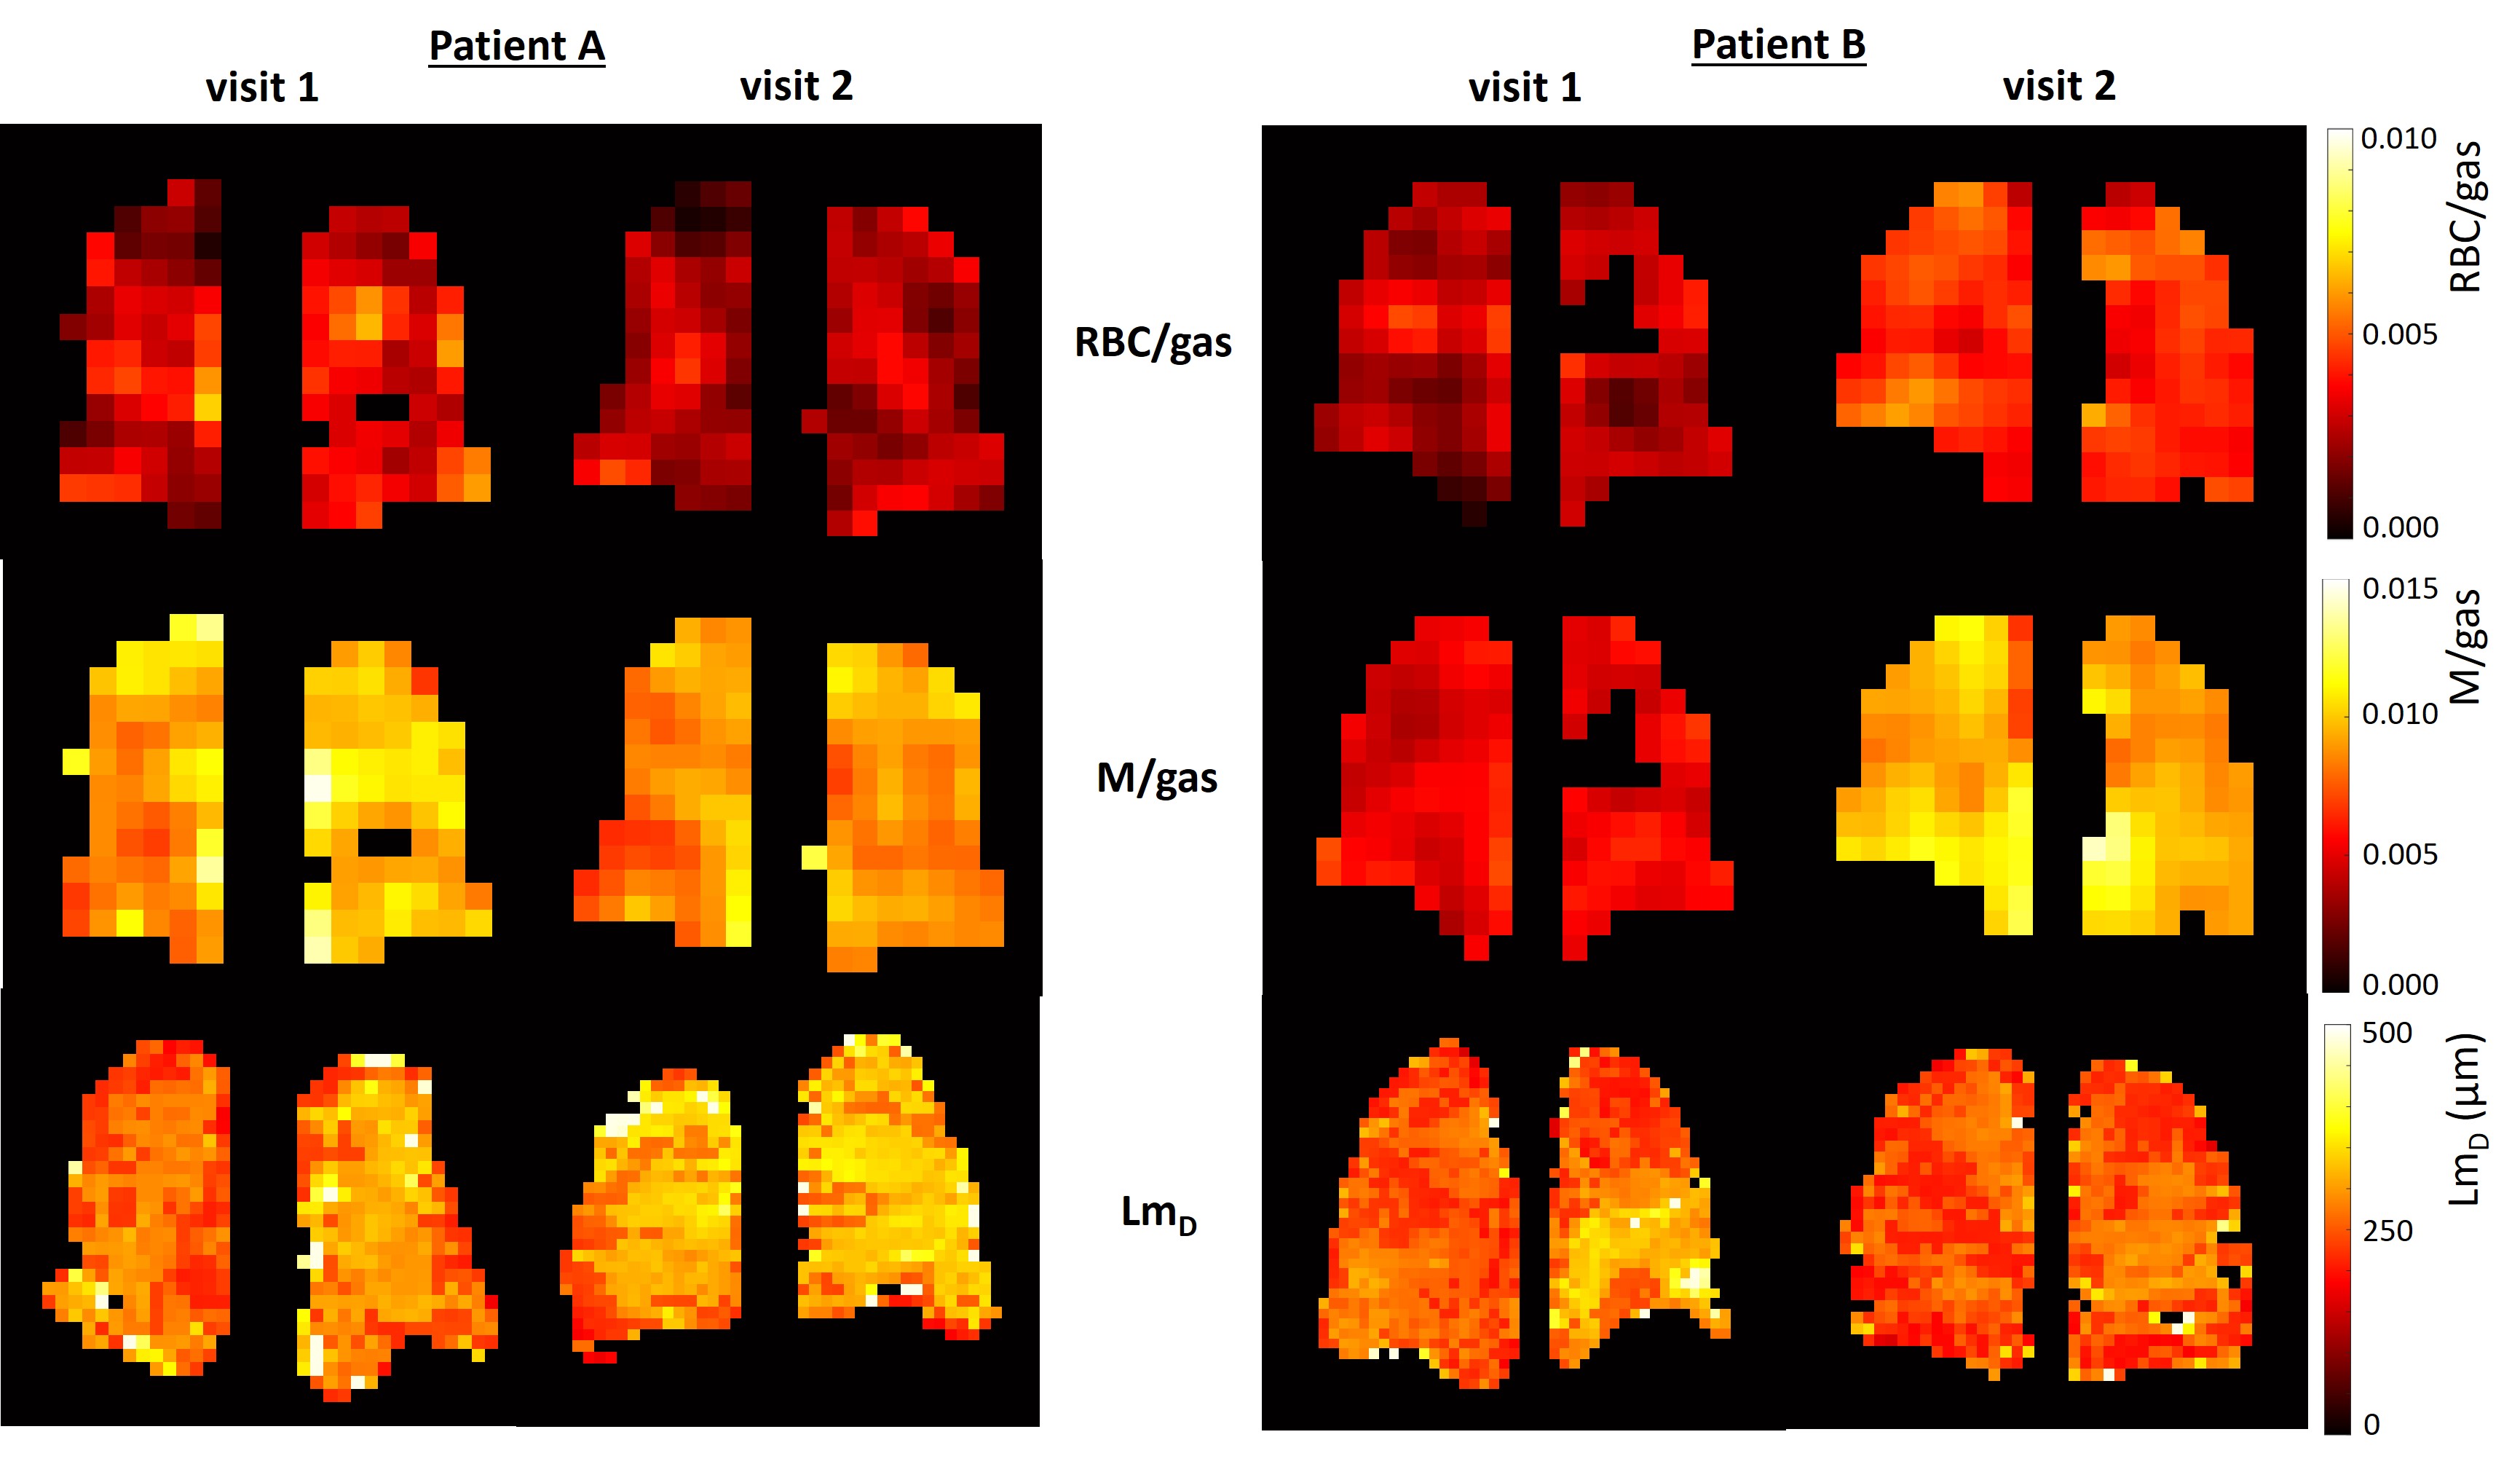
Images of 129Xe in the airspaces (gas), 129Xe dissolved in red blood cells (RBC), and 129Xe dissolved in the membrane (M) were used to calculate whole-lung ratios (gas transfer metrics) of RBC/M, RBC/gas and M/gas8. The amplitude of RBC oscillations (ARBCO; a metric of cardio-pulmonary blood flow) was also calculated where enough RBC signal allowed. Maps of apparent diffusion coefficient (ADC) and mean diffusive length scale (LmD, a measure of acinar dimension) were calculated9.
For patients with useable data at both visits, paired t-tests or Wilcoxon signed rank tests evaluated statistical difference between data acquired at visit 1 and visit 2 for all patients and for patients grouped according to physician-assigned diagnosis of asthma, asthma+COPD or COPD.
Results
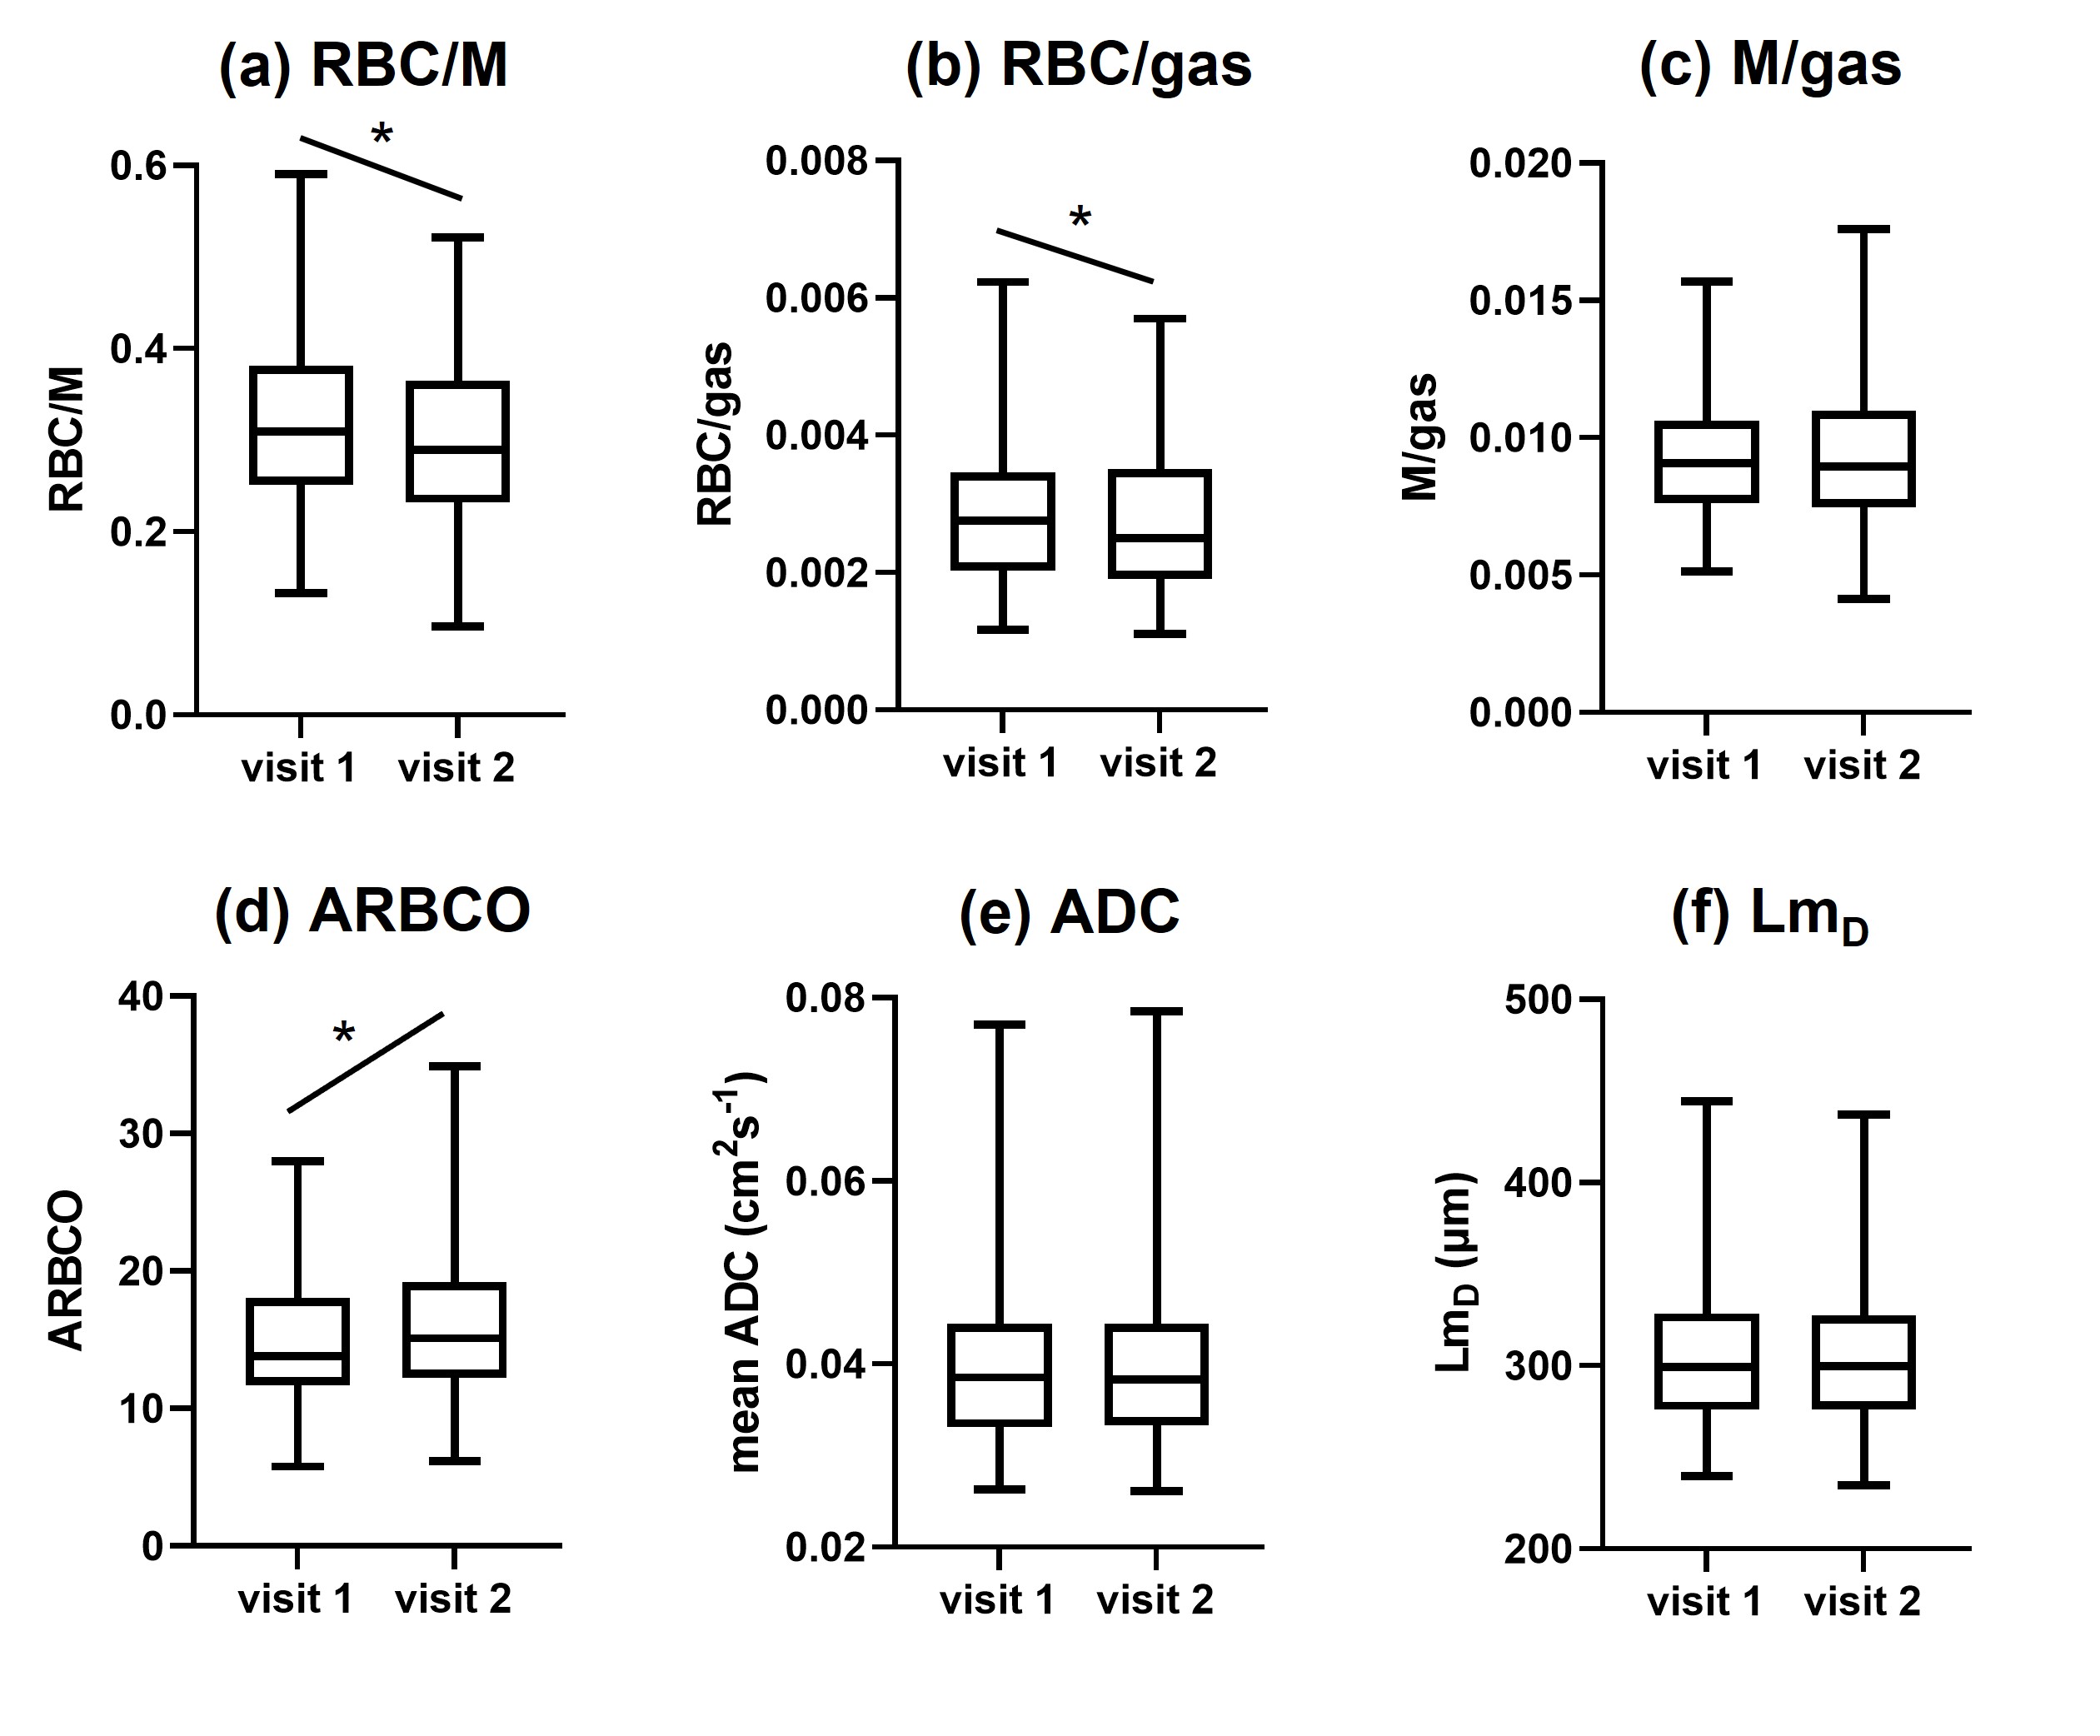
165 patients were scanned at visit 1 and 140 patients returned for visit 2. The gas transfer metrics of 121 patients and the acinar microstructure metrics of 135 patients were assessed (tables 1 and 2). ARBCO was calculated for 104 patients. Of the patients included in the gas transfer analysis, 54% had asthma, 28% had asthma+COPD and 18% had COPD, and the proportions were similar for the patients included in the microstructure analysis (tables 1 and 2).From visit 1 to visit 2, RBC/M decreased (from 0.3208 to 0.2991, p<0.0001), RBC/gas decreased (from 0.0028 to 0.0025, p=0.0014) and ARBCO increased (from 13.8 to 15.4, p=0.0134) when all patients were considered (figure 1). M/gas, ADC and LmD did not change significantly from visit 1 to visit 2.
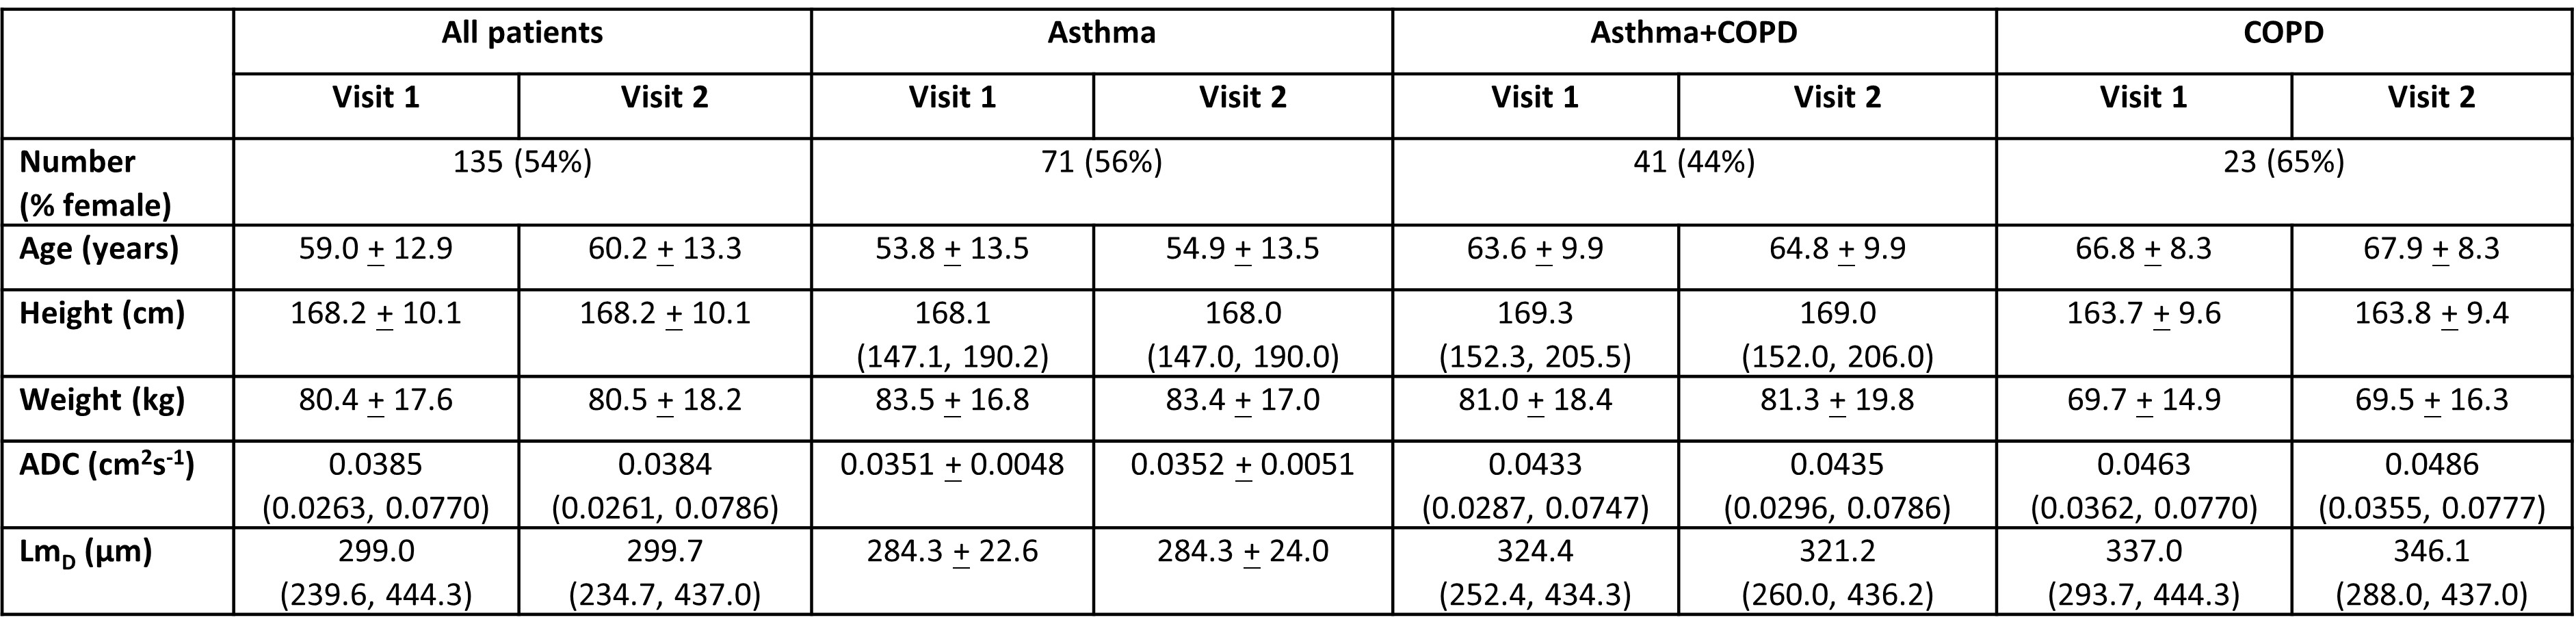
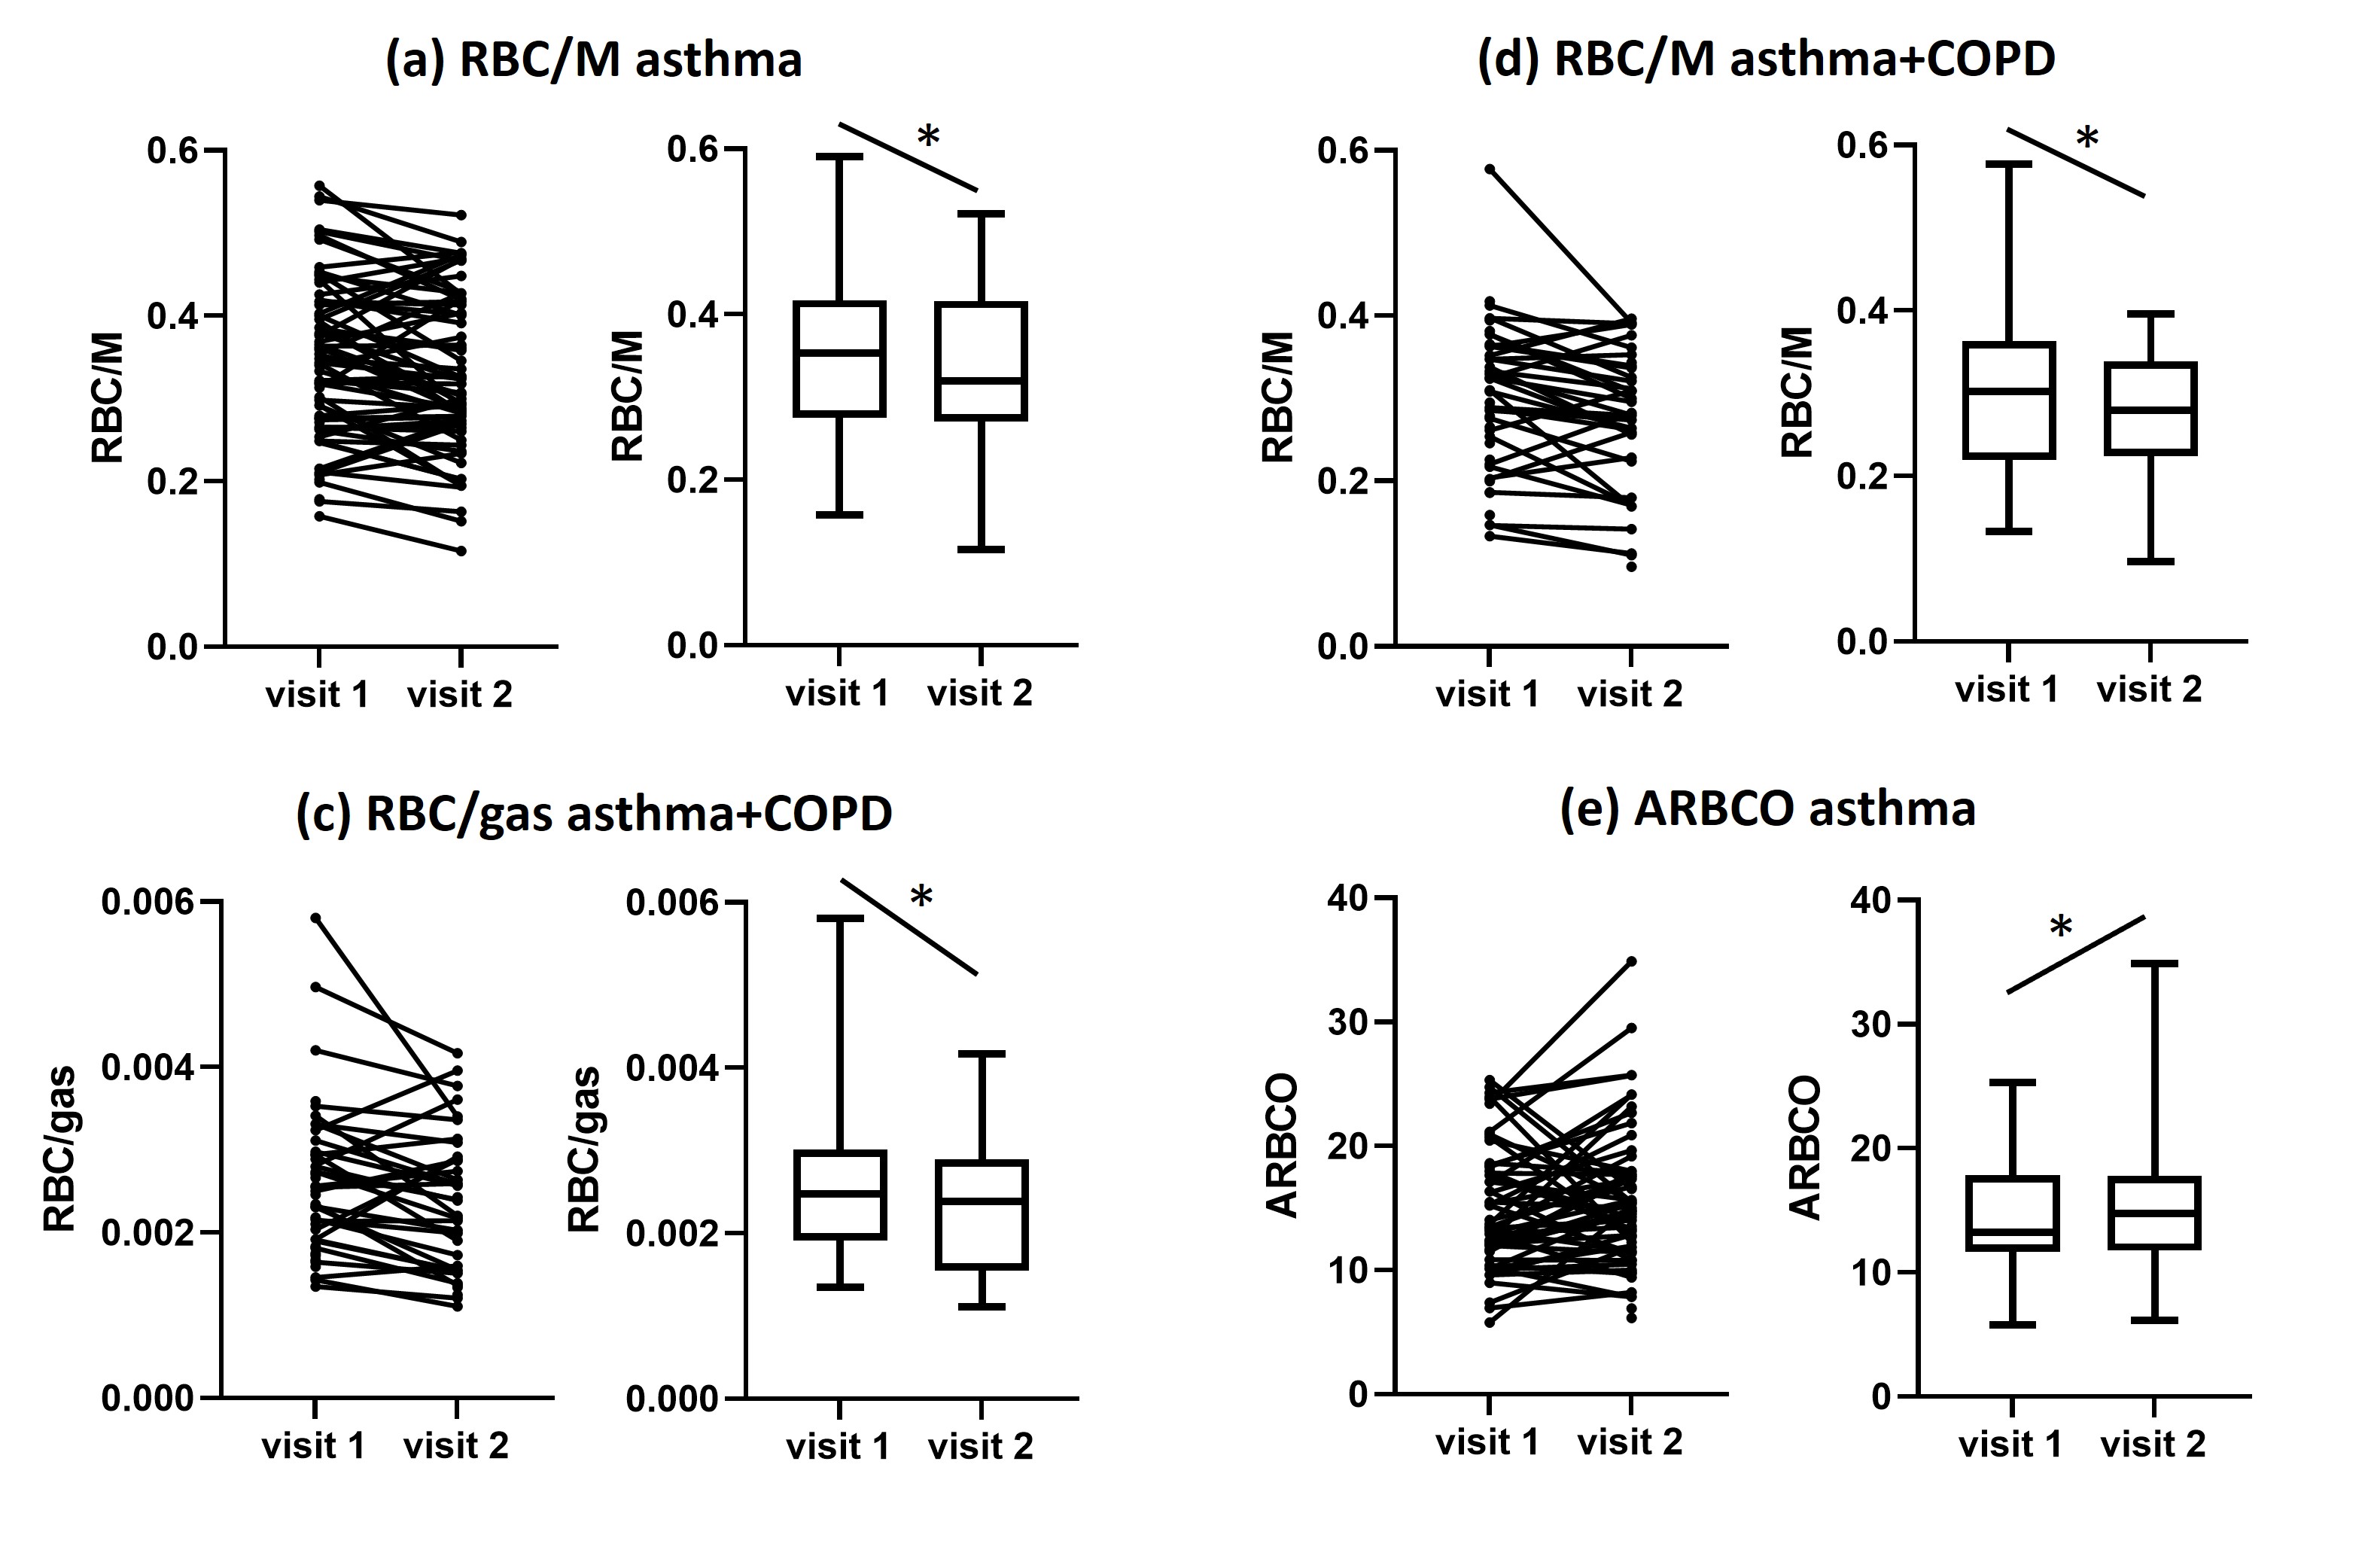
When patients were divided into diagnosis groups, RBC/M decreased in patients with asthma (from 0.3510 to 0.3310, p=0.0035) and in patients with asthma+COPD (from 0.2971 to 0.2773, p=0.0047), RBC/gas decreased in patients with asthma+COPD (from 0.0025 to 0.0024, p=0.0118), and ARBCO increased in patients with asthma (from 13.2 to 14.9, p=0.0496) from visit 1 to visit 2 (figure 2). There were no other significant changes in metrics grouped according to diagnosis.
Example images are shown in figure 3.
Discussion
Substantial disease progression over the course of a year was not expected in this population of patients recruited from primary care. Both gas transfer10 and diffusion11 metrics change with age, but the changes in RBC/M (-0.02) and RBC/gas (-3 x 10⁻⁴) observed here are an order of magnitude greater than the changes seen in healthy aging (RBC/M = -0.003 per year, RBC/gas = -4 x 10⁻⁵ per year)10.At visit 1 patients attended after taking their regular medication and were scanned after inhalation of salbutamol. At visit 2 patients attended after withholding bronchodilator medications for 24 hours as part of assessment for bronchodilator reversibility. The data used in this analysis were acquired after inhalation of salbutamol, however, it is possible that the short-acting bronchodilator did not fully reverse the effects of having withheld all bronchodilator medications for 24 hours previously, resulting in patients having poorer gas transfer at visit 2 than visit 1.
The amplitude of red blood cell oscillations is affected by right ventricular ejection fraction and pulmonary capillary resistance3, and the mechanisms behind the findings of increased ARBCO at visit 2 compared to visit 1 are currently unclear. The increase of ARBCO in patients with asthma was only just significant (p=0.0496).
Future work will look at these gas transfer and diffusion MRI data alongside 129Xe ventilation MRI and pulmonary function test data. A limitation of the diagnostic group analysis was the uneven number of patients in the three groups and particularly the relatively small number of patients with COPD.
Conclusion
Gas transfer measured by 129Xe MRI decreased over 1 year in a broad population of patients with asthma and/or COPD, and in sub-groups of patients with asthma and asthma+COPD. ARBCO increased after a year in patients with asthma and/or COPD, however, the reasons for these longitudinal changes in gas transfer metrics are currently unclear. Acinar microstructure metrics and M/gas did not change significantly over 1 year.Acknowledgements
Study funded by AstraZenecaReferences
1 Kirby, M. et al. MRI ventilation abnormalities predict quality-of-life and lung function changes in mild-to-moderate COPD: longitudinal TINCan study. Thorax 72, 475-477, doi:10.1136/thoraxjnl-2016-209770 (2017).
2 Qing, K. et al. Assessment of lung function in asthma and COPD using hyperpolarized 129Xe chemical shift saturation recovery spectroscopy and dissolved-phase MRI. NMR Biomed 27, 1490-1501, doi:10.1002/nbm.3179 (2014).
3 Wang, Z. et al. Diverse cardiopulmonary diseases are associated with distinct xenon magnetic resonance imaging signatures. Eur Respir J 54, doi:10.1183/13993003.00831-2019 (2019).
4 Kirby, M. et al. Hyperpolarized 3He and 129Xe MR imaging in healthy volunteers and patients with chronic obstructive pulmonary disease. Radiology 265, 600-610, doi:10.1148/radiol.12120485 (2012).
5 Svenningsen, S. et al. Hyperpolarized (3) He and (129) Xe MRI: differences in asthma before bronchodilation. J Magn Reson Imaging 38, 1521-1530, doi:10.1002/jmri.24111 (2013).
6 Kaushik, S. S. et al. Diffusion-weighted hyperpolarized 129Xe MRI in healthy volunteers and subjects with chronic obstructive pulmonary disease. Magn Reson Med 65, 1154-1165, doi:10.1002/mrm.22697 (2011).
7 Reddel, H. K. et al. Prospective observational study in patients with obstructive lung disease: NOVELTY design. ERJ Open Res 5, doi:10.1183/23120541.00036-2018 (2019).
8 Collier, G. J. et al. Dissolved (129) Xe lung MRI with four-echo 3D radial spectroscopic imaging: Quantification of regional gas transfer in idiopathic pulmonary fibrosis. Magn Reson Med 85, 2622-2633, doi:10.1002/mrm.28609 (2021).
9 Chan, H. F., Stewart, N. J., Norquay, G., Collier, G. J. & Wild, J. M. 3D diffusion-weighted (129) Xe MRI for whole lung morphometry. Magn Reson Med 79, 2986-2995, doi:10.1002/mrm.26960 (2018).
10 Collier, G. J. et al. in International Society for Magnetic Resonance in Medicine. 1174. 11 Petersson-Sjogren, M. et al. Airspace Dimension Assessment (AiDA) by inhaled nanoparticles: benchmarking with hyperpolarised (129)Xe diffusion-weighted lung MRI. Sci Rep 11, 4721, doi:10.1038/s41598-021-83975-7 (2021).
Figures