4662
Functional Pulmonary Proton MRI: Voxel-wise Linear-fitting Ventilation (VOLVE) Assessment in Chronic Obstructive Pulmonary Disease (COPD)1Sir Peter Mansfield Imaging Centre, University of Nottingham, Nottingham, United Kingdom, 2NIHR Nottingham Biomedical Research Centre (BRC), Respiratory Medicine, School of Medicine, University of Nottingham, Nottingham, United Kingdom
Synopsis
Keywords: Lung, Quantitative Imaging, COPD
The VOLVE (VOxel-wise Linear fit VEntilation, VOLVE) method, whereby voxel-wise linear fitting between the lung-diaphragm navigator signal and lung parenchyma MR signal is used to assess regional ventilation, was investigated in chronic obstructive pulmonary disease (COPD) and alpha-1 antitrypsin deficiency (A1ATD). Fractional ventilation (FV) maps derived from phase-resolved functional lung imaging (PREFUL) were also determined. Significant differences between the healthy and the lung disease groups were found, indicating the sensitivity of these techniques to emphysematous lung disease.
Introduction
There are several quantitative methods to assess ventilation using free-breathing dynamic proton MRI. Phase-resolved functional lung imaging (PREFUL) considers the change in lung signal during the respiratory cycle by sorting images according to inspiratory/expiratory phase derived from a navigator signal in a lung-diaphragm interface region of interest (ROI)[1]. Recently we proposed the voxel-wise mapping of the correlation and gradient of the linear fit of the proton density signal in each lung parenchyma voxel against the navigator signal across a time series as a measure of ventilation[2], termed VOxel-wise Linear fit VEntilation (VOLVE) MRI. We have assessed this in patients with chronic obstructive pulmonary disease (COPD) and alpha-1 antitrypsin deficiency (A1ATD), and healthy controls. Functional maps produced are compared with PREFUL fractional ventilation (FV) measures[3], and the repeatability assessed.Methods
Healthy non-smokers (n=6), “healthy” ex-smokers (>10 pack-years) (n=3), people with COPD (n=6) and A1ATD (n=5) were recruited. All participants underwent non-contrast enhanced 1H MRI on a 3T Philips Ingenia scanner. A dynamic image timeseries of a single coronal slice placed posterior to the heart (~1cm) was collected using a 2D Fast Field Echo acquisition (TR/TE=1.9/0.57ms, α=18°, 4.37 images/second) during free breathing, with 512 images collected in 117s. A repeat scan was collected ~15 minutes later.Image analysis was performed using custom-written MATLAB scripts; an overview of the pipeline is shown in Figure 1. First, the navigator signal in an automatically defined ROI spanning the right hemidiaphragm and peripheral right lung was determined by averaging the MR signal before registration. The lung image series was registered to a mid-ventilation image using a demons-based registration[4], with the target image semi-automatically masked by seeded region growing[5]. Lowpass filtering at 0.6 Hz was applied to each voxel time course to remove the cardiac signal contribution. The navigator signal was expressed as a percentage change from full expiration. Then, a voxel-wise least-squares linear fit of the signal of each lung parenchyma voxel versus the navigator signal at each time point was used to determine the correlation coefficient (CC) and gradient of linear fit. York’s solution to a linear least-squares fit with errors in both coordinates was used to determine the gradient[6]. For comparison, fractional ventilation (FV) was determined using PREFUL analysis[3]. Histograms of the CC, gradient and FV maps were calculated. For repeat scans, the coefficient of variation (CoV) for each metric was computed using the median histogram values to assess repeatability.
Results
Figure 2 shows example CC and gradient maps for participants in each group using the VOLVE method; FV maps from PREFUL analysis are also shown. In healthy participants, lung parenchyma voxel CC values of >0.5 are predominant, whilst pulmonary vessel voxels are close to zero due to pulsatile flow through the slice at the cardiac (not respiratory) frequency. In patients with emphysematous lung disease, many lung parenchyma voxels tend to values <0.4.Figure 3 shows boxplots of the median values for the CC, gradient and FV for each group. Although subject numbers are small, we found a statistically significant (p<0.05 one-tailed, two-sample t-test) decrease in all three metrics in COPD and A1ATD compared to the control groups. Figure 4 shows the coefficient of variation of the median VOLVE and FV values. Summary box plots and scan-repeat-scan plots are shown to illustrate variability and repeatability.
Discussion
In contrast to PREFUL FV analysis, the CC/gradient maps from VOLVE analysis use signal from the whole respiratory cycle rather than being dominated by the signal from the peak and trough of the respiratory cycle.CC maps demonstrate the extent to which the signals from individual lung voxels linearly covary with the diaphragm navigator signal. In patients with COPD and A1ATD, a greater proportion of voxels show low correlation. We believe these voxels represent areas of alveolar hypoventilation that exhibit little or no variation in proton density during the respiratory cycle. In addition, negative correlation coefficient values in these patients may be indicative of paradoxical or delayed ventilation of poorly-ventilated lung segments due to expiratory flow limitation[7,8].
Low gradient values are indicative of smaller MR signal change through the respiratory cycle and so should correspond with areas of hypoventilation. If the percent change in navigator signal is assumed to be equivalent to the percent change in lung volume, then the gradient value represents the percent change in lung signal as a function of percent change in lung volume, which should be consistent between healthy individuals. Further work is ongoing to verify this assumption.
In healthy subjects all measures have good repeatability, but VOLVE demonstrates superior repeatability to PREFUL FV in patients with lung disease. This could be due to FV being overly-sensitive to peak inspiration and expiration signals, which can be influenced by irregular breathing patterns in patients with lung disease. This is overcome by VOLVE analysis as it uses data from the entire respiratory cycle. Some outlying CoV values in Figure 4 (COPD and A1ATD) correspond to cases where the mean value being considered is close to zero.
Conclusion
The proposed VOLVE parameters appear sensitive to emphysematous lung disease in this small pilot study. Further work is required to validate this methodology and explore its use to evaluate other respiratory diseases.Acknowledgements
The authors would like to thank Samal Munidasa and Prof Giles Santyr (The Hospital for Sick Children, University of Toronto) for the use of their PREFUL image processing pipeline, and Prof Alice Turner and Dr Anita Pye (University Hospitals Birmingham) for help in recruiting A1ATD participants. Ethics reference: 21/WA/0266.
References
1. Voskrebenzev et al. Feasibility of Quantitative Regional Ventilation and Perfusion Mapping with Phase-Resolved Functional Lung (PREFUL) MRI in Healthy Volunteers and COPD, CTEPH, and CF Patients. Magnetic Resonance in Medicine, vol. 79, no. 4, pp. 2306–2314 (2018)
2. Peggs et al. Variation in Proton Lung Signal with Ventilation at 3T [abstract]. In: Proceedings of the 31st Joint Annual Meeting of the ISMRM-ESMRMB & ISMRT; 2022 May 7-12; London, UK. Abstract # 1399.
3. Munidasa et al. Free-breathing MRI for Monitoring Ventilation Changes following Antibiotic Treatment of Pulmonary Exacerbations in Pediatric Cystic Fibrosis. European Respiratory Journal, vol. 57, no. 4 (2021)
4. Thirion. Image matching as a diffusion process: an analogy with Maxwell’s demons. Medical Image Analysis. Vol. 2, Number 3, 1998, pp. 243–260.
5. Kirby et al. Hyperpolarized 3He Magnetic Resonance Functional Imaging Semiautomated Segmentation. Academic Radiology vol. 19, no. 2, pp141–152 (2012)
6. York et al. Unified Equations for the Slope, Intercept, and Standard Errors of the Best Straight Line. American Journal of Physics, vol. 72, no. 3, pp. 367 (2004)
7. Marshall et al. 3He pO2 Mapping is Limited by Delayed-Ventilation and Diffusion in Chronic Obstructive Pulmonary Disease. Magnetic Resonance in Medicine, vol. 71, no. 3, pp. 1172–1178 (2014)
8. O'Donnell et al. Physiology and Consequences of Lung Hyperinflation in COPD. European Respiratory Review, vol. 15, no. 100, pp. 61–67 (2006)
Figures
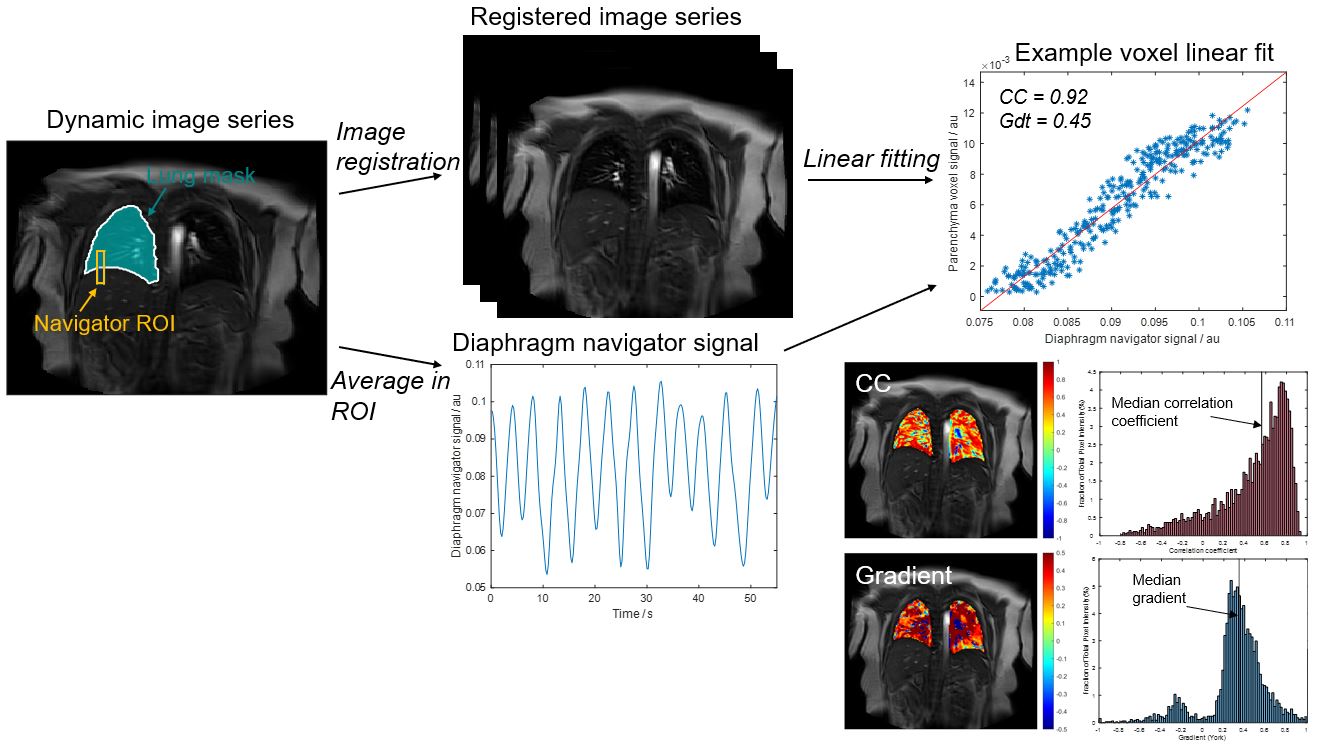
Figure 1: Overview of the image processing pipeline. The lung-diaphragm ROI (height 30 voxels and width 5 voxels) is automatically determined using the perimeter of the right lung mask as a guide for positioning. The signal in this ROI is averaged over the image time series to generate the diaphragm navigator signal. Linear fitting between this navigator signal and the registered lung parenchyma signal is carried out voxel-wise (VOLVE analysis). Representative correlation coefficient and gradient maps with corresponding histograms from VOLVE analysis are shown.
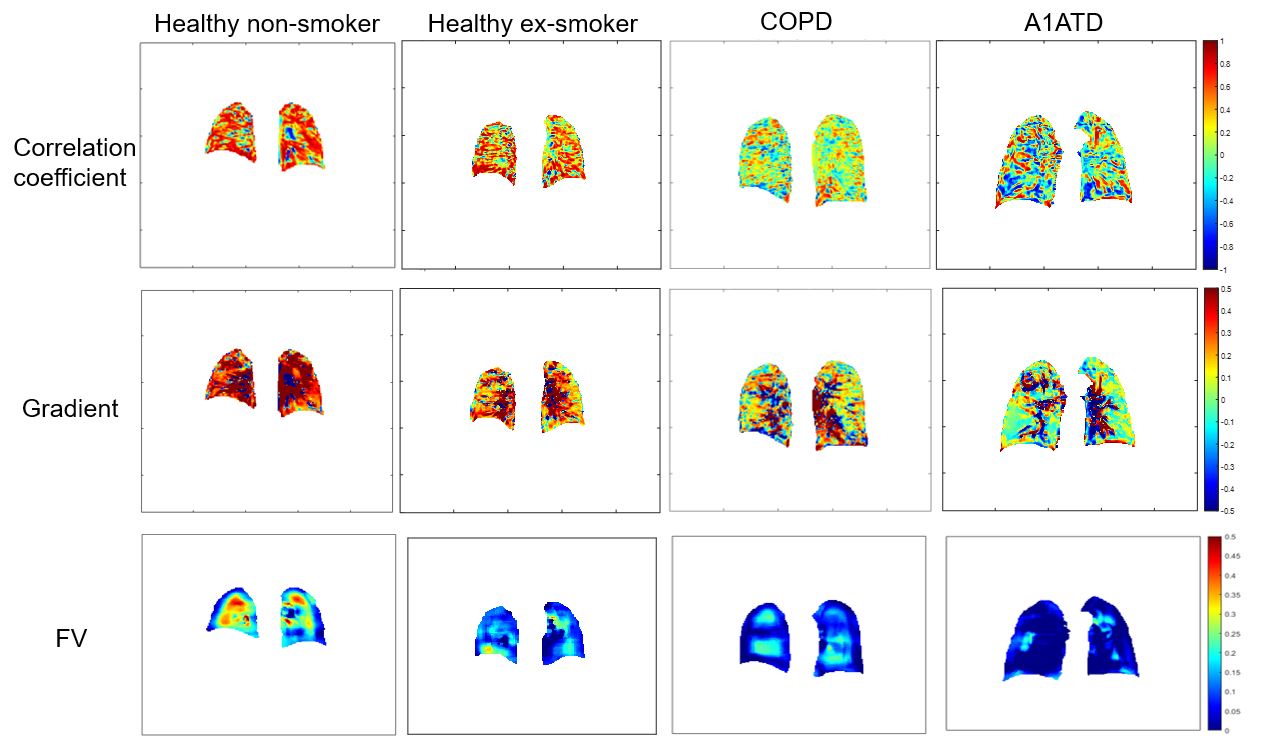
Figure 2: Example correlation coefficient (top row) and gradient (middle row) maps of the plot of lung parenchyma MR signal against lung-diaphragm navigator signal using VOLVE, and fractional ventilation from PREFUL (bottom row) for a healthy non-smoker, healthy ex-smoker (FEV1=104%), and patients with COPD (FEV1=40%) and A1ATD (FEV1=33%). Note the different scales.
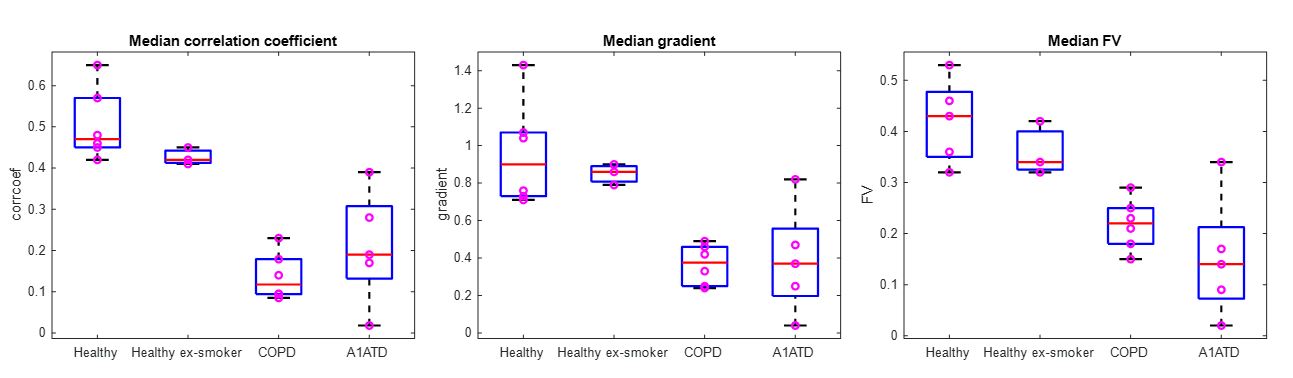
Figure 3: Boxplots showing median values for correlation coefficient, gradient and fractional ventilation for each group. Significant differences (p<0.05 one-tailed, two-sample t-test) between patients with lung disease and healthy controls are seen with all metrics.
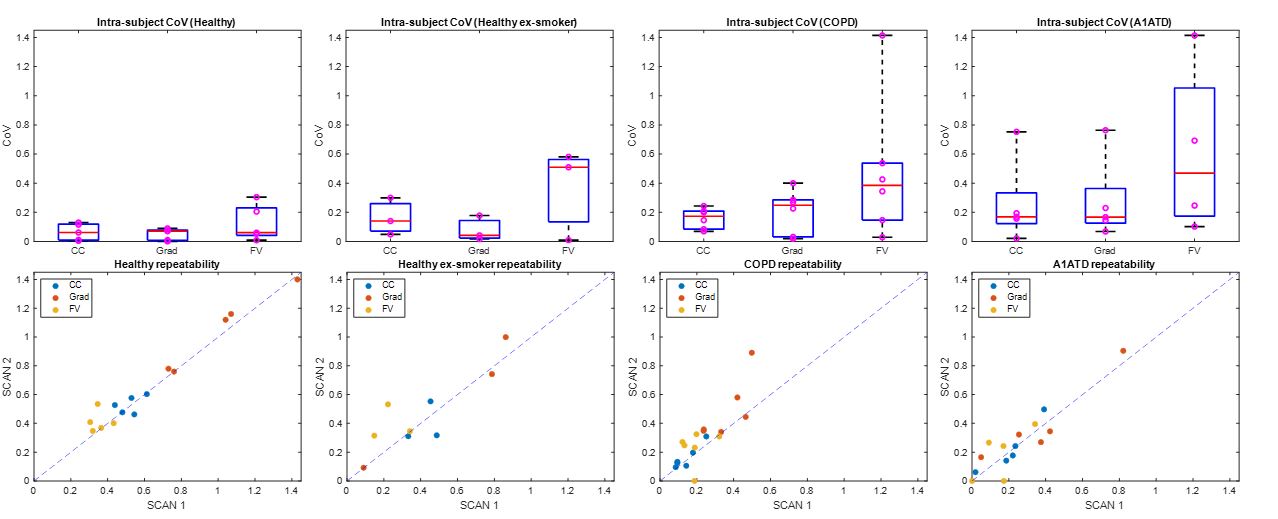
Figure 4: Boxplots showing the coefficient of variation (CoV) for median correlation coefficient, gradient and fractional ventilation for each group (top row). Plots of repeat values (with a y=x line for reference) provide an assessment of within-subject repeatability (bottom row).