4661
Investigating the Relationship between Lung Volume and the Lung-Diaphragm Signal at 3T: Implications for Ventilation Measures1Sir Peter Mansfield Imaging Centre, University of Nottingham, Nottingham, United Kingdom, 2NIHR Nottingham Biomedical Research Centre (BRC), Respiratory Medicine, School of Medicine, University of Nottingham, Nottingham, United Kingdom
Synopsis
Keywords: Lung, Data Analysis, COPD
The relationship between lung volume and lung MR signal is key to quantifying ventilation using 1H MRI. This relationship was probed using a highly accelerated 3D FFE acquisition at 3T. Linear regression between the percentage change in lung-diaphragm navigator signal and lung volume showed that the relationship between these parameters was not always linear, especially in patient groups. Polynomial regression was used to assess the extent of the hysteresis between inspiration and expiration, with more hysteresis observed in chronic obstructive pulmonary disease (COPD) patients.
Introduction
Free-breathing functional proton MRI of the lung has recently shown promise[1,2]. However, most methods use single slice datasets which provide limited information about changes in the size/shape of the lung across the respiratory cycle. Fast volumetric monitoring of the lung allows the detailed study of variations in lung/diaphragm morphometry with respiration, and how this is impacted by disease.Understanding dynamic volumetric data will allow more systematic analysis of regional fractional ventilation (FV) maps based on variations in proton density signal, as performed in PREFUL/FD analysis[1,2]. For FV analysis, a region of interest (ROI) overlapping the diaphragm and lung parenchyma is often used to generate a navigator signal time course which provides a surrogate for the change in lung volume to indicate the phase of respiration. FV measurements are underpinned by the assumption that lung volume is related linearly to this navigator signal[3]. However, this assumption must be confirmed, particularly in patient groups who may have altered diaphragmatic movement (e.g. hyperinflated chronic obstructive pulmonary disease (COPD) patients). Lack of knowledge of the proportionality constant between the navigator signal and lung volume may be a confounder in the comparison of FV values between individuals.
This work aims to dynamically image lung volume across respiratory cycles, to (1) monitor dynamic changes in lung morphometry and (2) investigate the relationship between lung volume changes and the lung-diaphragm navigator signal.
Methods
People with COPD (n=11, of which n=5 diagnosed with alpha-1 antitrypsin deficiency (A1ATD)) were recruited, along with “healthy” ex-smokers (>10 pack-years smoking history) (n=3). All participants underwent 1H MRI on a 3T Philips Ingenia scanner. A dynamic 3D Fast Field Echo acquisition (12 coronal slices, spatial resolution 1.8x1.8x14mm3, TR/TE=1.9/0.58ms) was accelerated by compressed sensing (CS-factor=10) to achieve a dynamic scan time of 3.3 images/second. 400 dynamic images were acquired during 137 s of free-breathing.Image analysis was performed using custom-written scripts in MATLAB (Figure 1). The lungs were segmented using a semi-automatic Chan-Vese active contours algorithm to determine a lung volume time course throughout tidal breathing[4]. The lung-diaphragm navigator signal was calculated by averaging the MR signal in a manually segmented ROI spanning the right hemidiaphragm and peripheral right lung of a central slice. Lowpass filtering (0.6 Hz) was applied to both time courses to remove cardiac signal fluctuations. The segmented lung volume and the lung-diaphragm signal were expressed as a percentage change relative to full expiration. A linear least-squares fit was performed on all time points to determine the gradient between lung volume and navigator signal, assuming a linear model.
Since in some cases the data demonstrated hysteresis, datapoints were characterised as either inspiration or expiration by the sign of the instantaneous gradient of the lung volume timeseries. Polynomial regression was performed separately for inspiration and expiration datapoints, and the difference in lung-diaphragm navigator signal at 50% lung volume between maximum inspiration and expiration during tidal breathing (representing functional residual capacity (FRC) plus half tidal volume) computed to assess the extent of hysteresis.
Results
Figure 2 shows the gradient from the linear least-squares fit between lung-diaphragm signal and segmented lung volume. A gradient of -1 corresponds to an equal percentage change between lung-diaphragm signal and lung volume.Figure 3A shows an example plot showing the separation of inspiration and expiration phases for a participant with COPD, with corresponding polynomial fits for all subjects shown in Figure 3B. Figure 4 shows the difference in lung-diaphragm signal at 50% lung volume between inspiration and expiration during tidal breathing, derived from the hysteresis fits. Median values close to zero are observed in all groups, with notable outliers in the COPD group.
Discussion
Figure 2 shows that the navigator signal does not accurately reflect the change in lung volume, especially in patient groups. The healthy group has a median gradient close to -1, but this deviates in some participants, particularly patients. In this situation, use of the diaphragm signal when determining FV could result in mis-characterisation of volume changes, leading to variability in the estimates of regional ventilation. Figure 3 shows that assuming a linear relationship is inaccurate in some participants, and that the direction of hysteresis can also be variable.In obstructive lung disease, conventional pressure/volume hysteresis loops are widened by a combination of airflow obstruction, decreased lung compliance, positive end-expiratory pressure and expiratory flow limitation. This results in shallow pressure/volume gradients during tidal breathing and in cases of more severe disease, active expiration is then required to complete the expiratory manoeuvre[5]. In the MRI data, the extreme hysteresis observed in one COPD subject may represent this effect. However, this was not demonstrated in other patients and further work is required to determine how this MRI-derived measure of hysteresis relates to conventional pressure/volume loops.
These results may also be impacted by the arbitrary choice of end-expiration as the reference point from which to calculate the percentage change; median lung volume may be a more appropriate choice to characterise relative signal change.
Conclusion
The presented methodology could be used to determine a correction factor to convert the navigator signal to lung volume for more accurate and repeatable analysis of 1H lung ventilation, and itself be a functional biomarker of diaphragmatic mechanics.Acknowledgements
The authors would like to thank Prof Alice Turner and Dr Anita Pye (University Hospitals Birmingham) for help in recruiting A1ATD participants. Ethics reference: 21/WA/0266.
References
1. Voskrebenzev et al. Feasibility of Quantitative Regional Ventilation and Perfusion Mapping with Phase-Resolved Functional Lung (PREFUL) MRI in Healthy Volunteers and COPD, CTEPH, and CF Patients. Magnetic Resonance in Medicine, vol. 79, no. 4, pp. 2306–2314 (2018)
2. Bauman et al. Non-contrast-enhanced perfusion and ventilation assessment of the human lung by means of Fourier decomposition in proton MRI. Magnetic Resonance in Medicine, vol. 62, no. 3, pp. 656–664 (2009)
3. Zapke et al. Magnetic resonance lung function – a breakthrough for lung imaging and functional assessment? A phantom study and clinical trial. Respiratory Research, Volume 7, Issue 1, pp. 1-9 (2006)
4. T. F. Chan, L. A. Vese. Active contours without edges. IEEE Transactions on Image Processing, Volume 10, Issue 2, pp. 266-277 (2001)
5. Papandrinopoulou et al. Lung compliance and chronic obstructive pulmonary disease. Pulmonary Medicine, 542769 (2012)
Figures
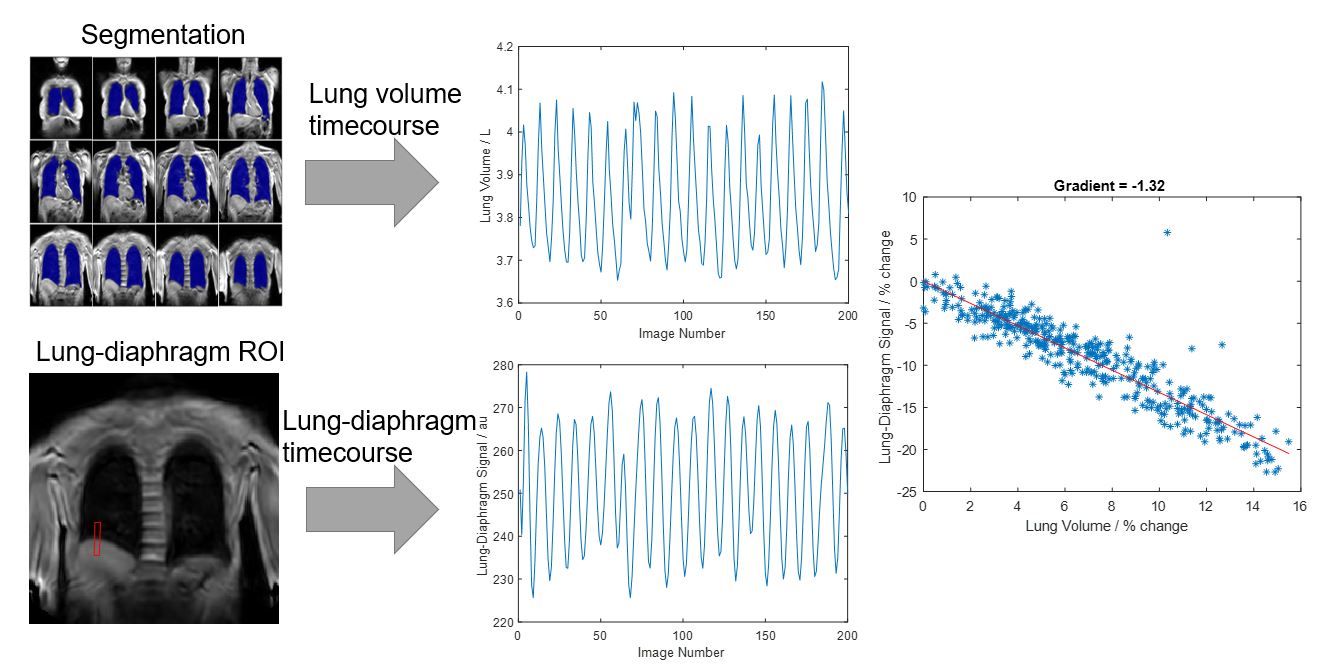
Figure 1: Overview of image analysis pipeline. A lung volume time course is generated by segmentation of a 3D scan with full-lung coverage dynamically acquired during free breathing. A lung-diaphragm time course is generated by averaging MR signal in a lung-diaphragm ROI. A scatter plot of the percentage change in these metrics is computed, and a linear least-squares fit performed to determine the gradient.

Figure 2: Boxplot showing the gradient of percentage change in lung-diaphragm signal versus lung volume for healthy ex-smokers, COPD and A1ATD.
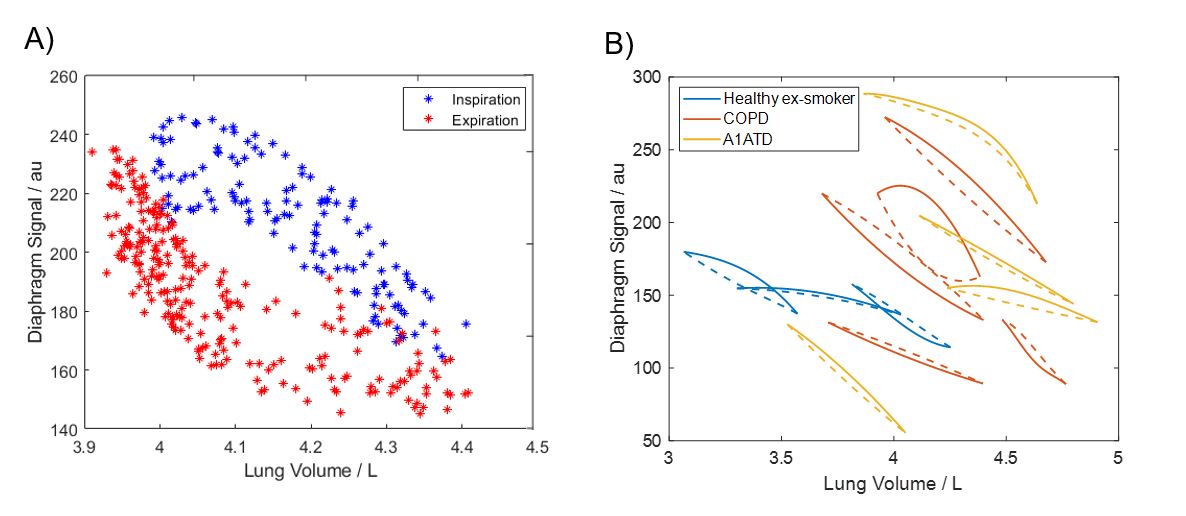
Figure 3: A) Example scatter plot of inspiration-expiration hysteresis for a participant with COPD. B) Plot of polynomials fits (quadratic and quartic) between lung-diaphragm signal and lung volume for each participant. Fits to inspiration datapoints are shown in solid lines and expiration with dotted lines.
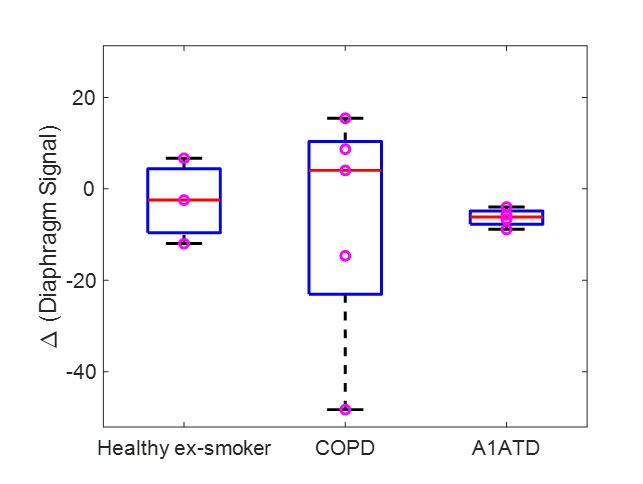
Figure 4: Boxplot showing the difference in diaphragm signal at 50% lung volume between inspiration and expiration during tidal breathing, derived from polynomial fitting to hysteresis.