4660
129Xe MRS Gas-Exchange Abnormalities in Poorly-controlled Asthma
Alexander M Matheson1, Marrissa J McIntosh1, Narinder Paul2, Anurag Bhalla3, Cory Yamashita3, and Grace Parraga1,2,3
1Medical Biophysics, Robarts Research Institute, Western University, London, ON, Canada, 2Department of Medical Imaging, Western University, London, ON, Canada, 3Division of Respirology, Department of Medicine, Western University, London, ON, Canada
1Medical Biophysics, Robarts Research Institute, Western University, London, ON, Canada, 2Department of Medical Imaging, Western University, London, ON, Canada, 3Division of Respirology, Department of Medicine, Western University, London, ON, Canada
Synopsis
Keywords: Lung, Hyperpolarized MR (Gas)
Large and small airway-wall and lumen abnormalities and occlusion are hallmark findings in asthma, but pathologic abnormalities have also been reported in the pulmonary vasculature. 129Xe MR-spectroscopy provides a way to quantify 129Xe gas in the airways and as it diffuses through the alveolar tissue-membrane and binds to red-blood-cells in the pulmonary capillaries. Static and dynamic 129Xe MR-spectroscopy were undertaken in participants with poorly controlled asthma in whom there was significantly different 129Xe MR RBC:membrane ratio compared to healthy-volunteers. Cardiopulmonary oscillations were observed in all 129Xe compartments; the oscillation amplitude in the gas-compartment was related to oscillometry airways impedance measurements.PURPOSE:
In patients with asthma, lung findings include airway wall thickening, airway lumen obstruction and airway wall smooth muscle dysfunction. Other abnormalities have been observed, including collagen deposits in alveolar walls in uncontrolled asthma1 and pulmonary vascular pruning.2 129Xe MRS can probe the alveolar-capillary interface where these abnormalities may be occurring by measuring the spectral properties of 129Xe dissolved in the alveolar membrane and bound to red-blood-cells (RBC). The temporal variability of the RBC and alveolar membrane 129Xe MRS signal, referred to as cardiogenic oscillations, are thought to be driven by blood pulsation.3 Investigations in patients with interstitial lung disease (ILD) and chronic obstructive pulmonary disease (COPD) have uncovered RBC:membrane signal differences and oscillation amplitude differences compared to healthy participants.4 Similar investigations have not been undertaken in patients with asthma, in whom both airways disease and pulmonary vascular pruning has been demonstrated. Therefore, we endeavored to examine both static and dynamic spectroscopy measurements in people with asthma and to compare them with clinical and pulmonary function test measurements.METHODS:
Participants:Participants with severe asthma were recruited from a quaternary care Asthma clinic and provided written informed consent to an approved protocol (NCT02351141 or NCT 03733535) to undertake pulmonary function tests, oscillometry, thoracic CT, 129Xe MRI, and static and dynamic MRS. Healthy volunteers were recruited from the local general population and performed static and dynamic MRS. Participants were coached to inhale 1.0 L of gas (1/5 mixture by volume of 129Xe/4He) from functional residual capacity.
Data Acquisition:
Pulmonary function tests were performed using a MedGraphics Elite Series plethysmograph (MGC Diagnostics Corporation). Oscillometry measurements were acquired using a TremoFlo C-100 Airwave Oscillometer (Thorasys) at multiple frequencies and reported at 5 and 19Hz frequencies.
MRI and MRS were acquired using a whole-body 3.0T Discovery MR 750 system (General Electric Healthcare, USA) with broadband imaging capabilities and a flexible vest transmit-receive coil (Clinical MR Solutions, USA). 129Xe MRS was obtained using a whole-lung free-induction-decay sequence (500 spectra, TR-15ms, TE=0.7ms, flip=40o, BW=31.25kHz, 600μs 3-lobe Shinnar-Le Roux pulse). 129Xe ventilation MRI were acquired with a fast spoiled gradient recalled echo sequence (TR=3.8ms, TE=1.0ms, flip angle=7o, FOV=40x40cm2; BW=48.8kHz; matrix=128x80 zero-padded to 128x128; number of slices=15-18, slice thickness=15mm).
Data Analysis:
129Xe MRS peaks were fit to a three-component Lorentzian model in Matlab (2021a, Mathworks) to determine component magnitude, phase, and frequency. Each peak was then fit to sinusoids to measure cardiogenic oscillations in peak magnitude, phase and chemical shift. Oscillations were normalized to peak height at start time. RBC:membrane ratio was calculated as the ratio of RBC area-under-the-curve and membrane area-under-the-curve.
RESULTS:
21 participants with asthma (age=60±15, 18/21 female) and 16 healthy volunteers (age=37±17 years, 5/16 female) were enrolled. Table 1 shows participant demographic, pulmonary function test, imaging and MRS measurements for healthy volunteers and participants with asthma. RBC:membrane and RBC:Gas measurements were significantly lesser in participants with asthma (0.29±0.08) compared to healthy volunteers (0.44±0.09, p<.001), however there was no significant difference in membrane:gas (healthy=0.93±0.26, asthma=0.94±0.18, p=.93). Figure 1 shows representative dynamic spectroscopy waterfall plots in a healthy volunteer and a participant with asthma. In addition to previously described RBC oscillations, we observed oscillations in the membrane and gas signals in both healthy volunteers and participants with asthma. There were no significant differences between oscillation amplitudes in healthy participants (12±5%) and participants with asthma (15±12%, p=.33), however there were significantly greater phase oscillations in all three 129Xe compartments. Figure 2 shows RBC:membrane correlated with age in both healthy volunteers (r=.67, p=.008) and participants with asthma (r=.52, p=.02), however asthma measurements were lesser across ages. Gas oscillation amplitudes were correlated with airway oscillometry measurements.DISCUSSION:
The RBC:membrane ratio was diminished in participants with asthma independent of age. These changes appeared to be driven by RBC abnormalities, as there was no difference in membrane:gas signal observed. We also observed significant differences between RBC and membrane resonant frequencies, however the magnitude of these differences was small. These differences may have been due to differences in the mean age and sex distribution between the healthy and asthma subgroups or because of pathophysiology inherent in long-standing severe asthma. We also observed cardiopulmonary oscillations in both the membrane and gas compartments. Gas oscillations were related to airway oscillometry measurements of airway resistance and reactance, suggesting that this may be related to gas redistribution in the airways as the heart muscle contraction compressed surrounding elastic tissue. There were no significant differences between amplitude oscillations, however there were significant differences in phase oscillations.CONCLUSIONS:
To our knowledge, this is the first report in asthma of 129Xe MR RBC:membrane ratio abnormalities alongside abnormalities in RBC:gas ratio but not the membrane:gas ratio. Taken together, these findings suggest that this specific gas-exchange abnormality originates in the pulmonary vasculature, not the alveolar wall tissue and that asthma patholophysiologic abnormalities involve the pulmonary capillaries. We also observed cardiogenic oscillations in the gas component which may stem from cardiac muscle contraction and its compression of surrounding lung tissue.Acknowledgements
No acknowledgement found.References
1. Weitoft, M, et al. Respir Res 2014.
2. Ash, SY, et al. Am J Respir Crit Care Med 2018.
3. Bier, EA, et al. NMR Biomed 2019.
4. Wang, Z, et al. Eur Respir J 2019.
Figures
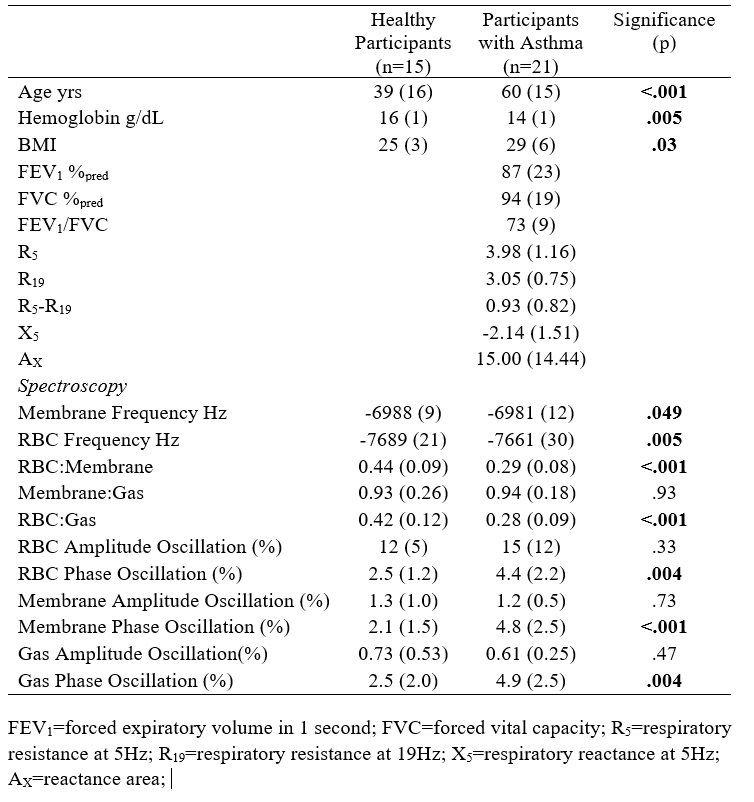
Participant demographic, spirometry and spectroscopy measurements.
FEV1=forced expiratory volume in 1 second; FVC=forced vital capacity; R5=respiratory resistance at 5Hz; R19=respiratory resistance at 19Hz; X5=respiratory reactance at 5Hz; AX=reactance area;
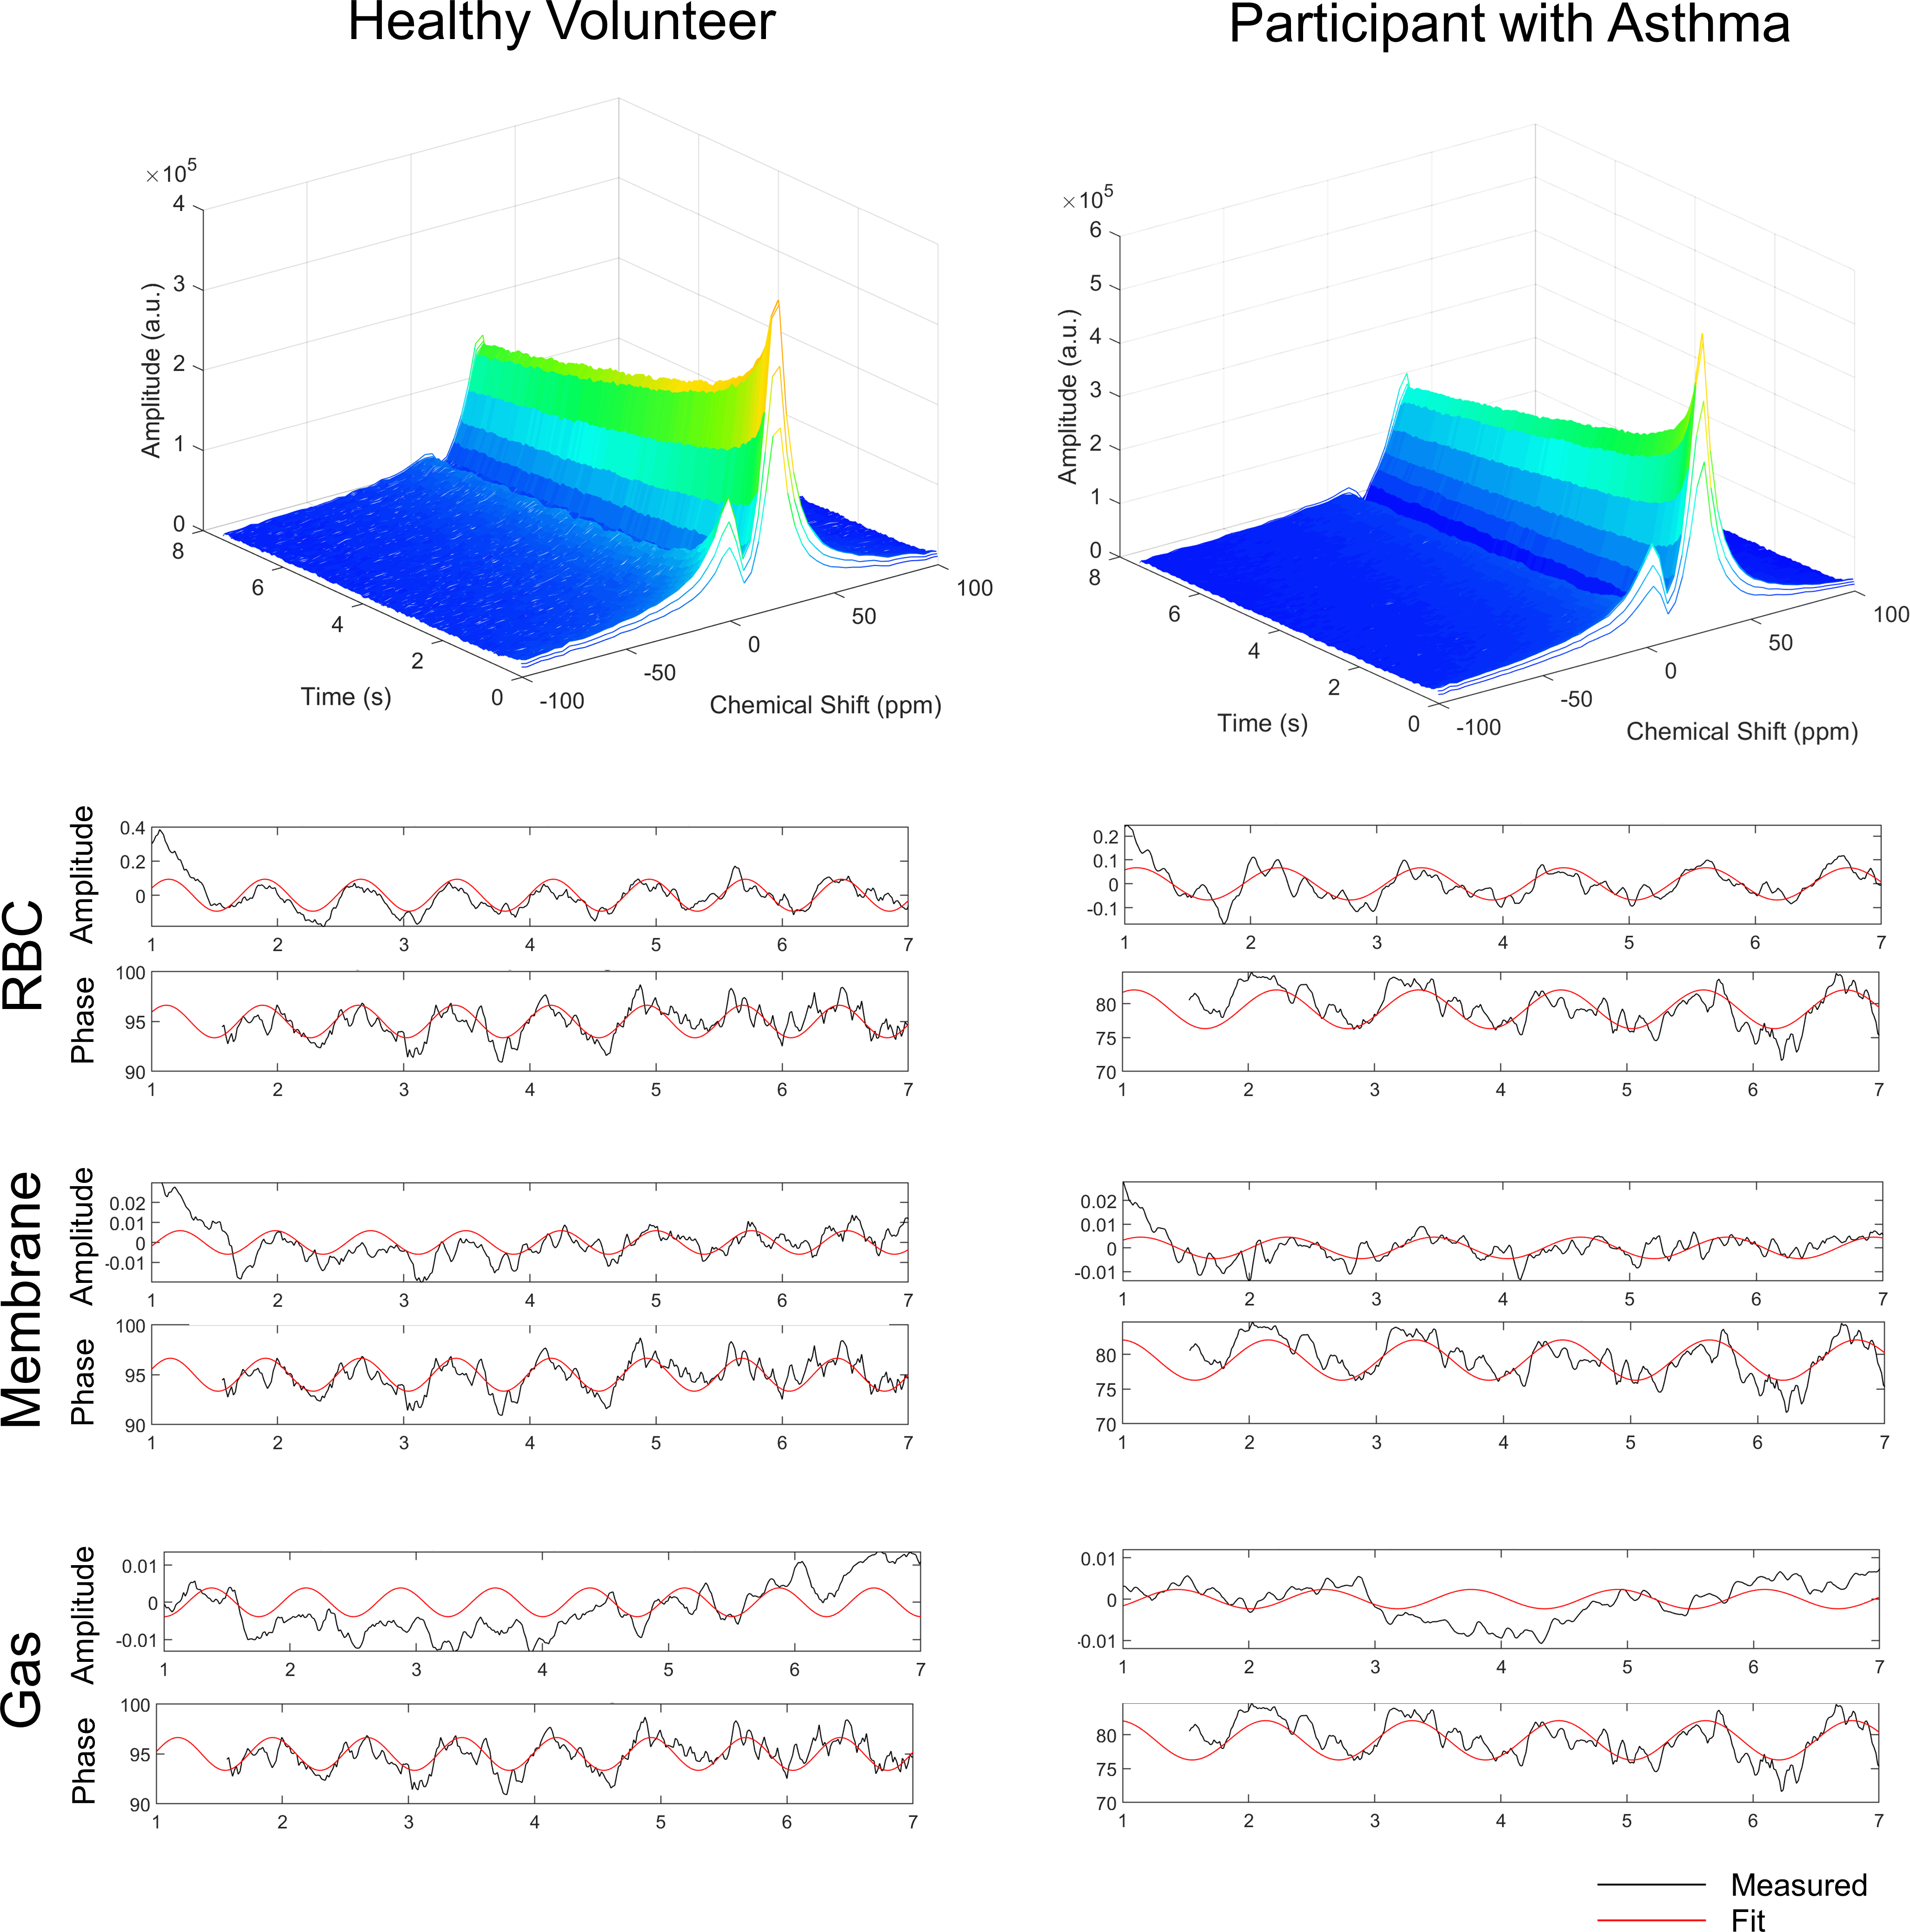
Representative oscillations for a healthy participant and a participant with asthma. Waterfall plots show oscillations in RBC and membrane compartments. Oscillations were observed in all three compartments: RBC, membrane, and gas.
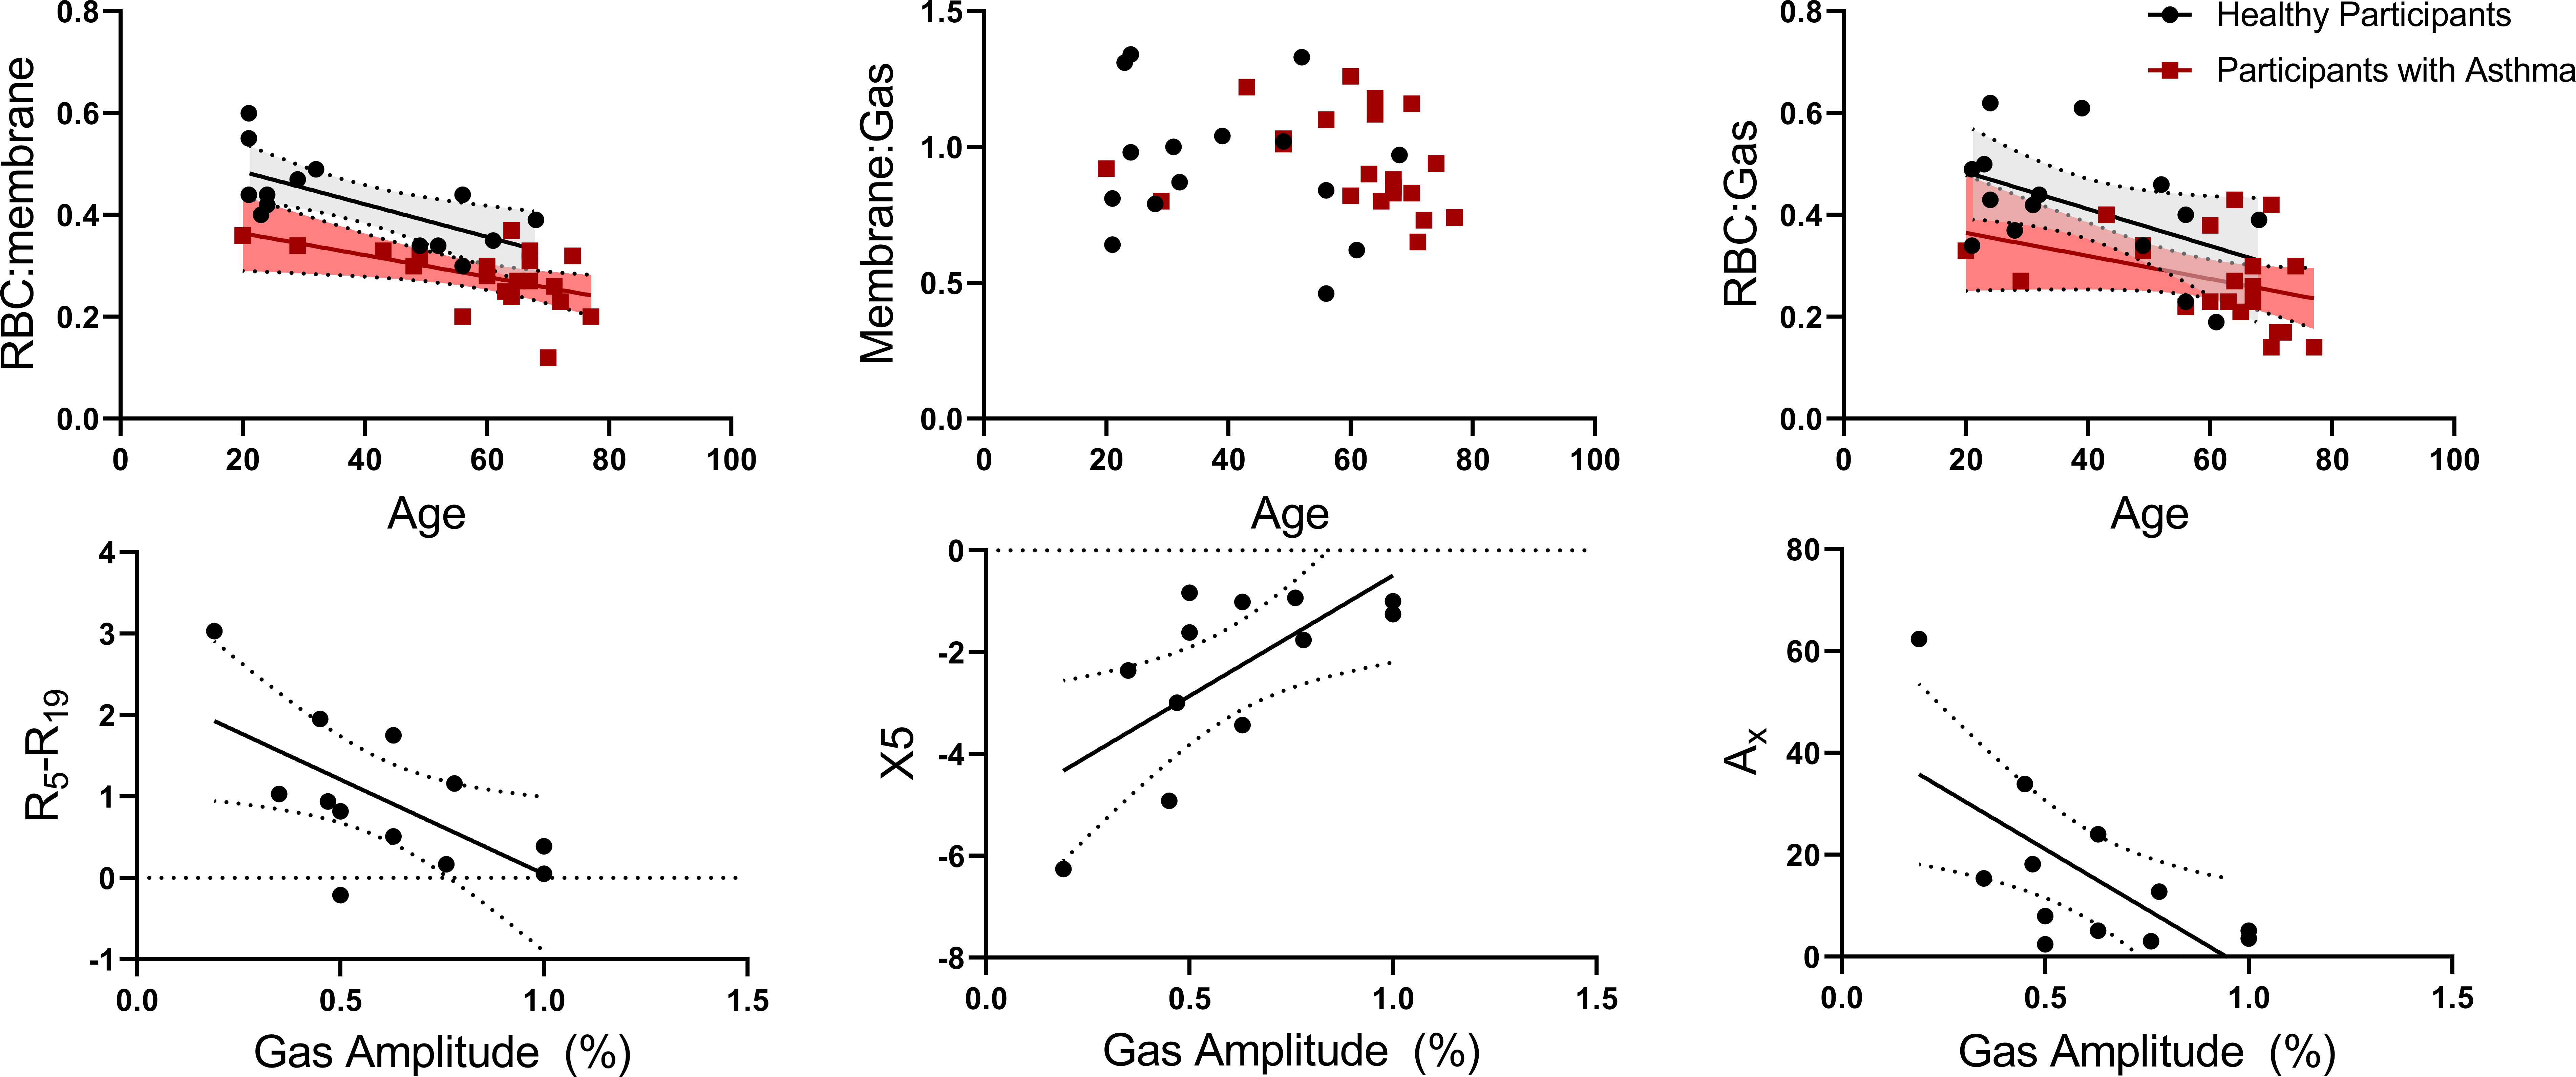
Static and dynamic MRS relationships. Top: RBC:membrane correlated with age for both healthy participants (r=.67, p=.008) and participants with asthma (r=.52, p=.02). RBC:Gas trended toward a correlation for both groups (healthy: r=.50, p=.06 asthma: r=.37, p=.09) but membrane:Gas did not (healthy:p=.43, asthma:p=.35). Bottom: Gas amplitude oscillations correlated with airway oscillometry measurements: R5-R19 (r=.62, p=.03), X5 (r=.67, p=.02) and AX (r=.67, p=.02).
DOI: https://doi.org/10.58530/2023/4660