4659
High resolution pulmonary imaging on a commercial 0.55T MRI scanner1National Institutes of Health, Bethesda, MD, United States, 2Siemens Medical Solutions USA Inc, Malvern, PA, United States, 3MR Application Predevelopment, Siemens Healthcare GmbH, Erlangen, Germany
Synopsis
Keywords: Lung, Lung
We determined the feasibility of diagnostic high resolution pulmonary imaging on a commercial 0.55T scanner and compared the image quality to a ramped down prototype 0.55T scanner. 0.55T scanners can improve accessibility of MRI, due to their lower cost, ease of installation, and wider bore geometry. Previously, we showed robust pulmonary imaging at 0.55T using a prototype scanner with high performance gradients. In this work, we leverage our robust self-gated, concomitant and motion corrected reconstruction pipeline to enable diagnostic pulmonary imaging on a commercial 0.55T scanner with lower gradient performance.Introduction
We recently demonstrated a stack-of-spirals ultra-short echo-time (UTE) method for pulmonary imaging with 1.75mm isotropic resolution on a prototype 0.55T scanner with high-performance gradients1. 0.55T MRI has the potential to improve accessibility due to reduced cost, easier installation requirements, and amenable bore geometry. Pulmonary MRI is particularly of interest since 0.55T offers reduced susceptibility gradients and longer T2*, thereby permitting high quality imaging2.Recently, Siemens released a commercial FDA-cleared 0.55T MRI system, which uses lower gradient performance and different coils compared to our ramped-down prototype. In this study, we determine the feasibility of robust pulmonary imaging on the commercial 0.55T and compare the image quality to our ramped down 0.55T prototype scanner.
Methods
Data Acquisition: A free-breathing 3D UTE spoiled gradient echo stack of spiral research application sequence1 was used for imaging on two Siemens MRI systems (Siemens Healthcare, Erlangen, Germany) : 1) commercial 0.55T (MAGNETOM Free.Max) with gradient peak slew rate: 40 mT/m/s and max amplitude: 25 mT/m, and 2) prototype 0.55T (MAGNETOM Aera) with standard higher-performance gradients peak slew rate: 180 mT/m/s, and max amplitude: 45 mT/m. All scans acquired 611 golden-angle increments of spiral interleaves.Data was acquired with 4 sets of imaging parameters (referred to parameter setting 1,2,3,4) shown in Table 1. Total acquisition time was 11 min and 15 min for 1.75 mm and 1.40 mm isotropic resolution, respectively. A 77, and 97 spiral shot design was used for Free.Max and 33, and 57 spiral shot design was used for the 0.55T Aera to achieve isotropic resolutions of 1.75 and 1.4 mm, respectively. Additional data were acquired on the prototype 0.55T Aera, with similar settings as the Free.Max to control for other hardware differences between scanners.
Reconstruction: Data was reconstructed using a previously published iterative concomitant field and motion corrected reconstruction (iCoMoCo)3. Briefly, concomitant-fields were corrected using multi-frequency interpolation (MFI) within the reconstruction4,5. MFI was performed by demodulating each spiral acquisition at eight frequencies and two frequencies for data acquired using the ramped down 0.55T Aera (higher gradient settings) and Free.Max, respectively. A pixel-wise linear combination of the images was then used to estimate the corrected image4,5.
Data was reconstructed inline using Gadgetron6 on a system equipped with Dual AMD EPYC processors, 1 TB RAM, 4x Nvidia A100 GPUs. The reconstruction was optimized to use GPUs to minimize reconstruction time. Inaccuracies in spiral trajectories were corrected using gradient system impulse response functions which were estimated for both scanners7,8.
Patient imaging: Imaging of human subjects was performed with permission from the local Institutional Review Board. We performed this comparison in two healthy volunteers (HV) imaged on the Free.Max followed immediately by the prototype 0.55T Aera. We also cropped the data to simulate shorter scan durations of 2, 4, 6, 8, and 10 min in one HV to compare the image quality with higher under sampling factors and to explore the feasibility of reducing scan times. Apparent SNR (aSNR) was measured in the parenchyma for each setting.
Results
The reconstruction times for parameter settings 1,2,3, and 4 (Table 1) were less than 6, 12, 15, and 25 min after the end of scan, respectively. Reconstruction times were longer for higher resolution imaging, as expected, and higher gradient settings which required a larger number of bins for multi-frequency interpolation to do concomitant field correction in the iCoMoCo reconstruction.Figure 1 and 2 show the image quality for 1.75- and 1.4-mm isotropic resolution, respectively. The image quality on the Free.Max is comparable to the ramped down 0.55T Aera with both the lower and higher gradient setting. Parenchymal aSNR was also similar for the two scanners; 7.55±0.73, 6.23±0.43, and 5.52±2.08 for 1.75 mm resolution and 2.98±0.48, 3.35±0.74, and 3.29±0.15 for 1.4 mm resolution for Free.Max, 0.55T Aera (low gradient setting), and 0.55T Aera (high gradient setting), respectively.
Figure 3 and 4 compares image quality using simulated scan times of 2, 4, 6, 8, and 10 min for 1.75- and 1.4-mm isotropic resolution. The images appear sharper on the Free.Max and 0.55T Aera with lower gradient settings as compared to the 0.55T Aera with higher gradient settings. Our methods can achieve diagnostic image quality in about 4 min for 1.75 mm isotropic resolution and 6 min for 1.4mm isotropic resolution on both the Free.Max and 0.55T Aera scanners.
Discussion
High resolution pulmonary imaging is feasible on the commercial 0.55T scanner with lower gradient specifications. Generally, higher gradient peak amplitudes can cause heating related drift in center frequency which can cause blurring in spiral images. This can likely explain the sharper images acquired using lower gradient settings. Using lower gradient performance may make imaging susceptible to under sampling artifact, however we did not observe this in our preliminary study. The data acquired using the lower gradients also reconstructed in half the time, since fewer bins can be used for MFI during concomitant-field corrections. Shorter reconstruction times can enable a better clinical workflow.Conclusion
We showed the feasibility of high-resolution pulmonary imaging using a commercial 0.55T scanner. In the future, we will determine the feasibility of using this scanner for perfusion and dynamic imaging applications where higher performance gradients may be more favorable.Acknowledgements
The authors thank Christine Mancini, Haiyan Wang, and Amanda Potersnak for their imaging expertise and Scott Baute, and Amelia Nargozian for assistance with patient recruitment. The authors would like to acknowledge the assistance of Siemens Healthcare in the modification of the MRI system for operation at 0.55T under an existing cooperative research agreement (CRADA) between NHLBI and Siemens Healthcare. This work was supported by the NHLBI DIR (Z01-HL006257).
References
- Javed A, Ramasawmy R, O’Brein K, et al. Self-gated 3D Stack-of-Spirals Ultra-Short Echo-Time Pulmonary imaging at 0.55T. Magn Reson Med. 2021.
- Campbell-Washburn, A. E., Ramasawmy, R., et al. Opportunities in interventional and diagnostic imaging by using high-performance low-field-strength MRI. Radiology 2019, 293(2), 384–393.
- Javed A, Ramasawmy R et al. Improved 3D stack-of-spiral UTE pulmonary imaging at 0.55T using iterative concomitant field and motion corrected reconstruction (iCoMoCo). Proc. ISMRM 30th Scientific Session, Virtual conference, May 2022.
- King KF, Ganin A, Zhou XJ, Bernstein MA. Concomitant gradient field effects in spiral scans. Magn Reson Med. 1999;41(1):103-112.
- Man LC, Pauly JM, Macovski A. Multifrequency interpolation for fast off-resonance correction. Magn Reson Med. 1997;37(5):785-792.
- Hansen MS, Sørensen TS. Gadgetron: An open source framework for medical image reconstruction. Magn Reson Med. 2013;69(6):1768-1776.
- Vannesjo SJ, Graedel NN, Kasper L, et al. Image reconstruction using a gradient impulse response model for trajectory prediction. Magn Reson Med. 2016;76(1):45-58.
- Campbell-Washburn AE, Xue H, Lederman RJ, Faranesh AZ, Hansen MS. Real-time distortion correction of spiral and echo planar images using the gradient system impulse response function. Magn Reson Med. 2016;75(6):2278-2285.
Figures
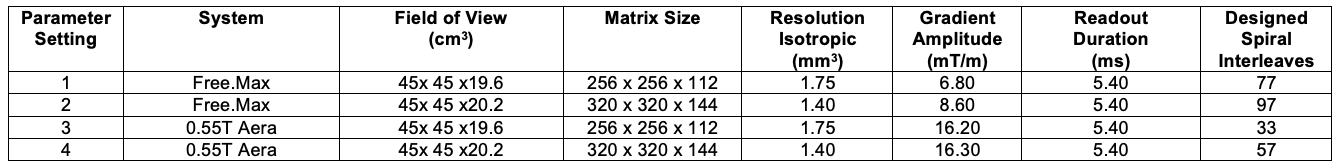

Figure 1: Image quality comparison for 1.75 mm resolution in two healthy volunteers for scan time of 8 min. (left) Images from Free.Max, (center) 0.55T Aera with lower gradient setting, and (right) 0.55T Aera with higher gradient setting. Red arrows point to a vessel which appears sharper for the Free.Max and 0.55T Aera with lower gradient settings. Green boxes highlight a region outside the lungs where under sampling artifacts can be seen in the images from Free.Max. Yellow circle is ROI where aSNR was estimated to be (left) 7.55±0.73, (center) 6.23±0.43, and (right) 5.52±2.08.
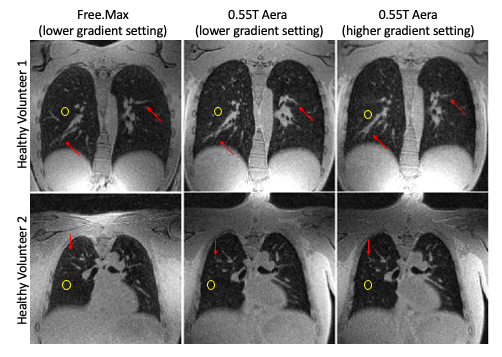
Figure 2: Image quality comparison for 1.4 mm isotropic resolution in two healthy volunteers for scan time of 10 min. (left) Images from Free.Max, (center) 0.55T Aera with lower gradient setting, and (right) 0.55T Aera with higher gradient setting. Red arrows point to a vessel which appears sharper for the Free.Max and 0.55T Aera with lower gradient settings. Yellow circle is ROI where aSNR was estimated to be (left) 2.98±0.48, (center) 3.35±0.74, and (right) 3.29±0.15.
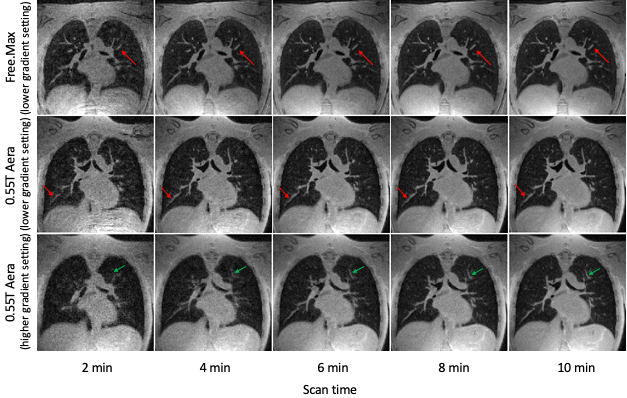
Figure 3: Comparison of image quality at 1.75 mm isotropic resolution between Free.Max and Aera for scan times of 2, 4, 6, 8, and 10 min. (top) Images from Free.Max, (center) 0.55T Aera with lower gradients settings, and (bottom) 0.55T Aera with higher gradient specifications. Red arrows point to a vessel which become less visible for scan times < 4 min. Green arrows point to image features which appear less sharp in 0.55T Aera using a sequence with higher gradient settings.
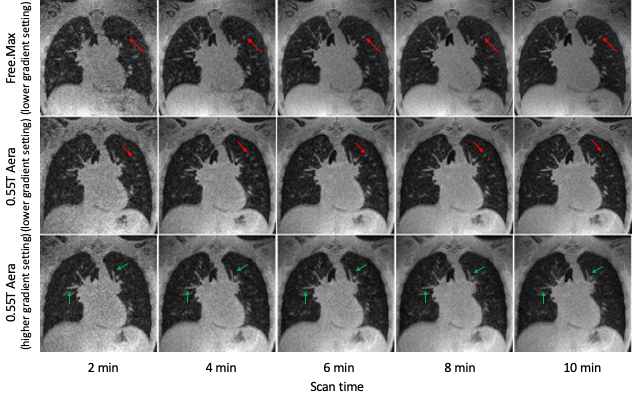
Figure 4: Comparison of image quality at 1.40 mm isotropic resolution between Free.Max and Aera for scan times of 2, 4, 6, 8, and 10 min. (top) Images from Free.Max, (center) 0.55T Aera with lower gradients settings, and (bottom) 0.55T Aera with higher gradient specifications. Red arrows point to a vessel which become less visible for scan times < 6 min. Green arrows point to image features which appear less sharp in 0.55T Aera using a sequence with higher gradient settings.