4654
Fast SMWI via denoising for nigral hyperintensity detection in Parkinson’s disease1Seoul National University, Seoul, Korea, Republic of, 2Heuron Co.Ltd., Incheon, Korea, Republic of, 3Radiology, Samsung Medical Center, Seoul, Korea, Republic of
Synopsis
Keywords: Image Reconstruction, Parkinson's Disease
Nigral hyperintensity detection in substantia nigra is a potential biomarker for PD. An advanced SWI method, SMWI, has demonstrated reliable detection of the hyperintensity at 3T but it requires a 4 m 15 s scan protocol which is too long for PD patients, suffering from motion artifacts. In this study, we developed a new 2 m 56 s protocol by reducing phase FOV and applying deep learning-powered denoising to compensate for SNR loss from the shorter scan. The new protocol was validated using both simulated and real data via an automated tool and an expert radiologist.Introduction
Susceptibility map-weighted imaging (SMWI) is an advanced susceptibility weighted imaging (SWI) method that enhances the visibility of nigral hyperintensity in substantia nigra (SN), which is considered as a biomarker for Parkinson’s disease (PD)1. The current protocol of SMWI for nigral hyperintensity (3T; 0.5 x 0.5 x 1 mm3; 4 min 15 sec) has been demonstrated to distinguish PD vs. control in high sensitivity and specificity by human experts and a deep learning tool3, 4. However, 4 min 15 sec is a long scan time for PD patients who often have unwanted motion during the scan, introducing artifacts in the SMWI images. To overcome this issue, we developed and validated a new protocol that only takes 2 min and 56 s. To achieve this scan time, we reduced the phase FOV to 65.6%, which was sufficient to ensure a clear view of SN at the cost increased noise. This noise issue was tackled by deep learning-powered denoising, which successfully improved the SNR of the images, restoring the performance of SMWI. Both computer simulated data and real data were evaluated by an automated tool5 (mPDia; Heuron Co.Ltd, Incheon, Korea) and expert radiologist to validate the new protocol.Methods
A newly developed SMWI protocol was designed by reduced FOV for the acquisition part and denoising process for the post-processing part (Fig. 1). The phase FOV was reduced from 100% to 65.6% to reduce the scan time, resulting in a 34.4 % reduction from 4m 15s to 2m 56s. Since the reduction of the FOV indicates the decreased SNR, the denoising process was utilized on the SMWI images to sustain SNR. The denoising method based on deep learning by using the pre-trained neural network model, which was Coil2Coil2.For validation, the acquired dataset from the developed protocol (SMWI images with FOV 100% and 65.6%) and existing dataset from an original protocol (SMWI images with FOV 100% and dopamine transporter photon emission tomography (DAT PET) images) using simulation was utilized. For the developed protocol, the GRE images with reduced FOV were acquired and simulated (Fig. 2a-b). These GRE images were reconstructed into SMWI images1 (Fig. 2c).
[Acquisition]
The acquired dataset was scanned from 6 subjects in a 3T scanner (2 subjects for Vida; Siemens Healthcare Erlangen, Germany, 3 subjects for Trio; Siemens Healthcare, Erlangen, Germany, and 1 subject for CX; Philips Healthcare, Amsterdam, Netherlands).
[Simulation]
For the existing dataset, the simulation was performed to generate FOV 65.6% SMWI image using FOV 100% SMWI image. At first, resampling simulation was conducted to GRE images with 100% FOV, which were unprocessed images of SMWI. The acquired FOV 100% GRE images were applied sinc interpolation to generate FOV 65.6% images. Then, the brain extraction was performed on the resampled images by using a mask from the magnitude threshold. For realistic images based on facts that the reduced FOV indicates the degraded SNR, the brain-extracted images were corrupted by the Gaussian noise on the real and imaginary part to match the SNR of the reduced FOV, resulting in the simulated GRE images with reduced FOV to 65.6%.
[Experiment]
The experiment was conducted to demonstrate the diagnosis was well-performed in the reduced FOV data from the developed protocol by comparison with the original protocol. To validate the simulation results, the SMWI images from the simulation and actual acquisition were compared visually by an expert radiologist. After that, the diagnosis PD was performed using FOV 100% SMWI images and simulated FOV 65.6% SMWI images by an expert radiologist and an automated tool. The DAT PET images were considered as the ground truth in this experiment. The PD 50 cases and HC 50 cases were diagnosed by an automated diagnosis tool and PD 23 cases and HC 27 cases were diagnosed by an expert radiologist.
Results
The simulated and acquired FOV 65.6% SMWI images are improved by denoising that nigral hyperintensity is clearly identified (Fig. 3). The diagnosis accuracy of FOV 100% SMWI images and simulated FOV 65.6% SMWI with denoising images are comparable in both case of radiologist and the automated diagnosis tool (Fig. 4; 94% for FOV 100% SMWI image vs 93% for simulated FOV 65.6% denoised SMWI image). The automated tool diagnosis results show that FOV 100% SMWI images have low affected by denoising while Simulated FOV 65.6% SMWI images have high affected by denoising. Furthermore, the simulated FOV 65.6% SMWI images and FOV 100% SMWI images show the same number of false negative cases after denoising SMWI images (Fig. 4b).Discussion and Conclusion
In this study, a new SMWI protocol for PD diagnosis by reduced FOV and denoising was developed. This method showed comparable diagnosis results to the original SMWI protocol that acquired FOV 100% SMWI images. This protocol suggests reducing the scan time without compromising accuracy compared to the original protocol.Acknowledgements
This work was supported by NRF-2022R1F1A1073551 and Heuron. Co. Ltd.References
[1] Nam, Y., Gho, S. M., Kim, D. H., Kim, E. Y., & Lee, J. (2017). Imaging of nigrosome 1 in substantia nigra at 3T using multiecho susceptibility map‐weighted imaging (SMWI). Journal of Magnetic Resonance Imaging, 46(2), 528-536.
[2] Park, J., Park, D., Shin, H. G., Choi, E. J., Shin, D., Chun, S. Y., & Lee, J. Coil to Coil: Self-supervised denoising using phased-array coil images.
[3] Sung, Y. H., Noh, Y., Lee, J., & Kim, E. Y. (2016). Drug-induced Parkinsonism versus idiopathic Parkinson disease: utility of nigrosome 1 with 3-T imaging. Radiology, 279(3), 849-858.
[4] Noh, Y., Sung, Y. H., Lee, J., & Kim, E. Y. (2015). Nigrosome 1 detection at 3T MRI for the diagnosis of early-stage idiopathic Parkinson disease: assessment of diagnostic accuracy and agreement on imaging asymmetry and clinical laterality. American Journal of Neuroradiology, 36(11), 2010-2016.
[5] Shin, D. H., Heo, H., Song, S., Shin, N. Y., Nam, Y., Yoo, S. W., ... & Kim, E. Y. (2021). Automated assessment of the substantia nigra on susceptibility map-weighted imaging using deep convolutional neural networks for diagnosis of Idiopathic Parkinson's disease. Parkinsonism & Related Disorders, 85, 84-90.
Figures
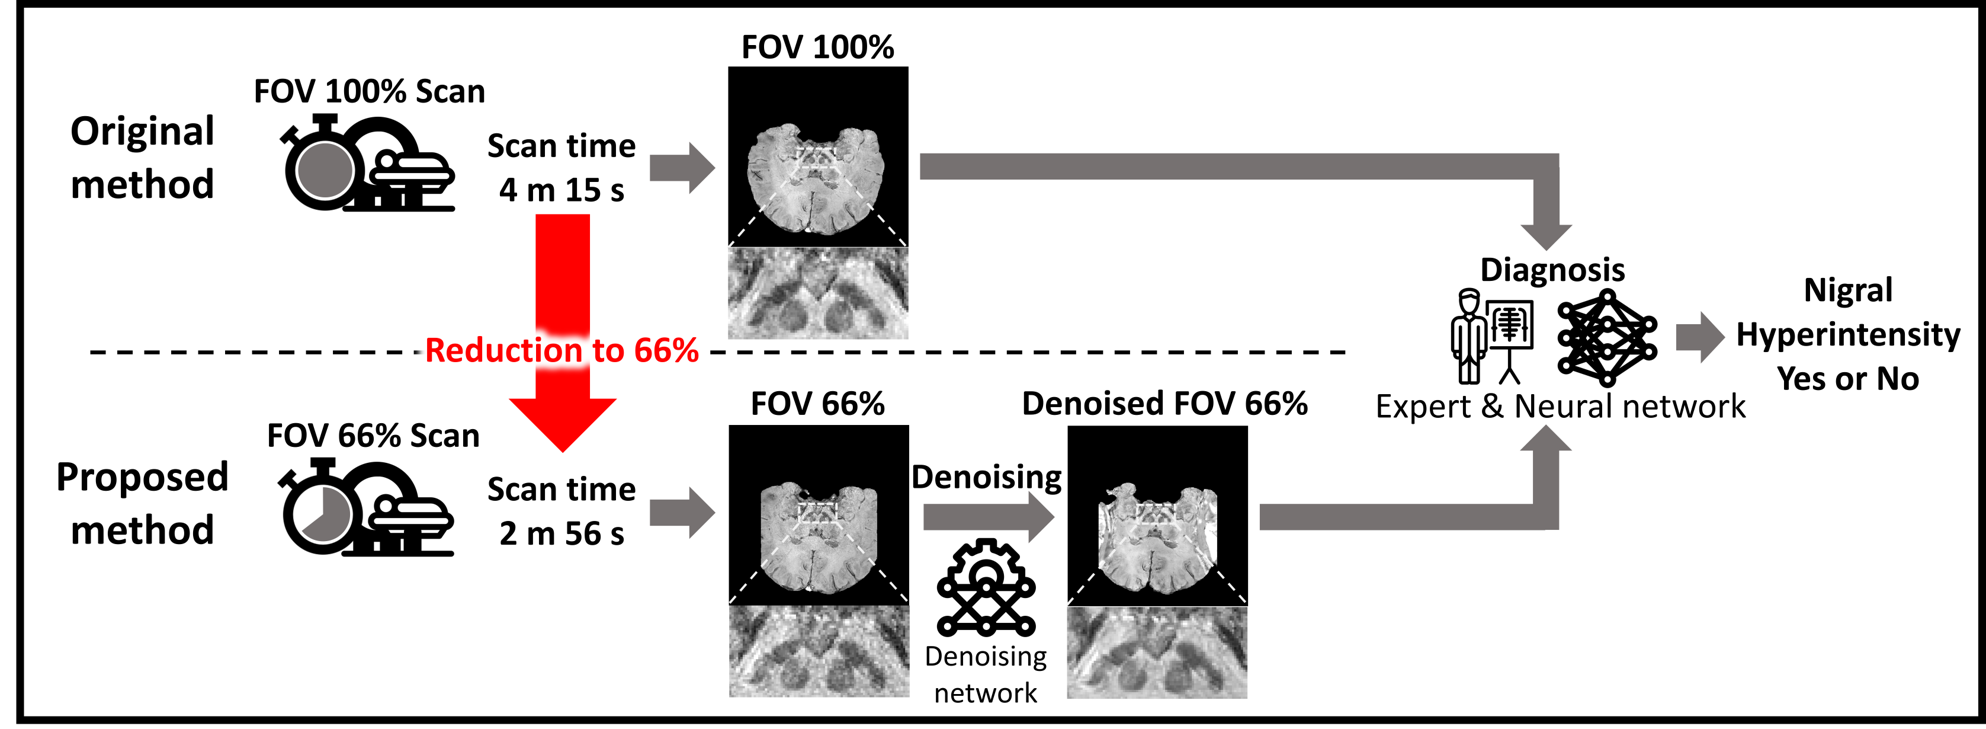
Figure 1. Outline of this study. Original method spends 4 m 15 s to scan FOV 100% SMWI images. The proposed method spends 2 m 56 s to generate diagnosable SMWI images by reducing FOV 100% to 66% in data acquisition step and denoising after generate SMWI image.
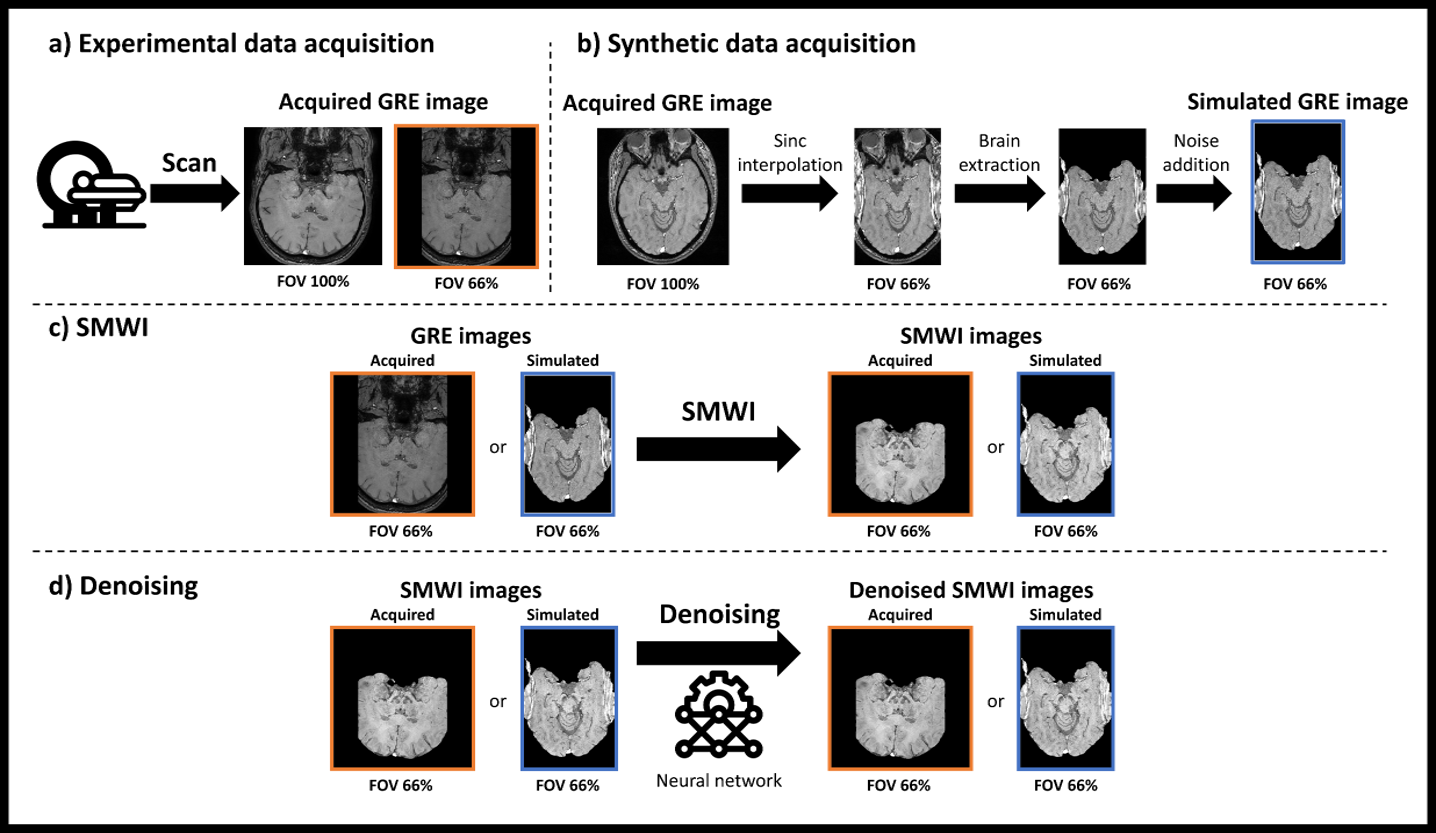
Figure 2. Methods of this study. (a) The experimental data acquire with SMWI sequence for FOV 100% and FOV 66%. (b) The synthetic data acquisition using acquired FOV 100% GRE image. In this protocol, sinc interpolation and complex noise addition is applied in GRE image to generate FOV 66% image. (c) SMWI images are made by GRE images using SMWI protocol. (d) SMWI images are denoised by denoising network.
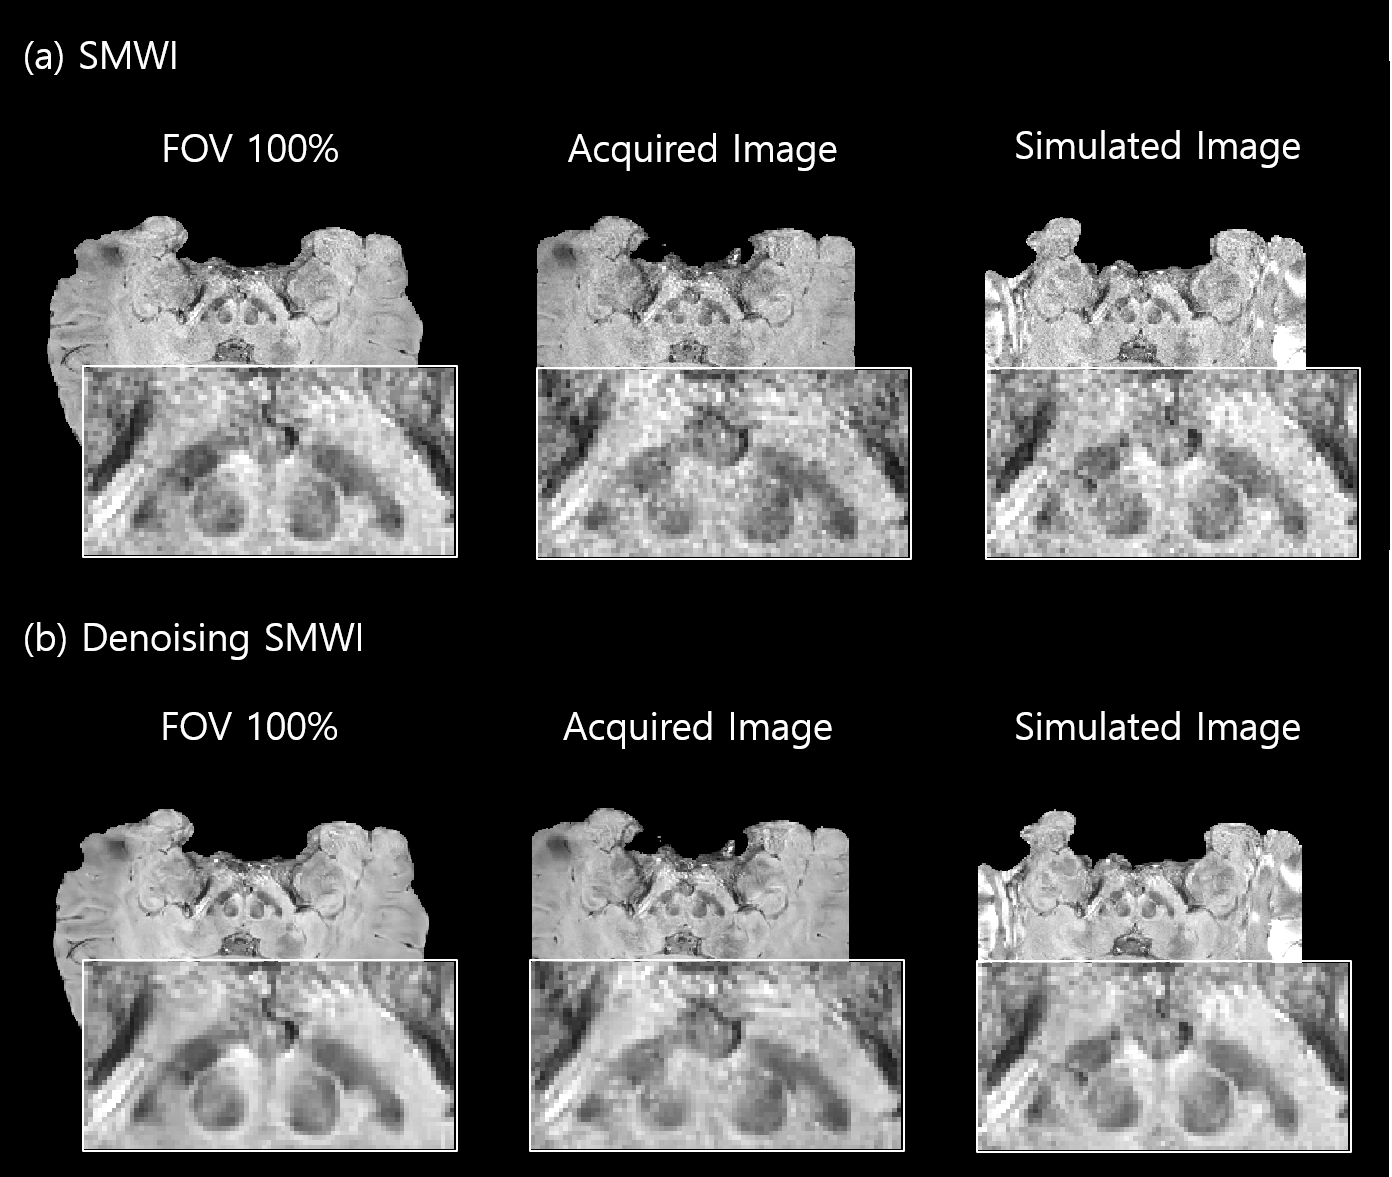
Figure 3. SMWI results of acquired GRE images. (a) The results of SMWI images before denoising. FOV 100% image show high quality while acquired image (FOV 65.6%) and simulated image (FOV 65.6%) show low quality that hard to identify nigral hyperintensity. (b) The results of denoised SMWI images. Denoised SMWI images are able to clearly identify nigral hyperintensity.
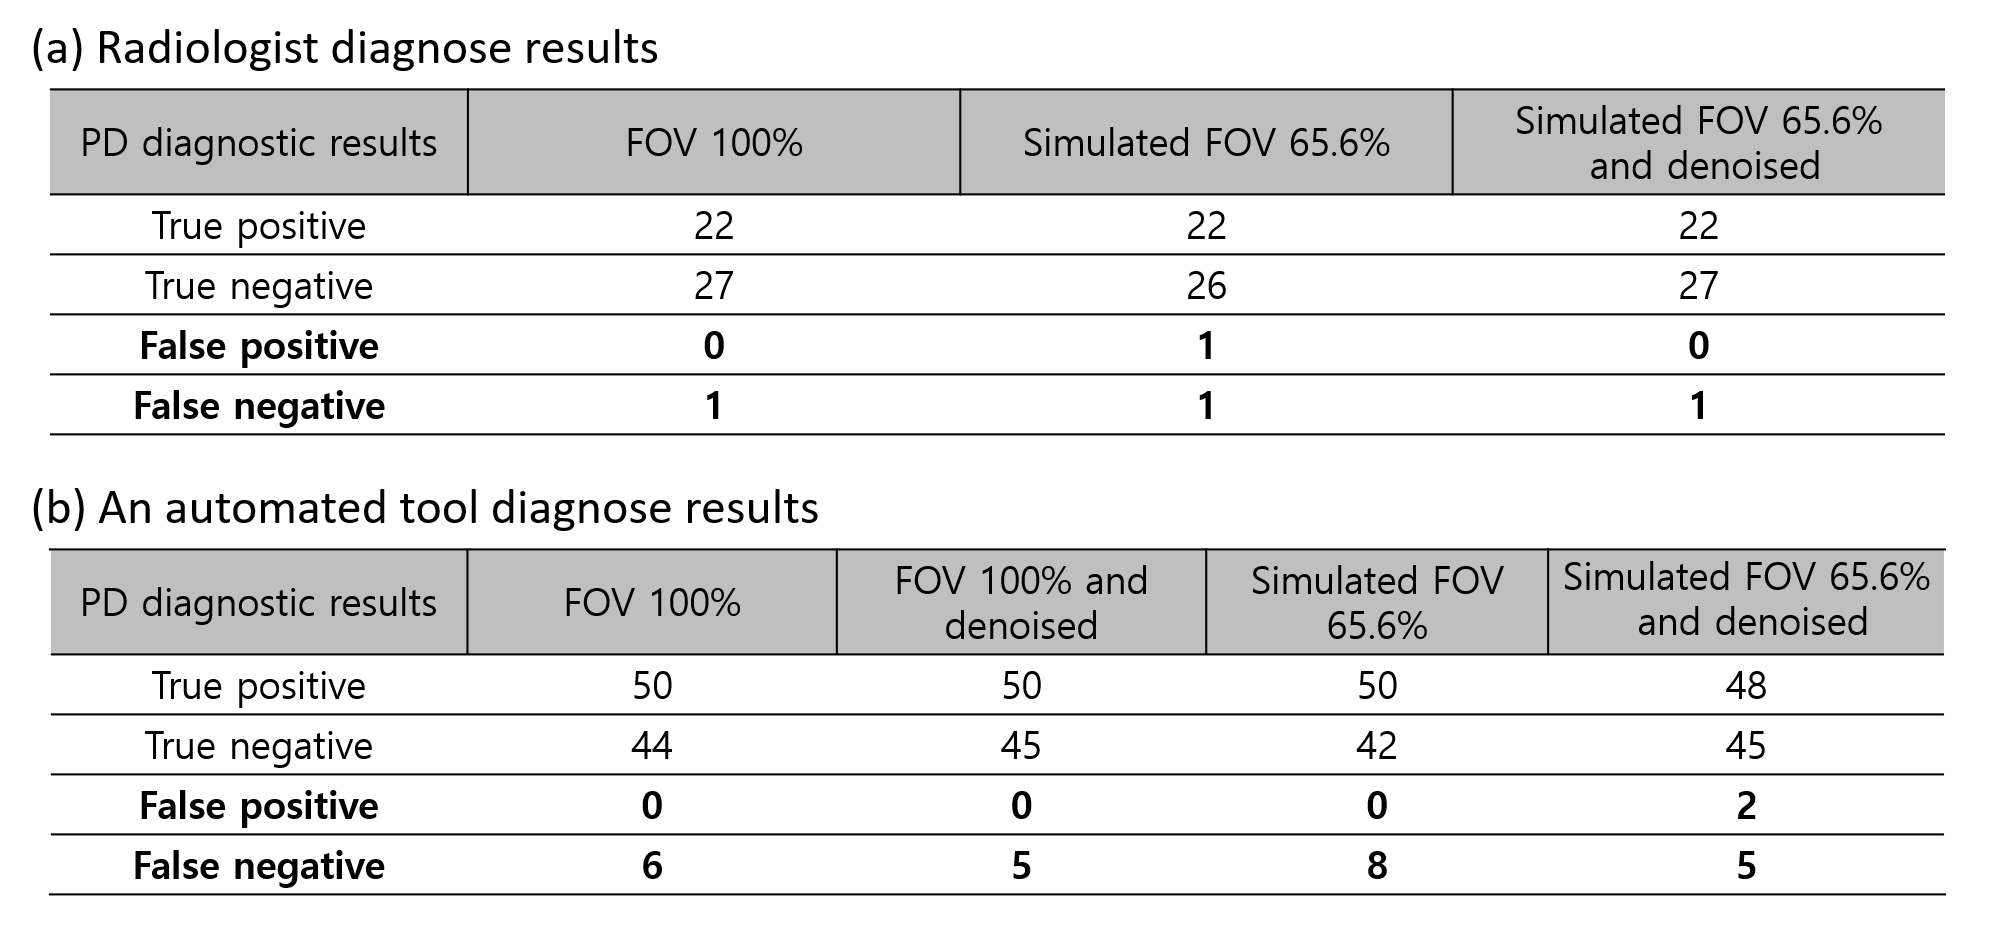
Figure 4. Diagnostic results of FOV 100% SMWI images and simulated FOV 65.6% SMWI images. (a) The case of false negative occurs in the simulated FOV 65.6% SMWI image, but not in the simulated FOV 65.6% and denoised SMWI image. (b) PD diagnostic results of FOV 100% and FOV 100% with denoising SMWI images shows similar results. However, accuracy of simulated FOV 65.6% SMWI images are decreased. The denoising increases accuracy of PD diagnose for simulated FOV 65.6%.