4646
Accelerated parameter mapping in the k-p domain via nonconvex low rank constraint
Kang Yan1 and Craig H Meyer1,2
1Biomedical Engineering, University of Virginia, Charlottesville, VA, United States, 2Radiology & Medical Imaging, University of Virginia, Charlottesville, VA, United States
1Biomedical Engineering, University of Virginia, Charlottesville, VA, United States, 2Radiology & Medical Imaging, University of Virginia, Charlottesville, VA, United States
Synopsis
Keywords: Image Reconstruction, Relaxometry
A nonconvex low rank regularization (NLR) was proposed to accelerate parameter mapping in the k-p domain. The NLR uses weighted nuclear norm minimization (WNNM) to obtain an optimized solution by differently penalizing singular values, in comparison to traditional low rank methods. The performance of the proposed algorithm was demonstrated for T2 mapping of the kidney. Our study demonstrated that the proposed algorithm outperformed k-p domain-based compressed sensing and L&S algorithms.Introduction
Parameter mapping plays an important clinical role in improving the characterization of pathologies. However, multiple data acquisitions with different imaging parameters for T1/T2/T2* mapping take considerable time. Longer scan time can cause drawbacks such as high cost, patient discomfort, and risk of bulk motion. To accelerate parameter mapping, under-sampling can be performed in the ky - p domain; however, this renders the image reconstruction an ill-posed inverse problem. Many methods1-6 have been proposed to accelerate T1/T2/T2* mapping. Sparsity and low rank1-3 prior information are commonly used. In addition, deep learning methods have recently been proposed to learn prior information for T2 mapping6. Compared to the traditional methods, deep learning methods require long training time and are highly dependent on specific acquisition settings. The goal of this study is to make better use of the low rank prior information to improve the estimation of parameter maps at highly under-sampled rates.Method
For reconstruction-based methods, multi-contrast images are usually first reconstructed from under-sampled k-space data and then the T1/T2/T2* mappings are estimated from exponential fitting. The two typical reconstruction-based methods are compressed sensing1 (CS), which exploits the sparsity of the k-p domain, and low rank and sparse2 (L&S), which utilizes both low rank and sparsity prior information to better facilitate T1/T2/T2* mapping. However, traditional low rank methods treat each singular value equally during the SVD operation to pursue a convex objective function, limiting its performance. Nonconvex regularized low rank is based on the fact that singular values of SVD in low rank methods should be treated differently according to prior information7, namely, large singular values should be shrunk less to preserve the major data components. Therefore, a nonconvex low rank constraint for reconstruction-based parameter mapping can be written as follows:$$\min_{x }||FSx-y||_2^2 + \alpha\sum_{j=1}^m||M_jx||_{w,*}$$where $$$x $$$ represents the multi-contrast images to be reconstructed, and $$$y$$$ denotes the acquired data. $$$S$$$ are the sensitivity maps, $$$F$$$ indicates the Fourier transformation, $$$M_{j}$$$ is block operator which is illustrated in Figure 1, $$$\alpha$$$ is the regularization weight, $$$m$$$ is the number of the patch matrix $$$P_{j}$$$ constructed by the $$$M_{j}$$$ operator, and $$$||\cdot||_{w,*}$$$ is the weighted nuclear norm, in which small singular values should have larger penalties. Hence the weights are set to be inversely proportional to the singular values:$$w_{i} =\frac{c\sqrt{n}}{\sigma_{i}(x)+\epsilon}$$
where $$$w_{i}$$$ is the weight for the $$$i^{th}$$$ singular value of the low-rank patch matrix $$$P_{j}$$$. $$$c$$$ is a constant, $$$n$$$ is the number of similar patches in $$$P_{j}$$$, and $$$\epsilon$$$ is a 10-16 to avoid division by 0. $$$\sigma_{i}(x)$$$ is the $$$i^{th}$$$ singular value of artifact-free $$$\widehat{P_{j}}$$$, which is estimated as follows:$$\widehat{\sigma_{i}}(x)=\sqrt{\max(\lambda_i^2-n\sigma^2,0)}$$where $$$\lambda_{i}$$$ and $$$\sigma^2$$$ are the $$$i^{th}$$$ singular value and the noise variance of $$$P_{j}$$$, respectively.
According to WNNM7, the globally optimal solution of the nonconvex low-rank regularized objective function will be reached if the weights are in a non-ascending order, and the $$$i^{th}$$$ weighted singular value $$$\lambda_{w,i}$$$ is calculated by the generalized soft-thresholding operator: $$\lambda_{w,i}=\max(\lambda_{i}-w_{i},0)$$
The ADMM method is used to solve this nonconvex problem. To accelerate the convergence of the NLR algorithm, the initial values are provided by the results of CS. Figure 1 illustrates the ADMM framework for solving the NLR method.
Our NLR algorithm was tested on T2w/T2*w data of the kidney8. The following TEs were used: (n1×10) ms, n1=1:7 forT2w data and TE = (1.43+n2×2.14) ms, n2 = 1:10 for T2*w data. The matrix size was 169×215. Retrospective under-sampling was performed in the ky - p domain (under-sampling rate = 3,4,5,6) using a 2D variable density random pattern with four ky lines per echo fully sampled in the center of k-space.
Results
Figure 2 shows that compared to CS and L&S, the proposed NLR achieves the lowest NRMSE of 0.0094 at R = 3 and 0.0175 at R = 6. The selected kidney ROI shows that the NLR better recovers the details of T2w images as indicated by the red arrows.Figure 3 displays the NRMSE and SSIM performance of the reconstructed T2w images at different under-sampling rates (R = 3,4,5,6) using the proposed NLR method, CS and L&S. The proposed NLR method achieved the lowest NRMSE and highest SSIM at each under-sampling rate.
Figure 4(A) and Figure 5(A) show the high T2/T2* mapping performance of the proposed NLR in the selected kidney ROI, whose NRMSE is 0.040/0.036, compared to 0.050/0.049 for CS and 0.048/0.045 for L&S. Figure 4(B) and Figure 5(B) show the proposed NLR has a stronger positive correlation with the reference T2 mapping than CS and L&S under Bland-Altman analysis and linear regression.
Discussion and Conclusion
The NLR method is proposed for accelerating parameter mapping in k-p domain, and it has better performance than CS and L&S, as demonstrated by the lowest NRMSE and highest SSIM of T2w/T2*w images at different acceleration rates and the strongest positive correlation between the estimated T2/T2* maps and reference T2/T2* maps in the statistical analysis. These initial results demonstrate that weighting singular values differently is a promising method for accelerated T2/T2* mapping. Future work will include additional validation and extension to mapping other parameters.Acknowledgements
No acknowledgement found.References
1. Doneva M et al. MRM. 2010; 64(4):1114-1120.
2. Zhao B et al. MRM. 2015; 74(2):489-498.
3. Zhang T et al. MRM. 2015; 73:655-661.
4. Zhao L et al. MRM. 2016; 75:1989-1999.
5. Liu F et al. MRM. 2018; 82(1):174-188.
6. Meng ZY et al. MRM. 2020; 85(3):1455-1467.
7. Gu SH et al. IEEE CVPR. 2014; 978(1): 4799-5118
8. https://github.com/JoaoPeriquito/T2-s-Mapping
Figures
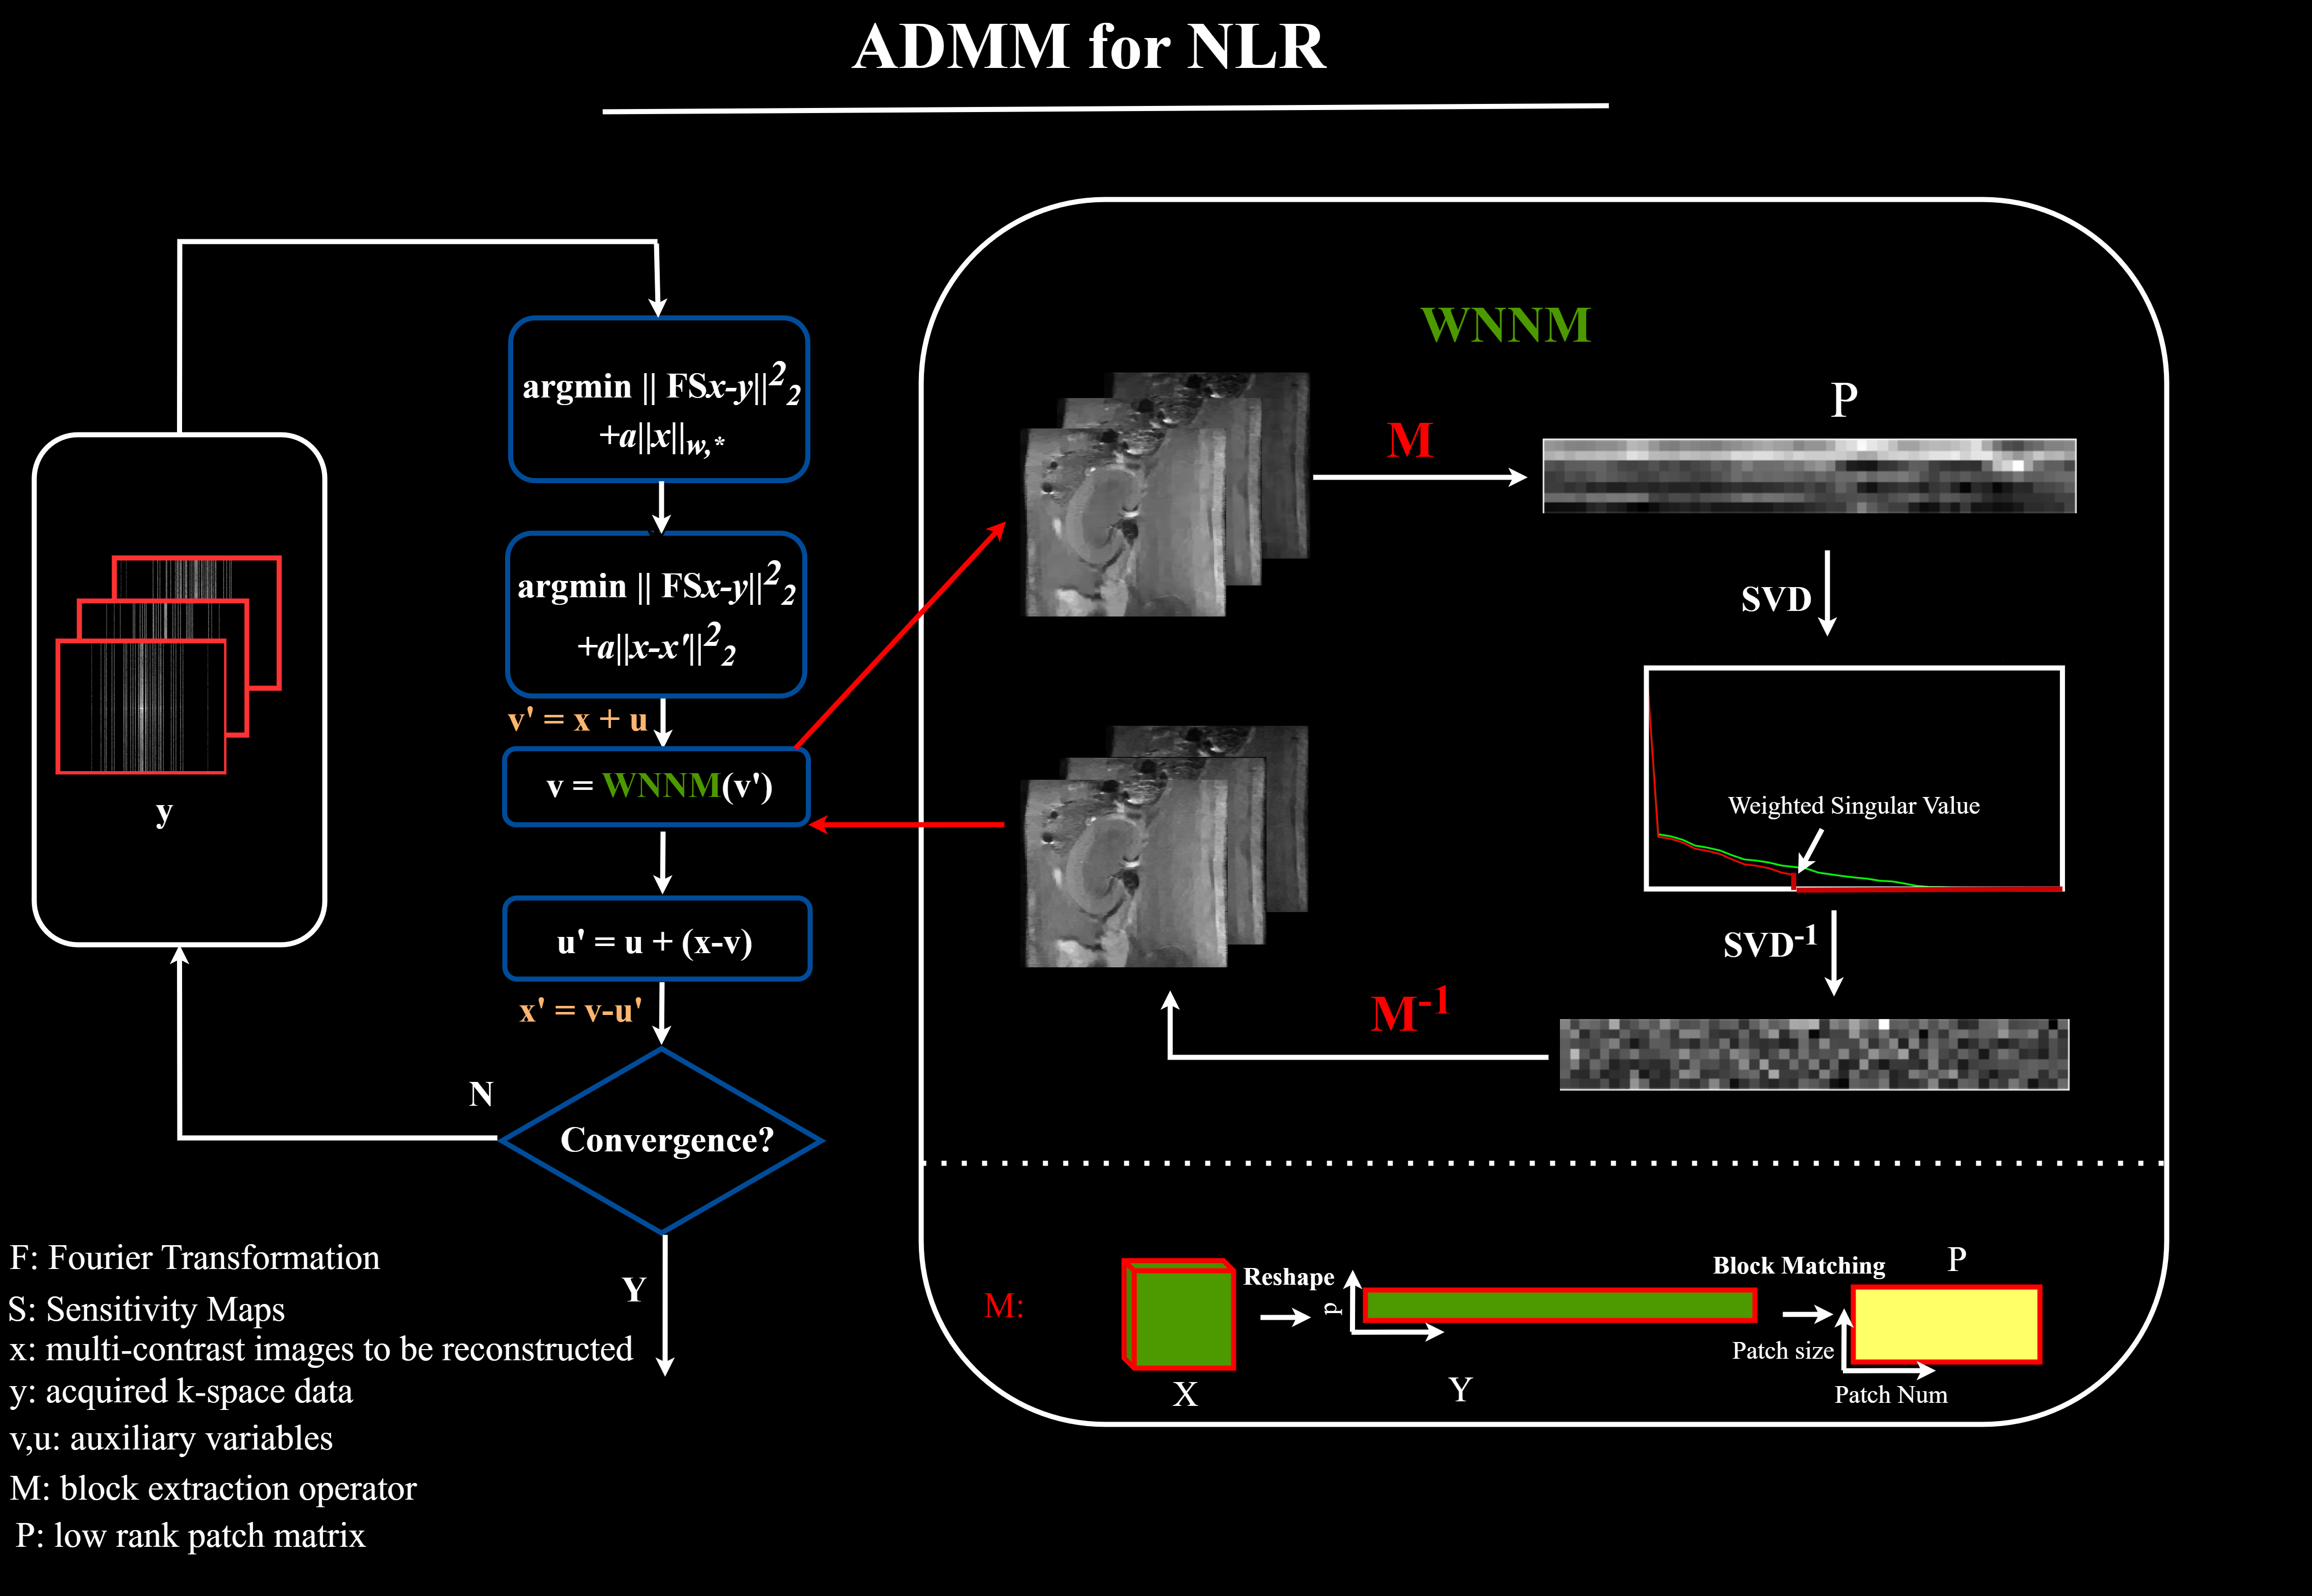
Figure 1. The ADMM framework to solve the nonconvex low rank regularization. Original objective functions are split into two different objective functions using ADMM. The second function was solved by the WNNM algorithm. In this step, we first construct low rank patch matrix P by M operator. Next, weighting singular values is implemented to update P, and then Y is updated by M-1. M: first reshape the 3D data X into a 2D matrix Y whose element yi,j denotes the ith pixel within the image at the jth TE, then extract similar patches from Y to reconstruct P.
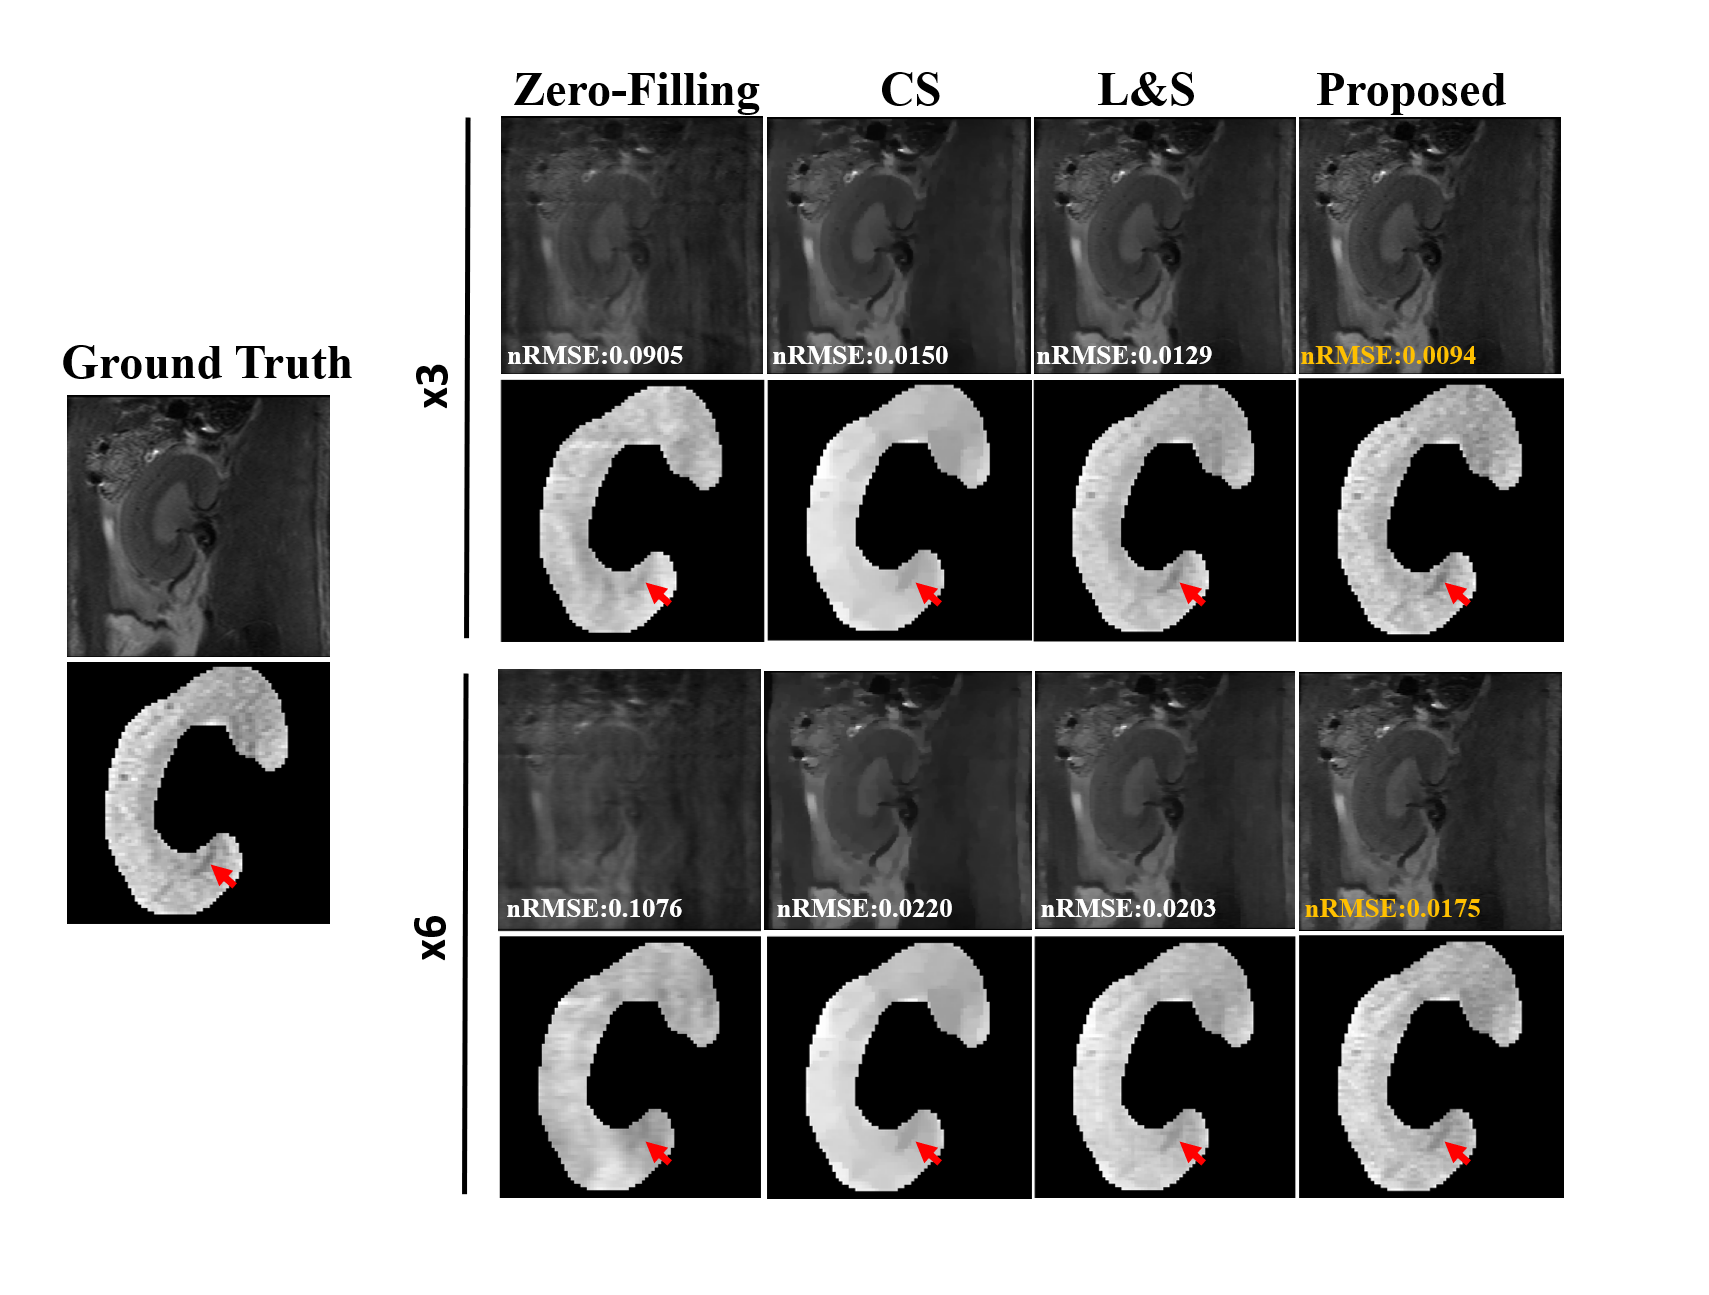
Figure 2. T2w kidney images reconstructed from retrospectively under-sampled data at acceleration rates of 3 and 6 using different reconstruction methods. The kidney ROIs of T2w images were shown for comparison. The proposed method achieves lower NRMSE than the alternative techniques. Red arrows point to regions where the proposed method better recovers details of T2w images.
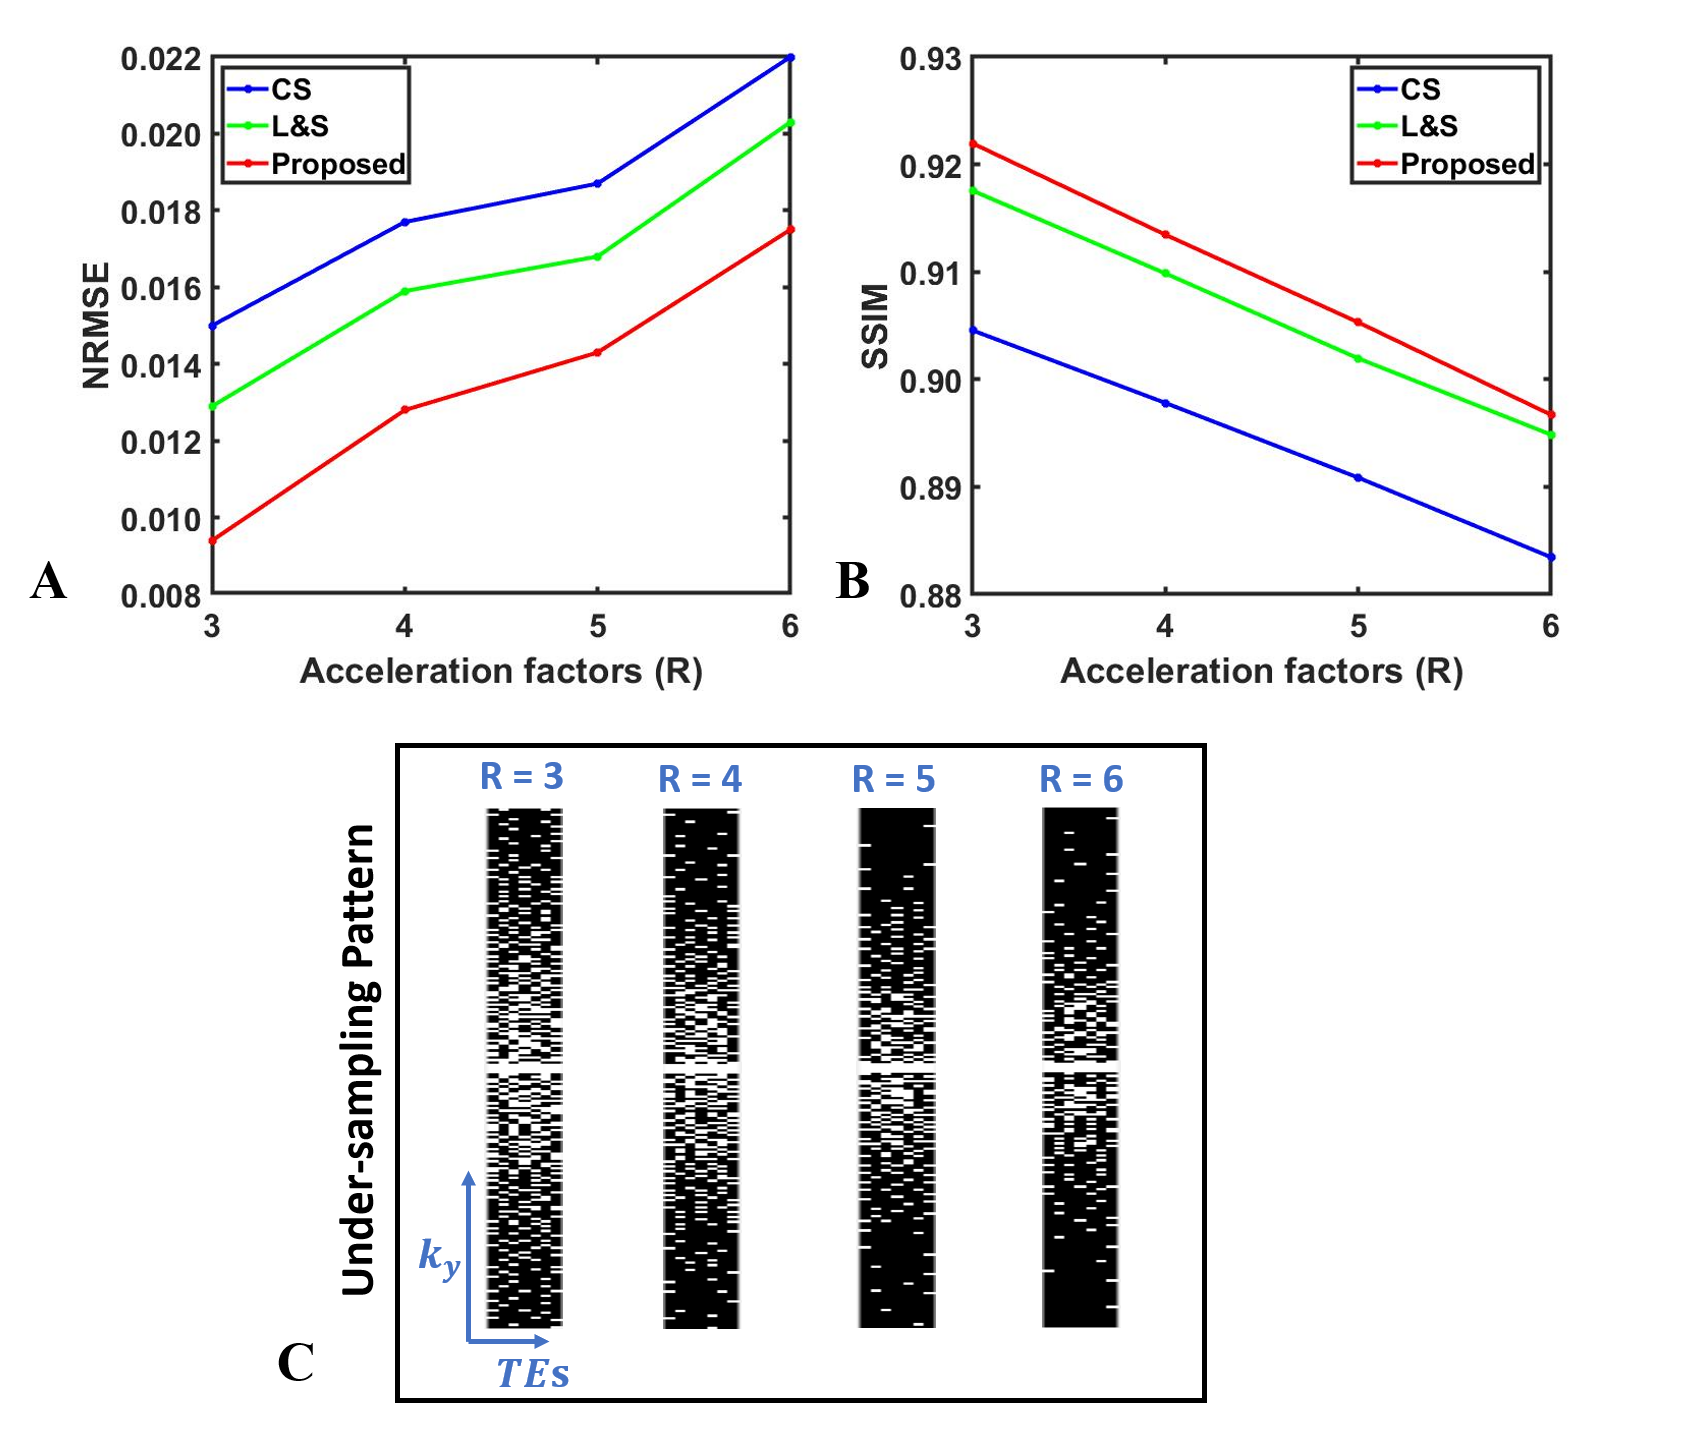
Figure 3. (A) shows NRMSE performance of T2w images reconstructed using CS, L&S and NLR at under-sampled rate R = 3, 4, 5, and 6; (B) shows the SSIM performance among CS, L&S and NLR; (C) displays the under-sampling patterns at different acceleration factors.
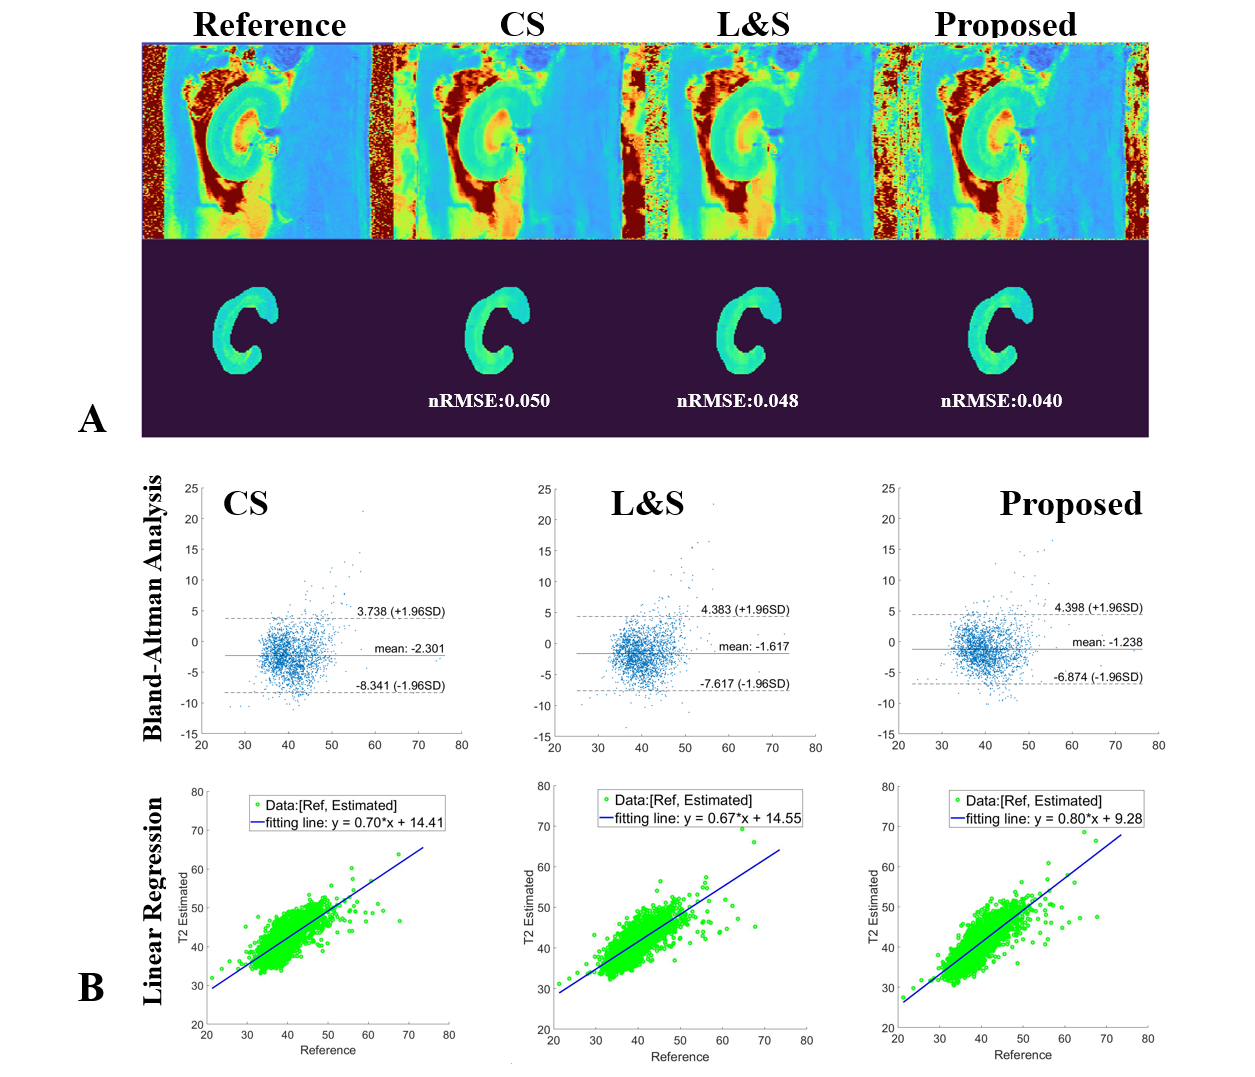
Figure 4. Comparison of the results of T2 mapping using CS, L&S and NLR. (A) shows the calculated T2 maps and selected ROI for quantitative analysis. (B) displays the statistical results using Bland-Altman analysis and linear regression between the T2 maps estimated from CS, L&S and NLR vs. the reference T2 maps. NLR has stronger positive correlation than CS and L&S.
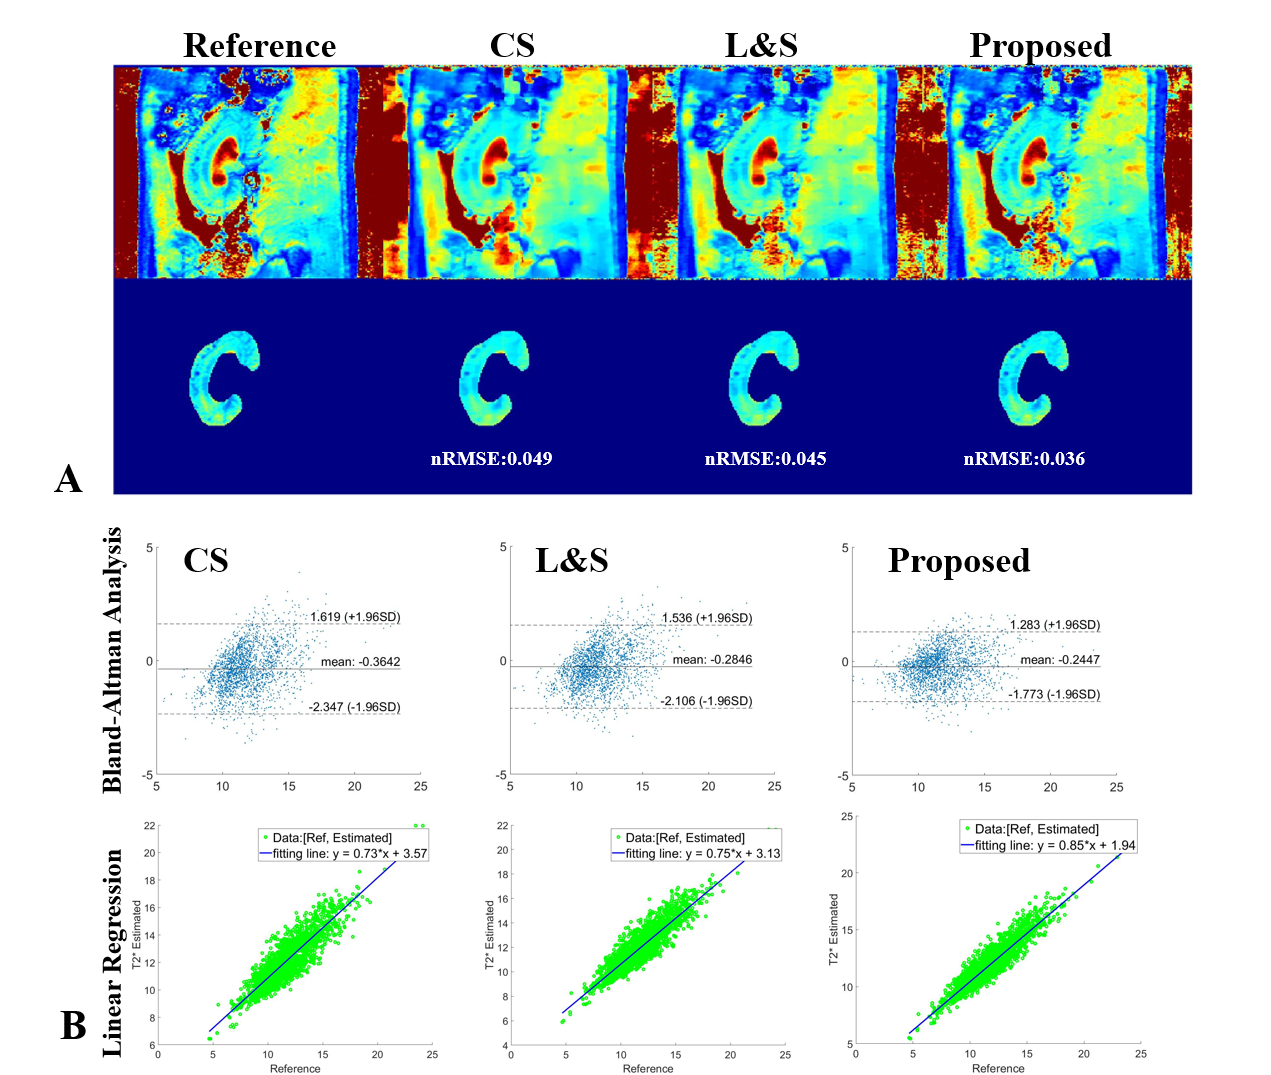
Figure 5. Comparison of the results of T2* mapping using CS, L&S and NLR. (A) shows the calculated T2* maps and selected ROI for quantitative analysis. (B) displays the statistics results using Bland-Altman analysis and linear regression between the T2* maps estimated from CS, L&S and NLR vs. the reference T2* maps. NLR has stronger positive correlation than CS and L&S.
DOI: https://doi.org/10.58530/2023/4646