4643
Comparison of Compressed Sensing Accelerated Rosette UTE and Conventional 31P 3D MRSI at 3T in Leg Muscle1School of Health Sciences, Purdue University, West Lafayette, IN, United States, 2Department of Radiology and Biomedical Imaging, University of California San Francisco, San Francisco, CA, United States, 3Department of Radiology and Radiotherapy, Medical Center - University of Freiburg, Freiburg, Germany, 4Department of Radiology, University of California, Los Angeles, CA, United States, 5Wellcome Centre for Integrative Neuroimaging, University of Oxford, Oxford, United Kingdom, 6Department of Radiology and Imaging Sciences, Indiana University School of Medicine, Indianapolis, IN, United States, 7Weldon School of Biomedical Engineering, Purdue University, West Lafayette, IN, United States
Synopsis
Keywords: Data Acquisition, Muscle
Quantitative comparison of novel, rosette trajectory UTE (70 μs) and conventional weighted Cartesian 3D 31P MRSI sequences is performed at 3T in quadriceps muscle. After previous validation, five healthy volunteers were scanned by both sequences without interruption. Fitted metabolite maps and SNR calculations of PCr and ATP signals across selected slices and voxels displayed competitive performance between each acquisition. Retrospective compressed sensing (CS) acceleration results suggest this UTE MRSI may enable faster, higher resolution 31P metabolite mapping in leg muscle and other organs of interest.Introduction
Plentiful literature has highlighted the value of phosphorus-31 (31P) MRS metabolites in providing non-invasive measurements of tissue pH, muscular energy metabolism, and disease prognosis1. Unfortunately, relatively short T2 relaxation times and low in vivo abundance introduce significant restrictions on SNR and resolution within a “clinically feasible” length scan, especially when working below 7T2. Following previous validation3, a rosette UTE 3D sequence was adapted to 31P MRSI and observed to produce comparable results to gold-standard conventional 3D CSI given the same amount of scanning time. Due to the rosette k-space trajectory’s relatively incoherent sampling pattern, it is possible that high under-sampling and compressed sensing (CS) reconstruction techniques could greatly accelerate this acquisition4. A comparative analysis was performed in five healthy volunteers to assess relative performance between the full conventional scan, full UTE scan, and CS accelerated UTE reconstruction.Methods
All data acquisition occurred on a 3T Siemens Prisma scanner at the Purdue MRI facility. The same 8-channel, dual-tuned 1H/31P phased array coil (2 parallel plates with 4 31P channels each)5 was used in all sessions. Five healthy volunteer subjects (BMI = 26 ± 2 kg/m2; age = 29 ± 5 years; 2 f / 3 m) were positioned feet-first and supine, with the upper thighs tightly surrounded by the coil plates. Figure 1 summarizes the two sets of sequence parameters while Figure 2 illustrates coil setup. The adjustment volume was manually positioned (covering both upper legs) and linewidth manually minimized using a 3D GRE abdomen field map and interactive SIEMENS shimming (VE11c). The total scanning process required approximately 90 minutes for each subjectRaw (TWIX) data files were exported for reconstruction and pre-processing in MATLAB (Mathworks, Natick, USA). Gridding and FFT were completed using the nonuniform FFT (NUFFT) method. Data were Hanning filtered and coil-combined using singular value decomposition. Spectra from both acquisitions were zero-order phased by maximizing the real integral of the PCr peak (~0 ppm), and first-order phased by adding 2.3 ms and 70 μs delays respectively. Spectra were fitted within OXSA using AMARES methods6,7. SNR was calculated by dividing PCr peak amplitude by the standard deviation of a noisy spectral region (+10 to +14 ppm, left of the PCr peak). Metabolite maps were generated using ratios of fit amplitudes, with voxels disqualified whenever CRLB estimates were exceedingly high.
Results
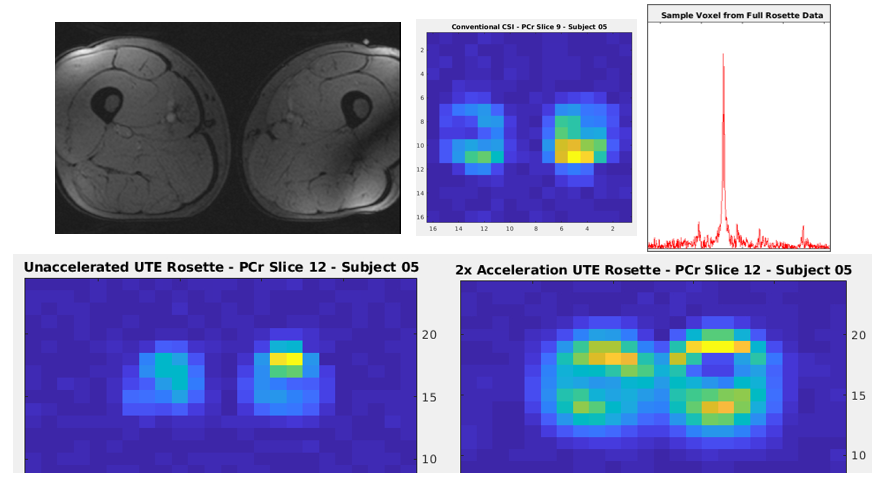
Figure 3 lists SNR calculations from the full acquisitions for each subject, along with point-spread-function (PSF) simulations. Acquired SNR appears extremely comparable between the methods across all five subjects.Figure 4 contains example PCr SNR maps calculated from a single slice in one individual. Reported ratio values in healthy quadriceps/hamstrings range from 3.81-5.802, reasonably close to the OXSA AMARES fitting results across all subjects. Although the full metabolite map is closest to the full conventional CSI, the original structure remains clearly visible in the accelerated map. A greater degrees of CS acceleration under-sampling slightly changes the image scaling, however this can be corrected retrospectively. CS acceleration reconstruction also alters the original UTE rosette’s PSF, requiring accurate simulations to calculate the new effective voxel size and compensate SNR calculations.
Discussion and Conclusion
These initial results demonstrated the potential of our novel rosette UTE 31P 3D MRSI sequence for CS acceleration. Although the version shown here had a relatively large FOV with a coarse resolution, acquisition is possible with much smaller FOVs and finer resolution. This acceleration also does not impede the UTE sequence’s intrinsic avoidance of first-order phasing issues nor measurement of extremely fast T2 metabolites. Future work is focused on application to non-alcoholic fatty liver disease (NAFLD) and high resolution 31P brain metabolite mapping. In hepatology clinics, accelerated 3D MRSI with a large FOV might aid in quickly assessing NAFLD prognosis in overweight-to-obese patients. Similarly, a 2x acceleration factor could generate whole-brain, high-resolution metabolite maps in under 15 minutes of scan time.Acknowledgements
Data acquisition was supported in part by the Indiana CTSI. The authors would also like to thank Dr. Anshuman Panda for his initial work with the 8-channel phased array coil.References
1Valkovic L, Chmelik M, and Krssak M. In-vivo 31P-MRS of skeletal muscle and liver: A way for non-invasive assessment of their metabolism. Anal Biochem. 2017;529:193-215.
2Meyerspeer M, Boesch C, Cameron D, et al. 31 P magnetic resonance spectroscopy in skeletal muscle: Experts' consensus recommendations [published online ahead of print, 2020 Feb 10]. NMR Biomed. 2020;34(5):e4246.
3Shen X, Ozen AC, Sunjar A, et al. Ultra-short T2 components imaging of the whole brain using 3D dual-echo UTE MRI with rosette k-space pattern [published online ahead of print, 2022 Sep 25.] Magn Reson Med. 2022;10.1002/mrm.29451.
4Li Y, Yang R, Zhang C, et al. Analysis of generalized rosette trajectory for compressed sensing MRI. Med Phys. 2015;42:5530-5544.
5Panda A, Jones S, Stark H, et al. Phosphorus liver MRSI at 3 T using a novel dual-tuned eight-channel 31P/1H H coil. Magn Reson Med. 2012;68(5):1346-1356.
6Purvis LAB, Clarke WT, Biasiolli L, et al. OXSA: An open-source magnetic resonance spectroscopy analysis toolbox in MATLAB. PLoS One. 2017;12:e0185356.
7Vanhamme L, van den Boogaart A, and Van Huffel S. Improved Method for Accurate and Efficient Quantification of MRS Data with Use of Prior Knowledge. J Magn Reson. 1997;129:35-43.
Figures
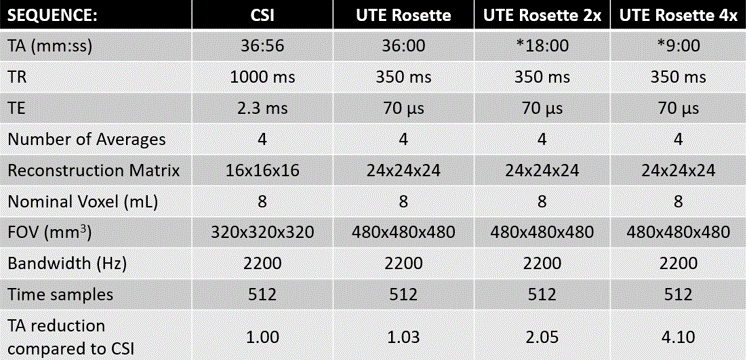
Figure 1: Table of Conventional Weighted CSI and UTE Rosette MRSI Parameters
Summary of sequence parameters for both 3D acquisitions. Bandwidth, vector size, and nominal voxel size are identical, while time is nearly matched. Note the acquisition time for accelerated UTE is based on 2x and 4x under-sampling factors.
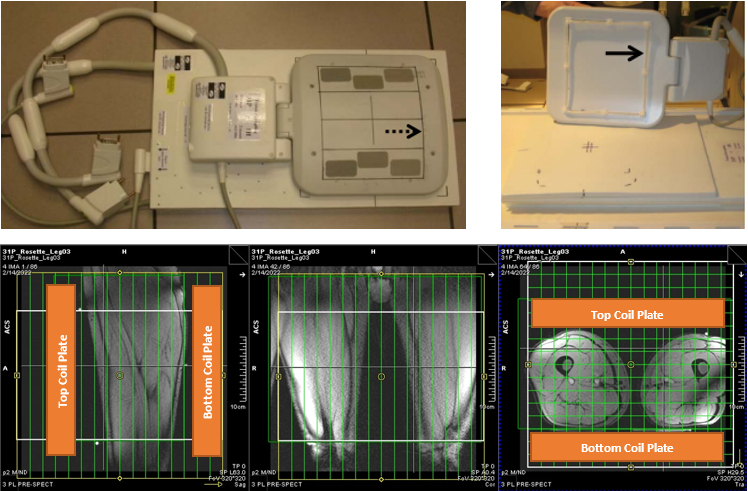
Figure 2: Phased Array Coil Setup
Top: Photograph of 8-channel phased array coil. The bottom plate replaces the standard MRI table cushions, while the top rests on the subject’s upper thighs. Water-filled fiduciary markers confirm coil element positioning and assist in MRSI planning. Bottom: MRSI planning images and outline of coil placement. Each coil plate is approximately 35 cm in length.
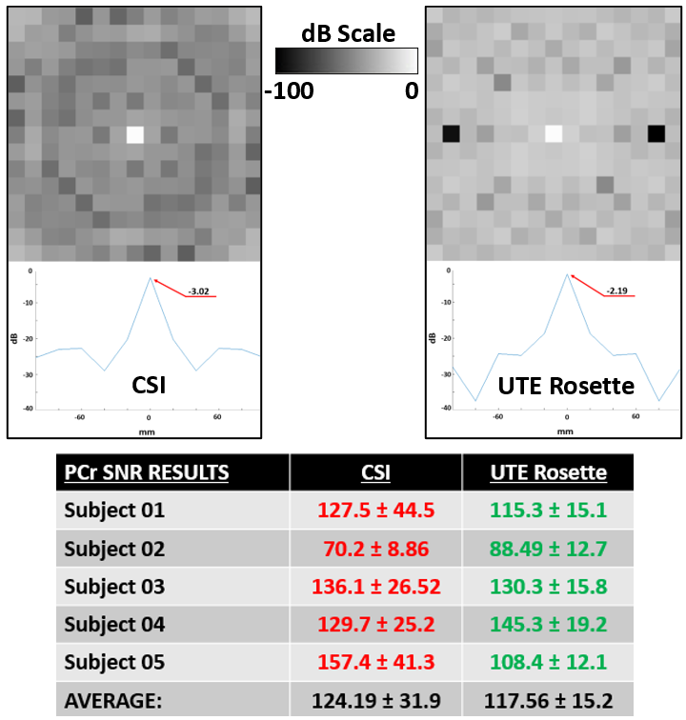
Figure 3: PSFs and Selected SNR Calculations
Top: Point spread function (PSF) comparison among different k-space designs. Above are center slices in x-y plane of the 3D PSFs. Below is the center line in x-axis (-100 to 100 mm) of the above figures, with all results converted into dB units to illustrate signal loss. Peak values of the PSF are identified and inlaid. Bottom: PCr SNR results for 12 consistently selected quadriceps muscle voxels in the highest signal (center) slices and regions across all subjects. Mean SNR is 5.6% higher for conventional CSI with double the standard deviation.