4639
The Impact of Acceleration Factors of Compressed Sensing on the Image Quality of the Fast Spin Echo Diffusion Weighted Imaging for the Skull Base
Haonan Zhang1, Qingwei Song1, Jiazheng Wang2, and Ailian Liu1
1Department of Radiology, the First Affiliated Hospital of Dalian Medical University, Dalian, Dalian, China, 2Philips Healthcare, Beijing, China, Beijing, China
1Department of Radiology, the First Affiliated Hospital of Dalian Medical University, Dalian, Dalian, China, 2Philips Healthcare, Beijing, China, Beijing, China
Synopsis
Keywords: Brain Connectivity, Brain
Compared with echo planar imaging diffusion weighted iamging (EPI-DWI), turbo spin echo diffusion weighted imaging (TSE-DWI) can significantly reduce magnetic sensitivity artifacts in skull base imaging. However, the longer scan time limits its clinical promotion. The purpose of this study is to investigate the effect of the compression sensing acceleration factor on the image quality of TSE-DWI in the skull base area.Introduction
Diffusion weighted imaging (DWI), as one of the most commonly used MR functional sequences for the diagnosis of brain diseases, can non-invasively quantify the diffusion characteristics of water molecules using ADC1. The traditional DWI sequence uses echo planar imaging (EPI) technology, which can complete whole brain imaging in a short time. However, due to the variation of the magnetic field in the skull base area, it is prone to susceptibility artifacts and misdiagnosis2. DWI imaging based on turbo spin echo sequence (TSE) can eliminate magnetic sensitivity artifacts, but the scan time is relatively long, which limits its clinical promotion3. Compressed sensing (CS) can significantly shorten the scan time through sparse sampling, while ensuring the image quality to meet the diagnostic requirements4. The purpose of this study is to explore the effect of the compressed sensing acceleration factor on the image quality of the fast spin echo diffusion weighted imaging in the skull base area.Materials and methods
The study population consisted of 22 healthy subjects(8 females, 53.4±18 years), 22 subjects with dentures(8 females, 57.8±19.7 years) and 11 subjects with skull base lesions(8 females, 45.1±19.7 years), defined as group A, B, and C, Respectively. All subjects underwent the EPI-DWI and TSE-DWI scan of Skull Base on a 3.0 T MR scanner (Ingenia CX, Philips Healthcare, Best, the Netherlands). TSE-DWI adopted a routine clinical setup of SENSE acceleration factor 2.6, and CS factors of 2.6, 3.6, 5.6 and 7.6. Other scan parameters were shown in Table 1. In the b=1000 image, the largest level of the cerebellum and the upper and lower levels of the cerebellum and the brain stem and pons on the left and right sides of the brain parenchymal regions delineate the regions of interest to measure the ADC value and signal intensity. In group C, ROI was delineated to measure the ADC value and signal intensity at the largest layer of the b=1000 image lesion and the upper and lower layers. The signal intensity and noise intensity of the dentate nuclei on both sides are measured at the largest level of the dentate nucleus, based on which Signal to Noise Ratio (SNR) and Contrast to Noise Ratio (CNR) were calculated for all volunteers. The two observers used a four-point scoring method to evaluate the quality of the images. The Kappa test was adopted to evaluate the consistency of the scores from the two radiologists. If the consistency was in good agreement, the corresponding images would be adopted for further analysis by senior physicians. In the following analysis, the Friedman test was used to test the differences of the cerebellum, brainstem and pons, ADC value, SNR, CNR, and subjective scores on the two sides of TSE-DWI in groups A, B, and C, and the Wilcoxon test was employed to make a pairwise comparison. The optimal AF is selected subsequently for comparison with EPI-DWI. This study has been approved by the local IRB.Results
The scores by the two observers were in good agreement (kappa=0.772, 0.831, 0.828). Comparing TSE-DWI with different AF, there was no significant difference in ADC between the right cerebellum and pons in group A, and the ADC on the right cerebellum and left in group B. Pairwise comparison, when AF is CS5.6 in group A, the left cerebellar CNR, right pons SNR, CNR and image scores have statistically significant differences compared with SENSE2.6 (p<0.05); at same AF in group B, the left cerebellum and pons brainstem SNR, CNR, right cerebellum and pons brainstem CNR and image scores were significantly different than SENSE2.6 (p<0.05); when AF is CS5.6 in group C, there was a statistically significant difference between CNR and SENSE2.6 (p<0.05). Subsequent comparison between TSE-DWI CS3.6 and EPI, there was a statistical difference in the scores of groups B and C(p<0.05), but the score of TSE-DWI CS3.6 was higher than that of EPI-DWI.Conclusions
Compared with EPI-DWI , TSE-DWI can significantly improve the geometric distortion artifacts of the skull base. The TSE-DWI combined with CS gradually shortens the scanning time as the acceleration factor increases. When CS=3.6, compared with SENSE=2.6, the scan time is shortened by 21.92%. For subjects with dentures, it is recommended to use CS=3.6 to scan the skull base with TSE-DWI sequence.Acknowledgements
No acknowledgement found.References
1. Kolff-Gart, AS; Pouwels, PJ; Noij, DP, et al. Diffusion-weighted imaging of the head and neck in healthy subjects: reproducibility of ADC values in different MRI systems and repeat sessions.AJNR Am J Neuroradiol,2015,36(2):384-390. 2. Wan Q, Lei Q, Wang P, et al. Intravoxel Incoherent Motion Diffusion-Weighted Imaging of Lung Cancer: Comparison Between Turbo Spin-Echo and Echo-Planar Imaging. J Comput Assist Tomogr,2020,44(3):334-340. 3. Elefante, A; Cavaliere, M; Russo, C, et al. Diffusion weighted MR imaging of primary and recurrent middle ear cholesteatoma: an assessment by readers with different expertise. Biomed Res Int,2015,2015:597896. 4. Bratke, G; Rau, R; Weiss, K, et al. Accelerated MRI of the Lumbar Spine Using Compressed Sensing: Quality and Efficiency. J Magn Reson Imaging,2019,49(7):e164-e175.Figures
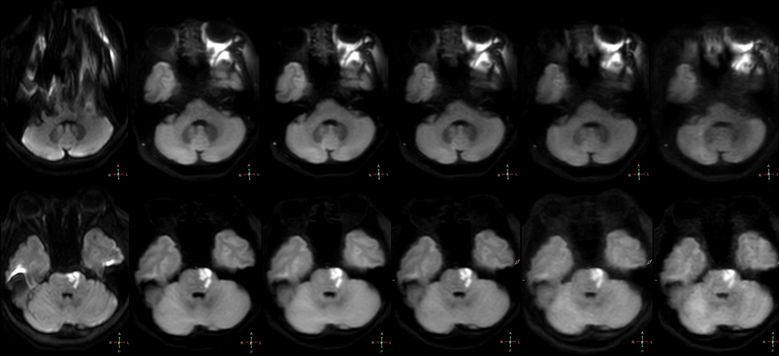
Figure
1. The first row, from left to right: Group B EPI, SENSE2.6, CS2.6-CS7.6
The second row, from left to right: Group
C EPI, SENSE2.6, CS2.6-CS7.6
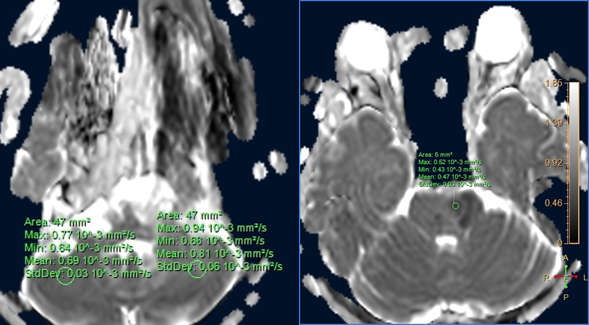
Figure2.ROIs for
measurements of ADC. The measured left and right ADC was 0.81×10⁻³ and 0.69×10⁻³, respectively. The ADC value of
the lesion is 0.47×10⁻³.
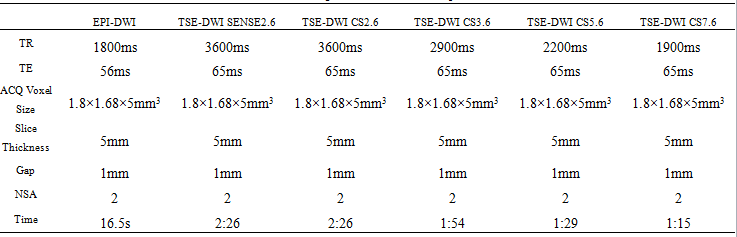
Table
1. Scan parameters of each sequence
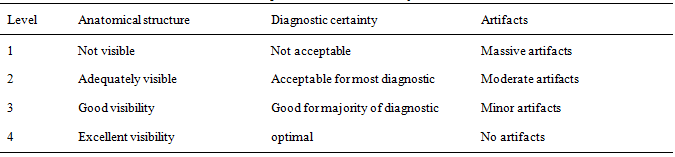
Table 2. Subjective score criteria system
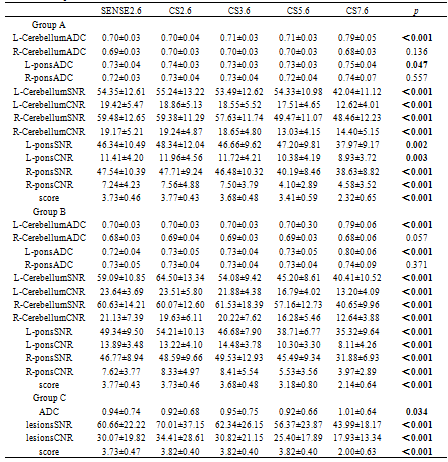
Table
3. ADC, SNR,
score and the corresponding upper and lower limits of each sequence
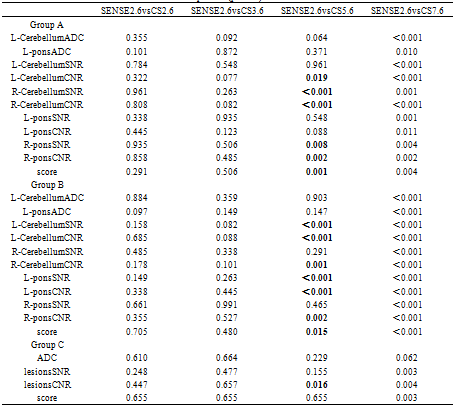
Table
4 A, B, C group TSE-DWI different AF objective evaluation and subjective score
comparison (p value)
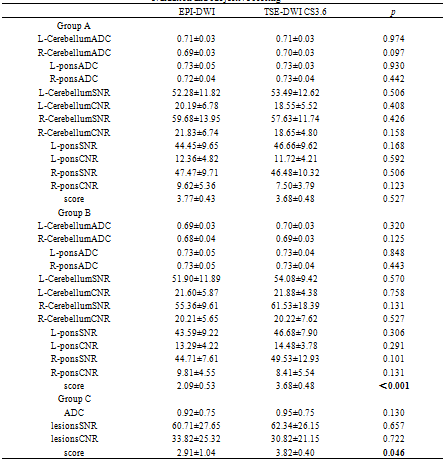
Table 5 Comparison of the difference
between TSE-DWI CS3.6 and EPI-DWI objective evaluation and subjective scoring
DOI: https://doi.org/10.58530/2023/4639