4634
Exploiting diffusion MRI data redundancy on a denoising framework - application on MR images (OGSE, μFA protocols) of the Marmoset Brain (in-vivo)1Computer and Electrical Engineering, University of São Paulo, São Carlos, Brazil, 2Robarts Research Institute, Western University, London, ON, Canada
Synopsis
Keywords: Data Processing, Data Analysis, Denoise
Oscillating gradients spin-echo (OGSE) and microscopic fractional anisotropy (μFA) are diffusion MRI advanced techniques able to provide additional information of the microstructures of the brain1-5, when compared to traditional diffusion MRI. However, high-resolution DWI images present low signal to noise ratio (SNR). In this work, we presented a different framework, named VST_dMRI_BM4D, for denoising dMRI data by exploiting data redundancy and using the variance stabilization transformation (VST) concept7-9. Results show the proposed method is comparable to, and in some cases superior than, MPPCA6, potentially making it a useful tool to be used in the dMRI field.Introduction
Oscillating gradients spin-echo (OGSE) and microscopic fractional anisotropy (μFA) techniques have been recently investigated for the first time in the common marmoset (Callithrix jacchus) brain1. Both these advanced diffusion MRI techniques can provide additional and useful information of the microstructures of the brain2-5, when compared with traditional diffusion MRI. However, the high-resolution DWI images are prone to low signal to noise ratio (SNR). Consequently, the resulting metrics, such as kurtosis and MD from OGSE protocol, and kurtosis, MD, FA from μFA protocol, can become too noisy, impairing further analysis and limiting their clinical application.PCA in its variant form, MPPCA6, has been widely used for denoising diffusion MR data. In this work, however, we propose the application of a different denoising framework, named VST_dMRI_BM4D. The core concepts behind it are: (1) rearranging data, prior to denoising, taking advantage of the fourth dimension of the dMRI dataset (of different shells and gradient directions). This way, we boost the perfomarnce of the denoising algorithm (based on block-similarity)7; (2) variance stabilization transformation (VST), transforming (prior to denoising) the heteroscedastic noise (typical of MR magnitude images) into approximately homoscedastic Gaussian noise8,9. With these two concepts put together, we expect the proposed VST_dMRI_BM4D algorithm to be equivalent to or even outperform MPPCA.
Methods
OGSEIn-vivo images were acquired with the following parameters: single-shot spin-echo EPI, TE/TR=54/17000ms, acceleration factor = 2, frequencies(directions) = 0(9)/30(9)/57(6)/85(4) Hz, b-values = 1 and 2 ms/μm2, resolution = 0.6mm isotropic, total acquisition time = 65min. Repetitions were used so that the total number of scans were balanced among the frequencies.
μFA
In-vivo images were acquired with single-shot spin echo EPI, TE/TR=43/6800ms, acceleration factor = 2, resolution = 0.5x0.5x0.6mm3, total acquisition time = 63min, 3 shells, max b-value = 2ms/μm2.
Denoising - proposed (VST_dMRI_BM4D)
To take advantage of the dMRI data redundancy, the DW images were first separated in groups considering the different shells (b=0, b=1, b=2 ms/μm2). Thus, instead of having the algorithm search for similarity in a volume (containing different slices of the brain), we stacked the same slice (of each shell and each different gradient direction acquisition) prior to denoising. This way, we boost the algorithm capability of finding similar blocks, consequently improving the denoised results. Such approach has also been recently reported in10.
After rearrangement, the DW magnitude images were denoised using a framework similar to 8, in combination with 9, in which a variance stabilization transformation (VST) is applied to the data prior to denoising with the BM4D algorithm 7. The denoised volume is finally recovered to its original intensity range by applying the correct inverse transformation8.
Denoising - MPPCA
To compare the performance of the proposed method, the data was also denoised by the well-known MPPCA algorithm6.
One repetition versus All repetitions
To access a potential reduction in scan time, we also compared two scenarios: (1) using all repetitions of each shell; (2) using only one repetition of each shell.
Processing
After denoising, data was processed with Gibbs removal, motion/distortion/eddy current-corrected using MRtrix3 and FSL. kurtosis and ADC from the OGSE and μA protocols were calculated using non-negative linear least squares using Matlab8. FA maps were calculated using the MRtrix3 package. To avoid partial volume artifacts, the ROIs were chosen in large regions with homogeneous tissue contrast.
Results
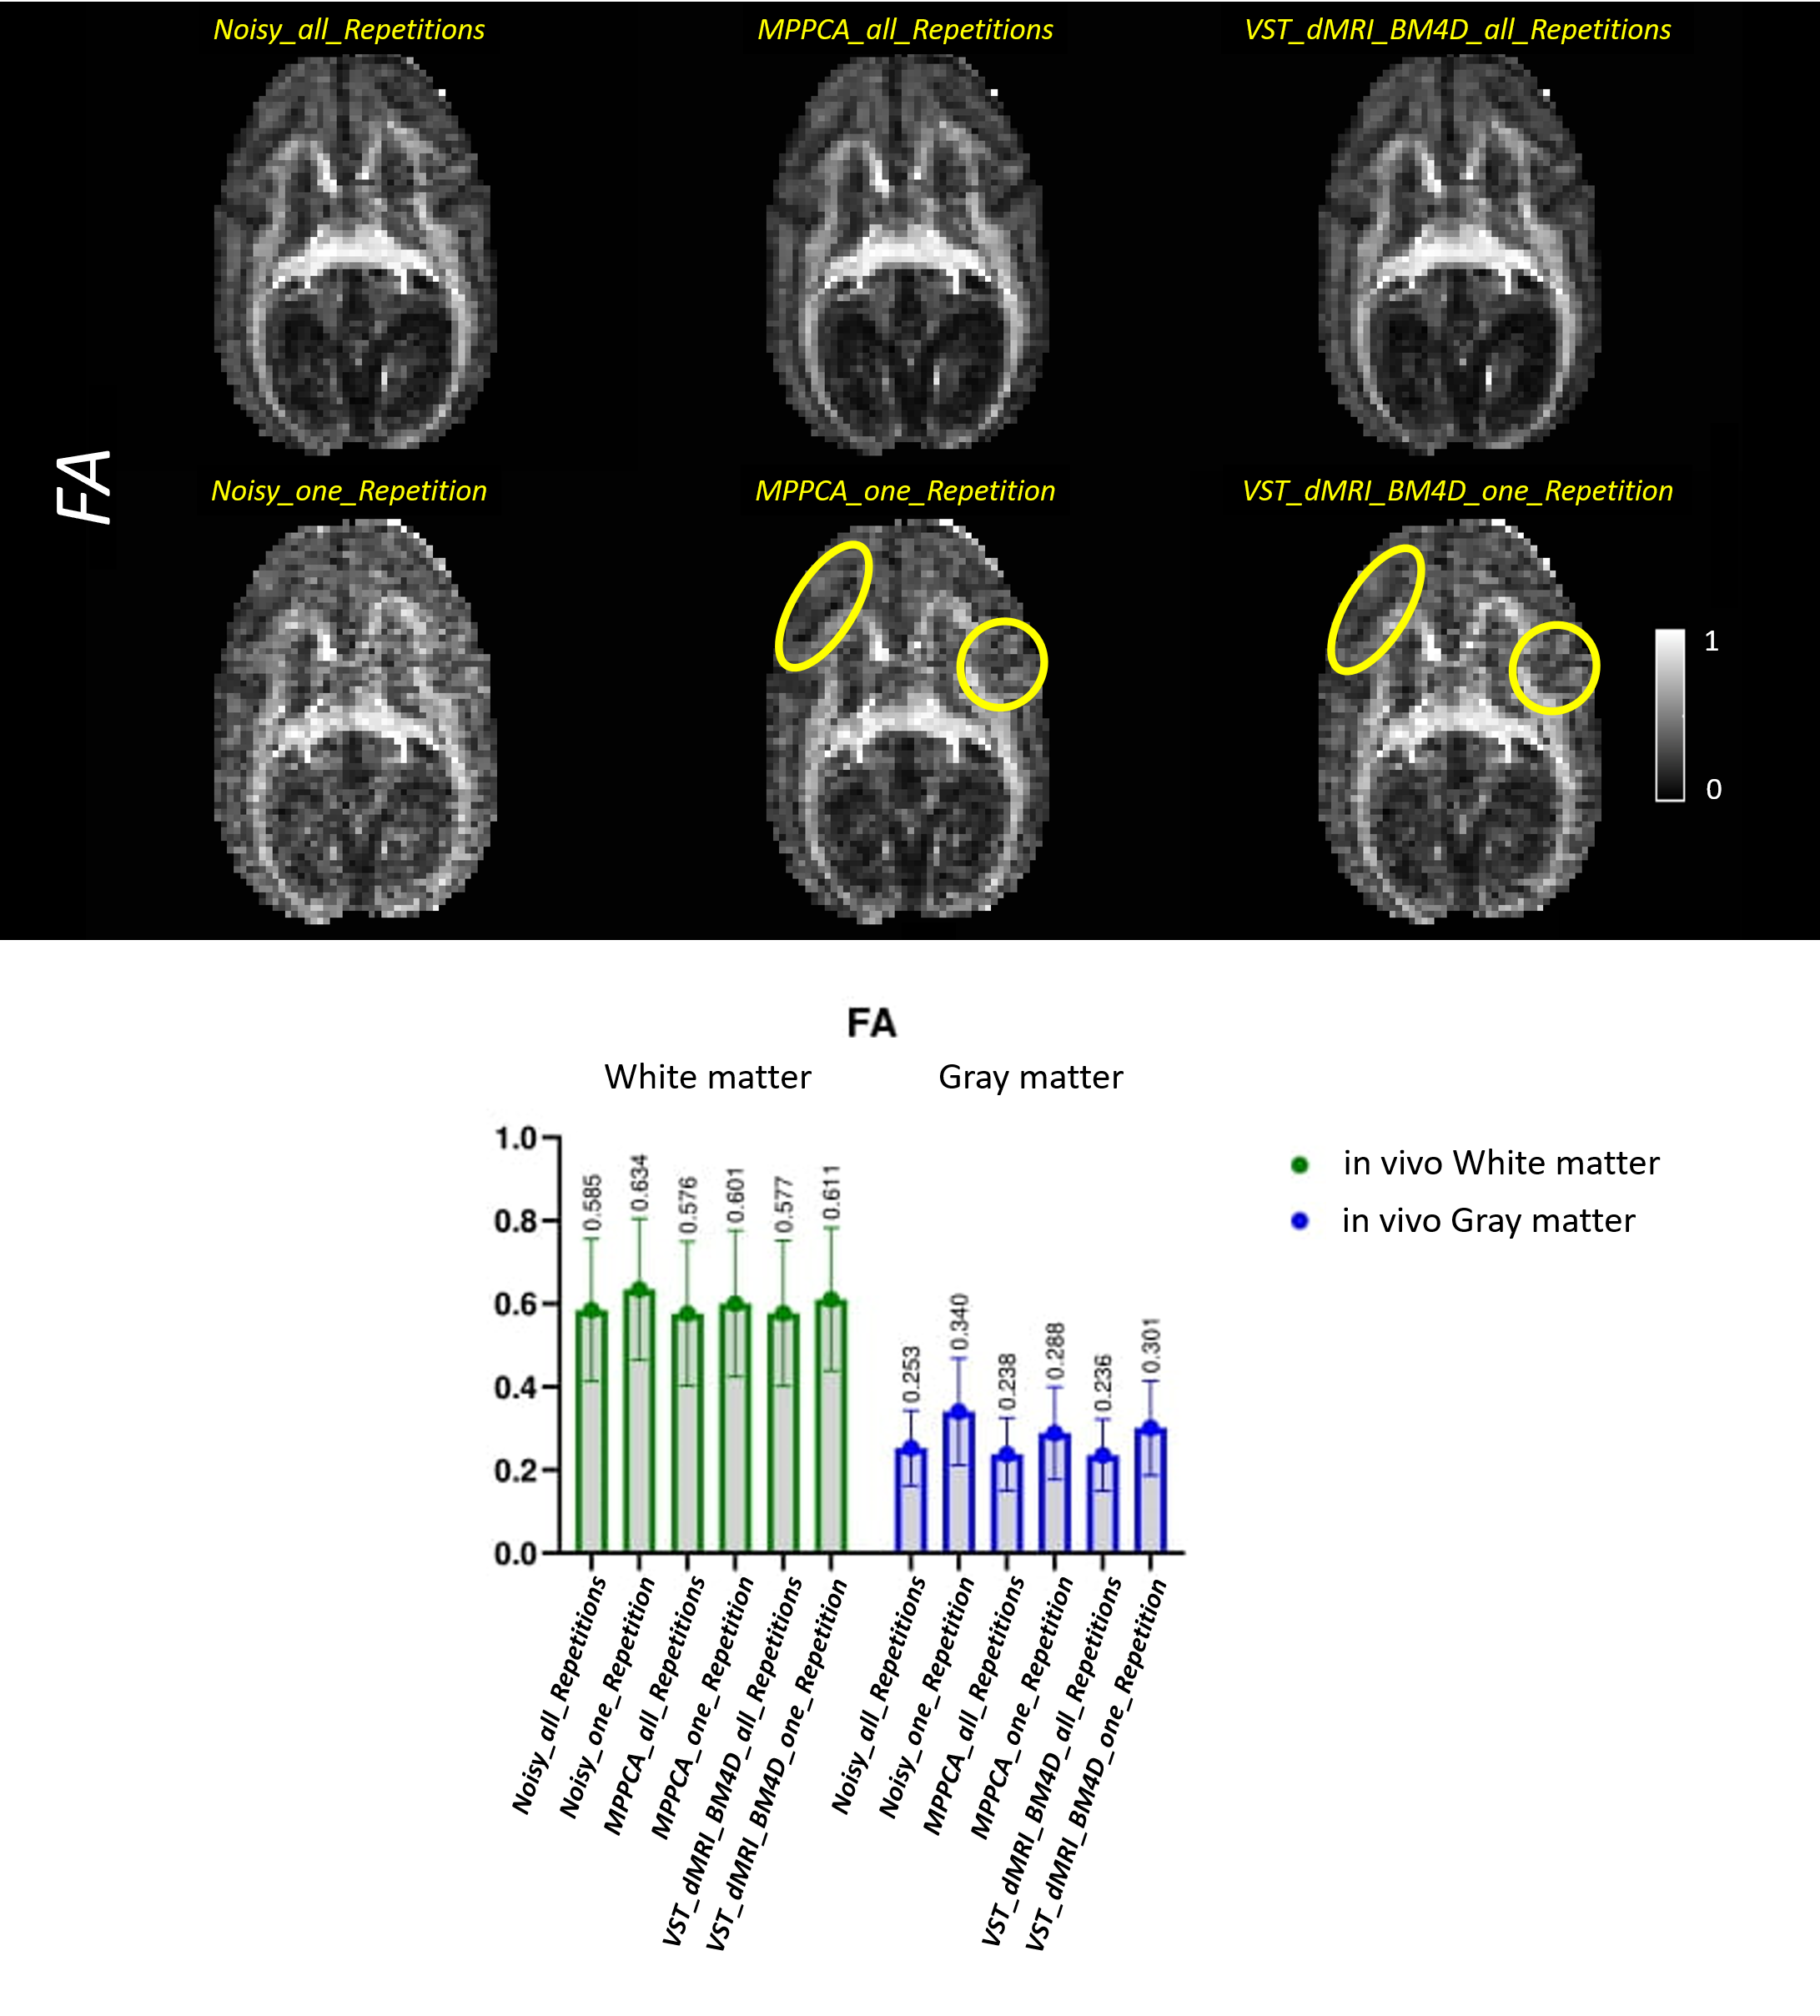
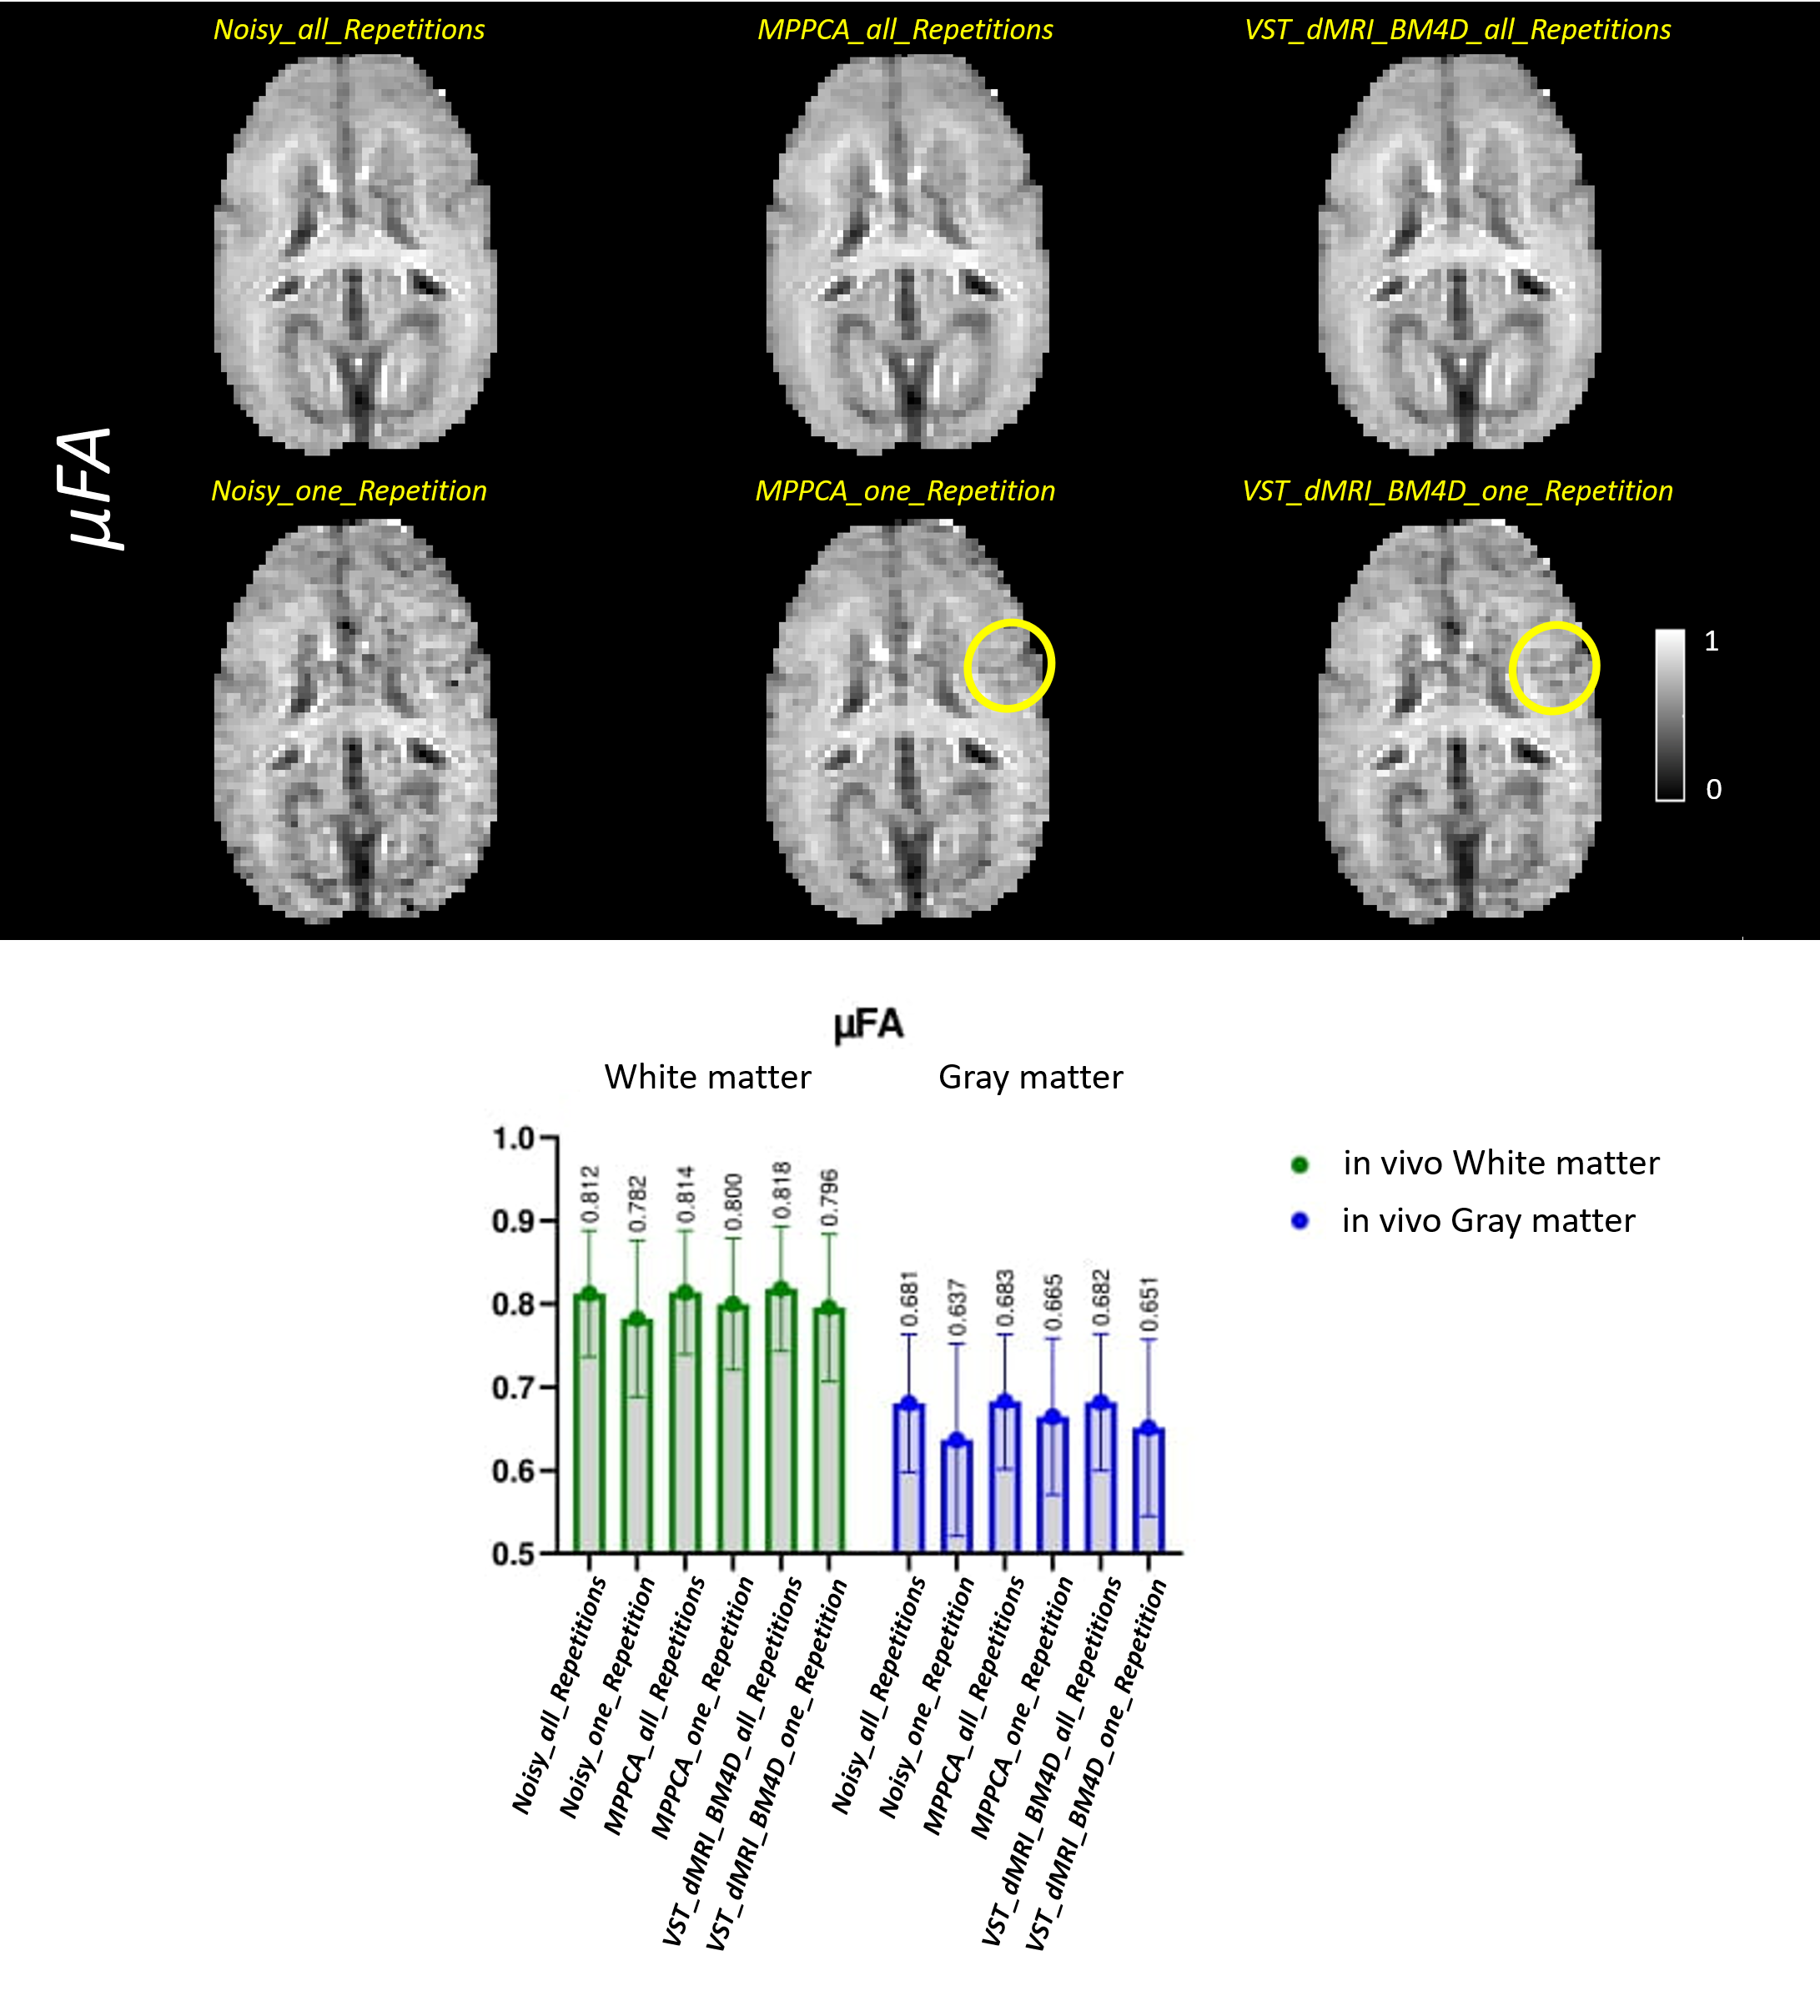
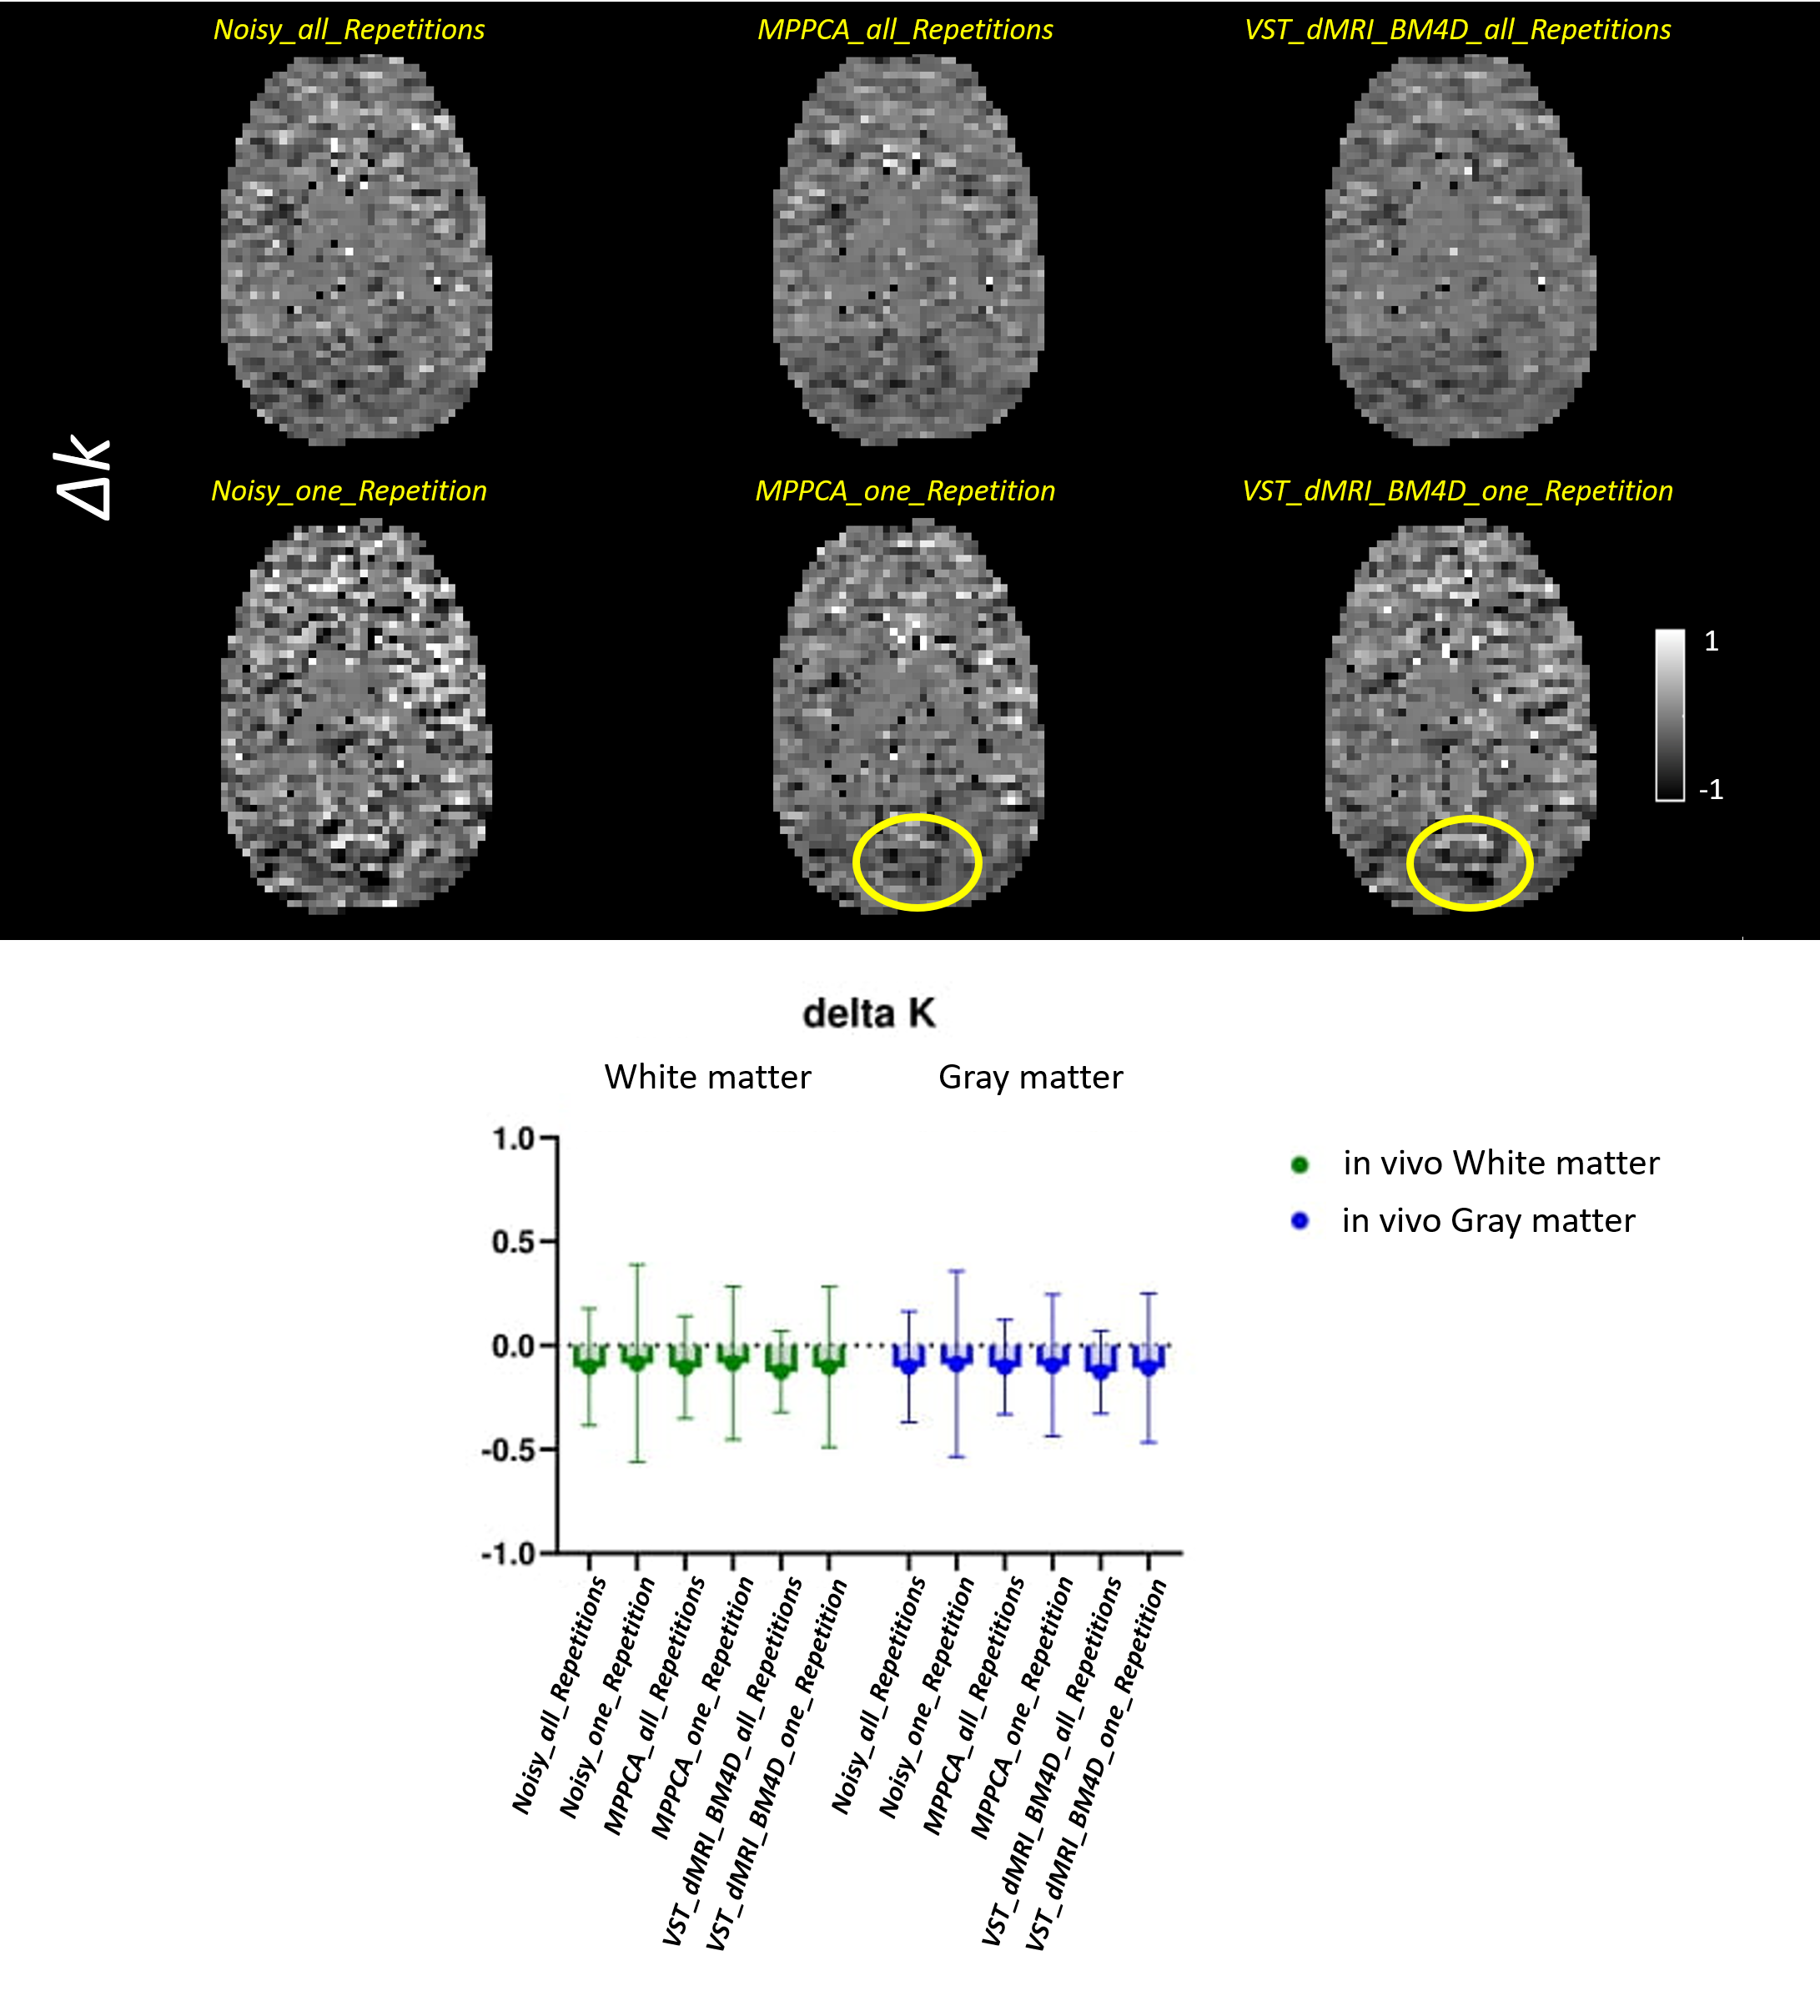
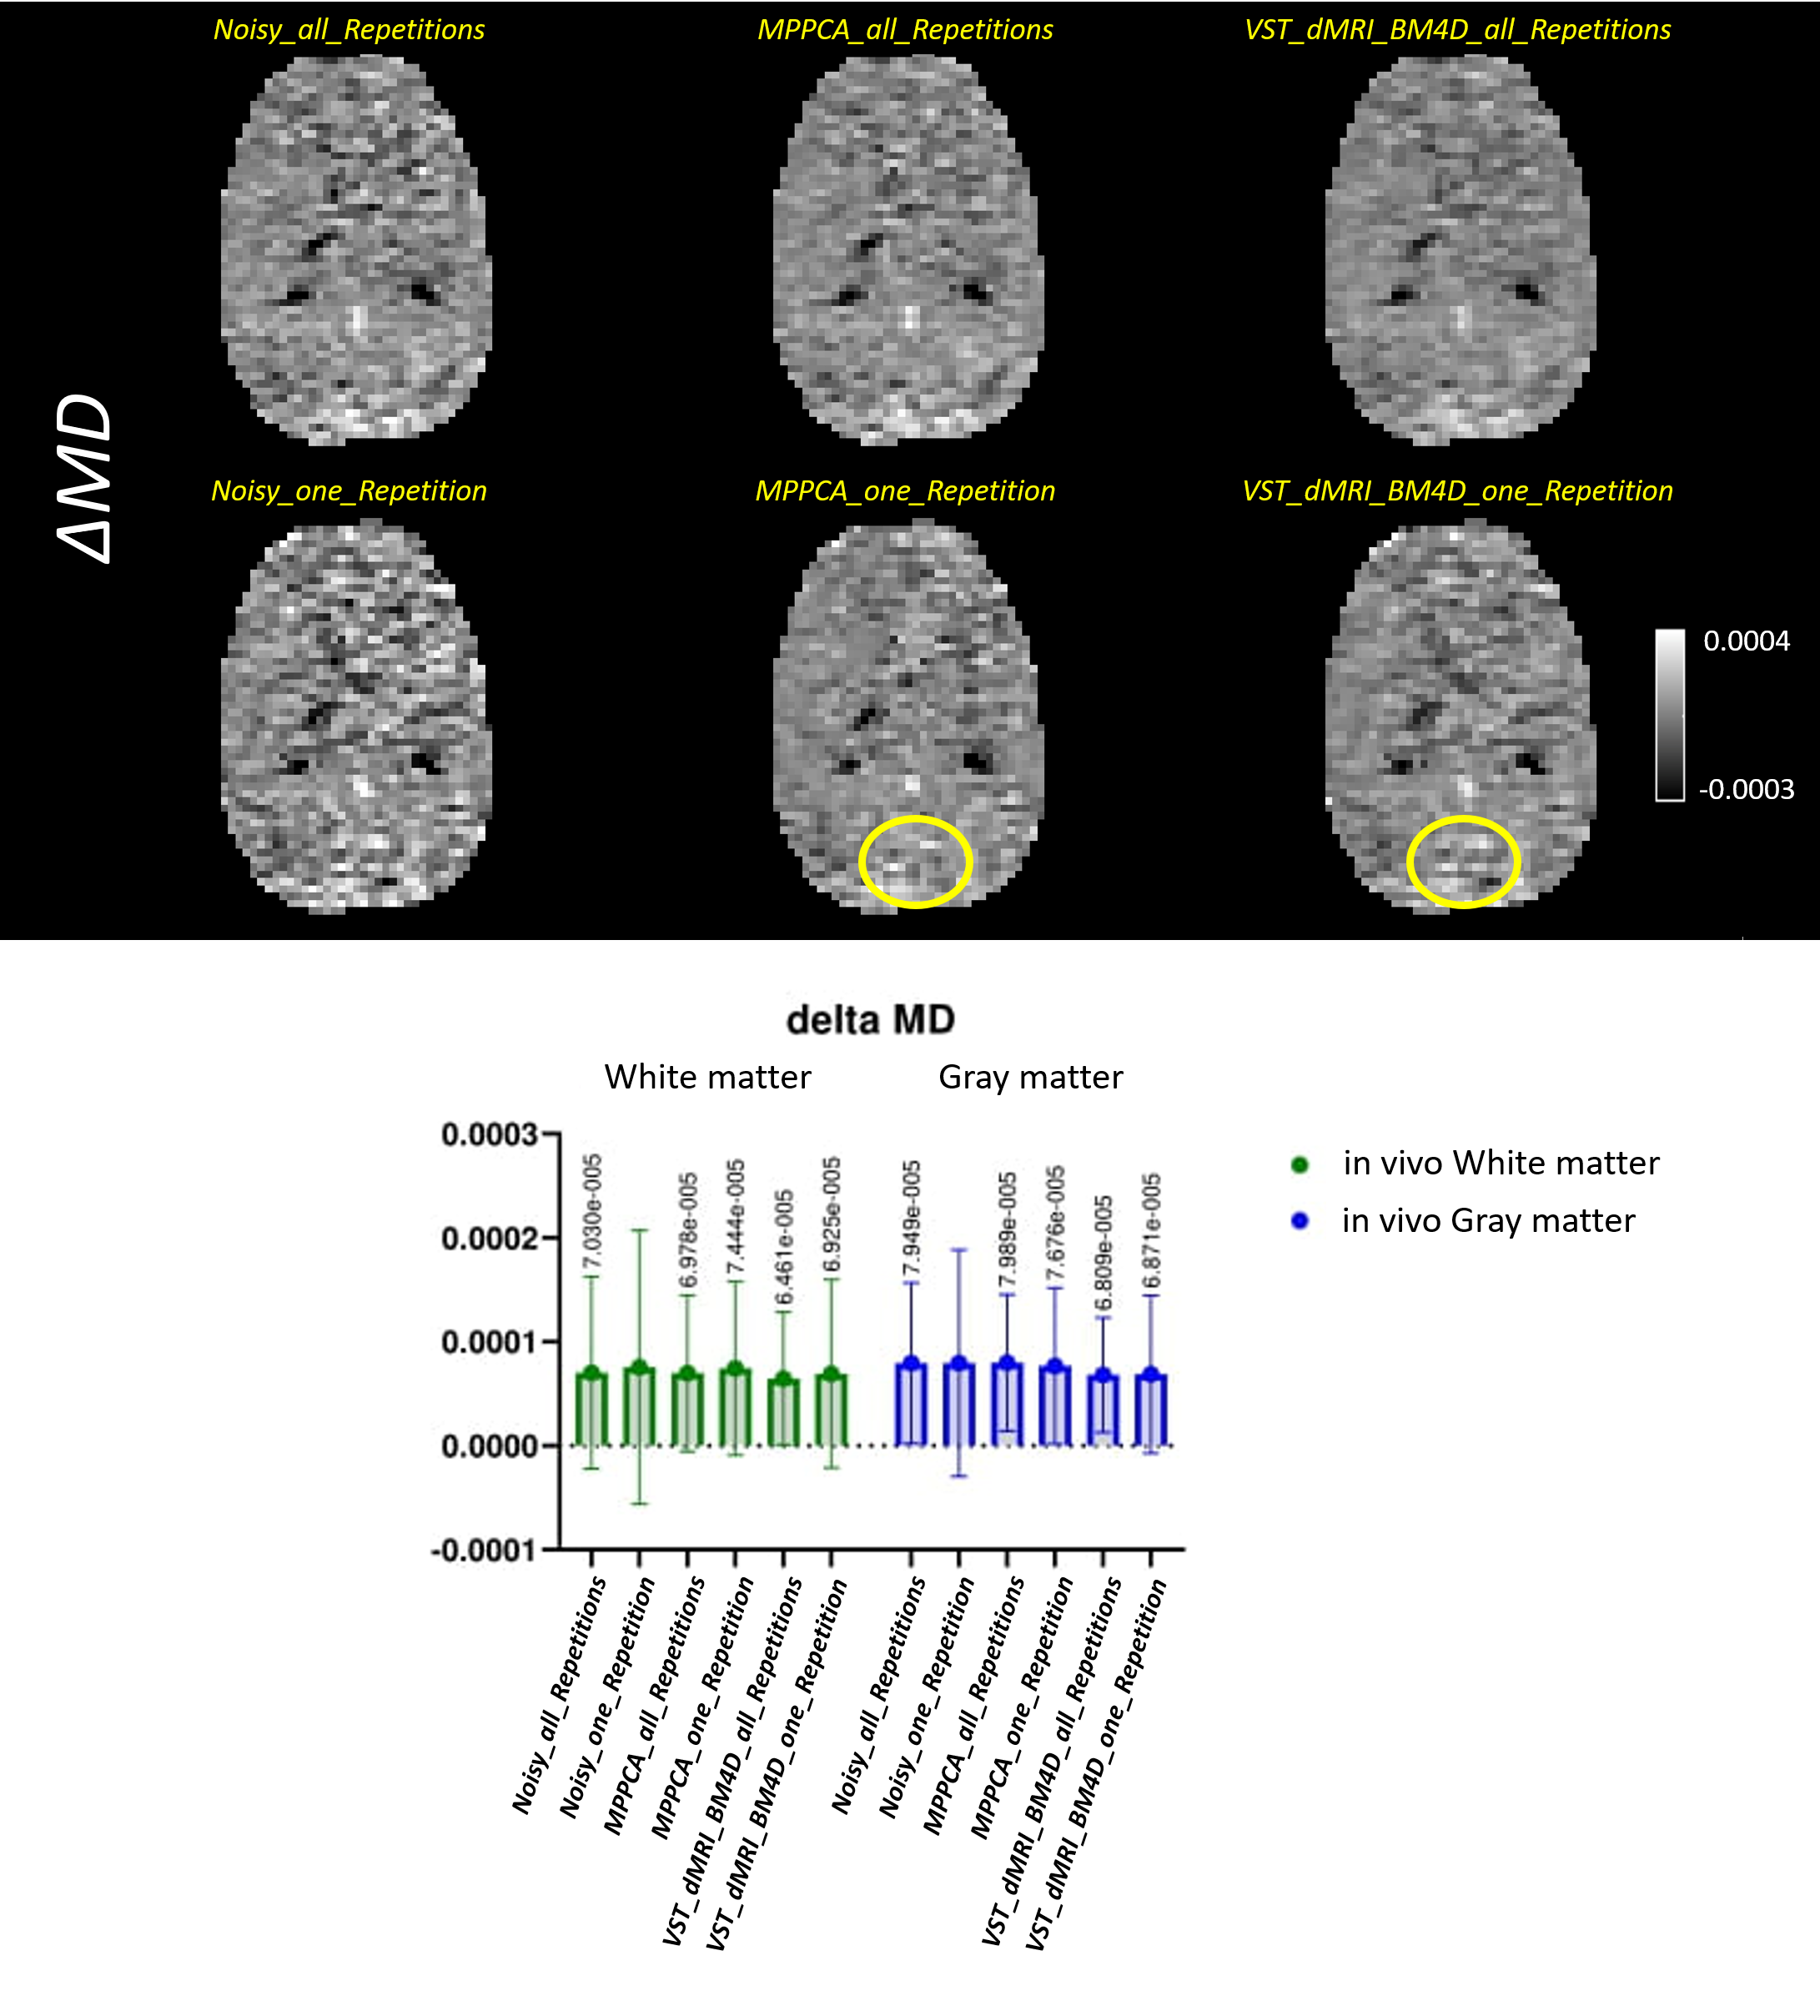
Figures 1 to 4 show the metrics FA, μFA (μFA protocol) , ΔK and ΔMD (OGSE protocol), respectively. ΔK and ΔMD are the difference between the metric calculated on the highest frequency DWI images (85Hz) and the PGSE in the OGSE protocol. The top of the figures exhibit the images for all corresponding methods. The bottom parts show, in a boxplot, the mean and standard deviation of the metrics calculated over two ROIs, cerebral white matter (WM) and cortical gray matter (GM).Discussion
Overall, both denoising methods (VST_dMRI_BM4D and MPPCA) accomplished similar results. Mean and standard deviation graphs show a coherent behavior, as the mean tends to be higher and the standard deviation lower when compared to the noisy data results. Moreover, graphs also show good and competing results for the denoised data when using only one repetition of the shells.Regarding the images, a similar analysis can be inferred. The denoised data using only one repetition present great results, with some regions presenting a better detail preservation. The images related to all repetitions are cleaner, but also indicate over smoothing of details. This can potentially indicate that less repetitions can be acquired, consequently reducing scan time.
Comparing VST_dMRI_BM4D and MPPCA results, both methods compete with each other equally. However, the regions indicated by the yellow circles may indicate a tiny better improvement when using the proposed method, especially on Figures 3 and 4, in which the cerebellum looks more evident.
Conclusion
In this work, we presented a different framework for denoising dMRI data by exploiting data redundancy and using a block similarity denoising algorithm. Results show the proposed method as a useful and competing tool. Further investigation and testing need to be done. Synthetic data modeling may take place to stablish a golden ground truth of results, allowing a better analysis of the outcome.Acknowledgements
This study was financed in part by the Coordenação de Aperfeiçoamento de Pessoal de Nível Superior - Brasil (CAPES) - Finance Code 001.References
1. Tales Santini, Naila Rahman, Alyson Shim, Wataru Inoue, Stefan Everling, and Corey Baron. Oscillating gradient (OGSE) and microscopic anisotropy diffusion in the in vivo and ex vivo marmoset brain. Paper presented at: International Society of Magnetic Resonance in Medicine 2022; London, England, UK.
2. Novikov, D. S., Jensen, J. H., Helpern, J. A. & Fieremans, E. Revealing mesoscopic structural universality with diffusion. Proc. Natl. Acad. Sci. 111, 5088–5093 (2014).
3. Baron, C. A. et al. Reduction of Diffusion-Weighted Imaging Contrast of Acute Ischemic Stroke at Short Diffusion Times. Stroke 46, 2136–2141 (2015).
4. Colvin, D. C. et al. New Insights into Tumor Microstructure Using Temporal Diffusion Spectroscopy. Cancer Res. 68, 5941–5947 (2008).
5. Ikenouchi, Y. et al. Evaluation of white matter microstructure in patients with Parkinson’s disease using microscopic fractional anisotropy. Neuroradiology 62, 197–203 (2020).
6. Veraart, J. et al. Denoising of diffusion MRI using random matrix theory. Neuroimage, 142, 394-406 (2016).
7. Maggioni, M. et al. Nonlocal transform-domain filter for volumetric data denoising and reconstruction. IEEE transactions on image processing, 22.1, 119-133 (2012).
8. Foi, A. Noise estimation and removal in MR imaging: The variance-stabilization approach. In: 2011 IEEE International symposium on biomedical imaging: from nano to macro. IEEE, 2011. p. 1809-1814.
9. Pieciak, T., Aja-Fernandez, S., and Vegas-Sanchez-Ferrero, G. Non-stationary Rician noise estimation in parallel MRI using a single image: a variance-stabilizing approach. IEEE transactions on pattern analysis and machine intelligence, 39.10, 2015-2029 (2016).
10. Zhao, Y. et al. Joint denoising of diffusion‐weighted images via structured low‐rank patch matrix approximation. Magnetic Resonance in Medicine, 88.6, 2461-2474 (2022).
Figures