4629
The Problem of Hidden Noise in MR Image Reconstruction1Signal and Image Processing Institute, Ming Hsieh Department of Electrical and Computer Engineering, University of Southern California, Los Angeles, CA, United States
Synopsis
Keywords: Image Reconstruction, Machine Learning/Artificial Intelligence
The performance of modern image reconstruction methods is commonly judged using quantitative error metrics like mean squared-error and the structural similarity index, where these error metrics are calculated by comparing a reconstruction against fully-sampled reference data. In practice, this reference data contains noise and is not a true gold standard. In this work, we demonstrate that this “hidden noise” can confound performance assessment methods, leading to image quality degradations when typical error metrics are used to tune image reconstruction performance. We also demonstrate that a new error metric, based on the non-central chi distribution, helps resolve this issue.INTRODUCTION
In the image reconstruction literature, it is commonplace to judge the quality of reconstruction methods using performance metrics like mean-squared error (MSE), mean absolute error (MAE), and structural similarity (SSIM). These metrics are also frequently used to tune reconstruction parameters, with parameters selected to optimize these metrics for training datasets.Calculation of MSE, MAE, and SSIM requires comparing a reconstructed image with a reference image, and fully-sampled MRI data is typically used as the reference. However, real MRI data will always contain noise. We call this “hidden noise,” since conventional error metrics would treat it as part of the reference, rather than properly treating it as error.
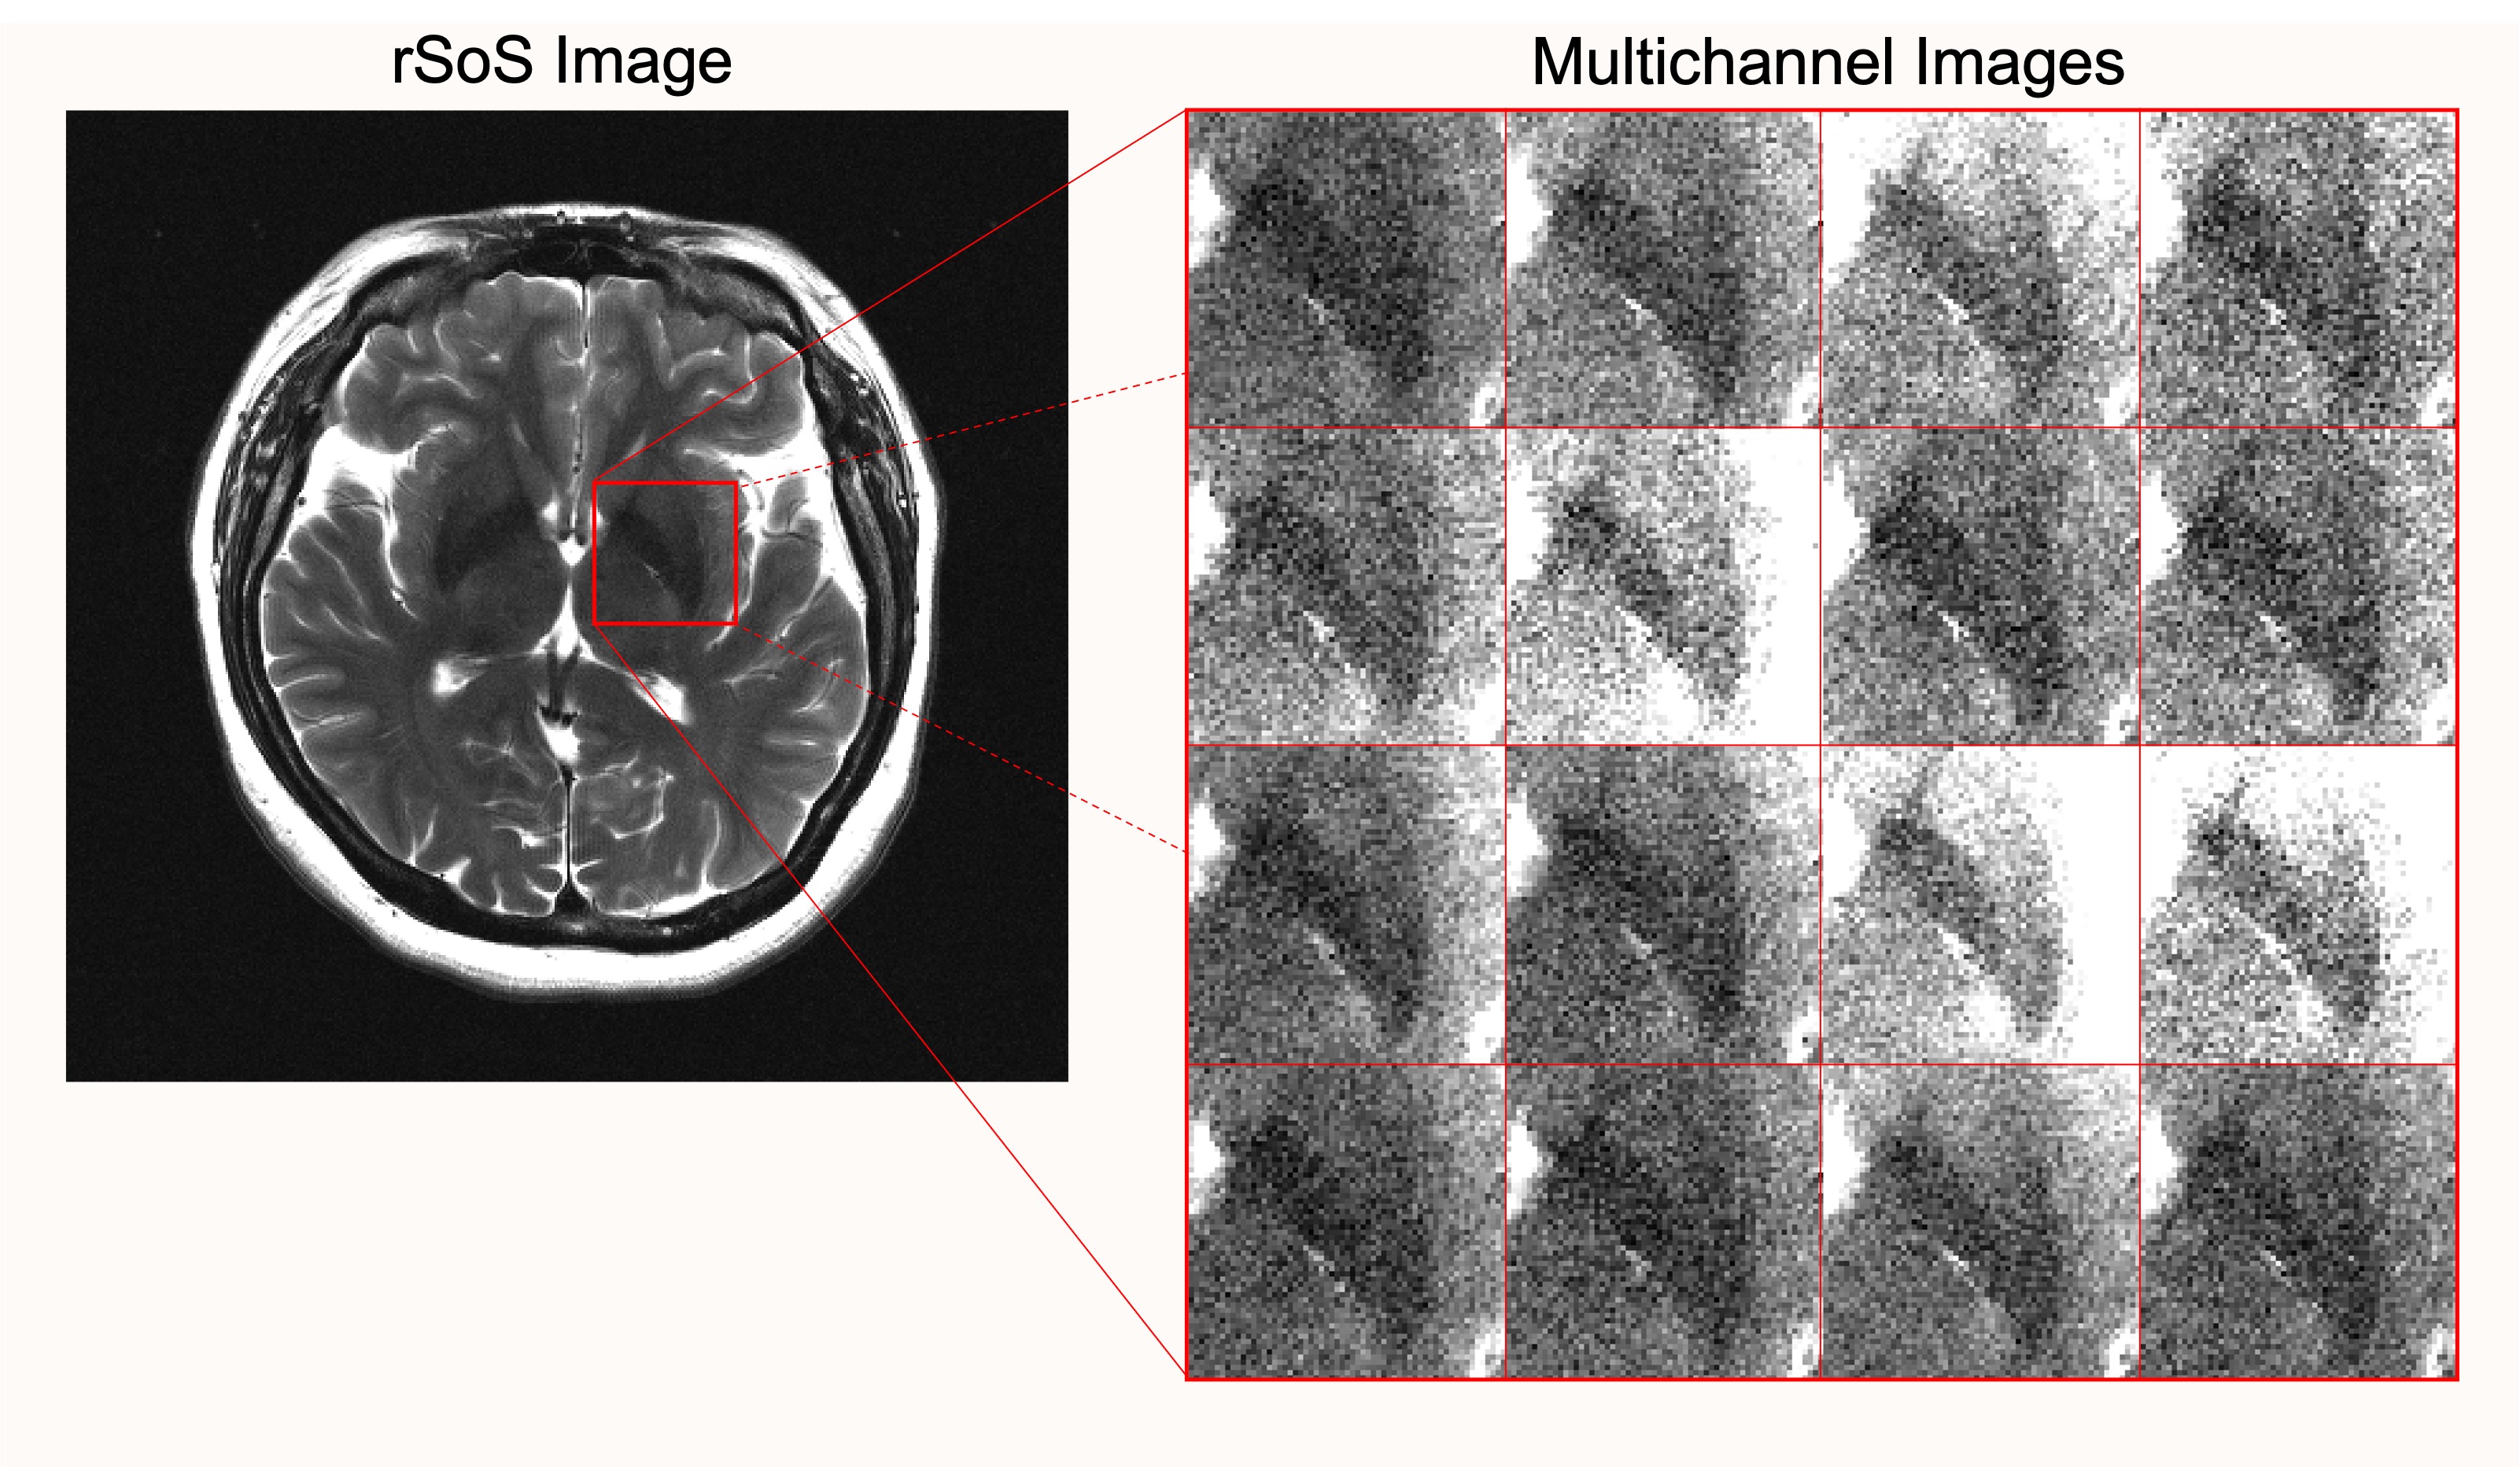
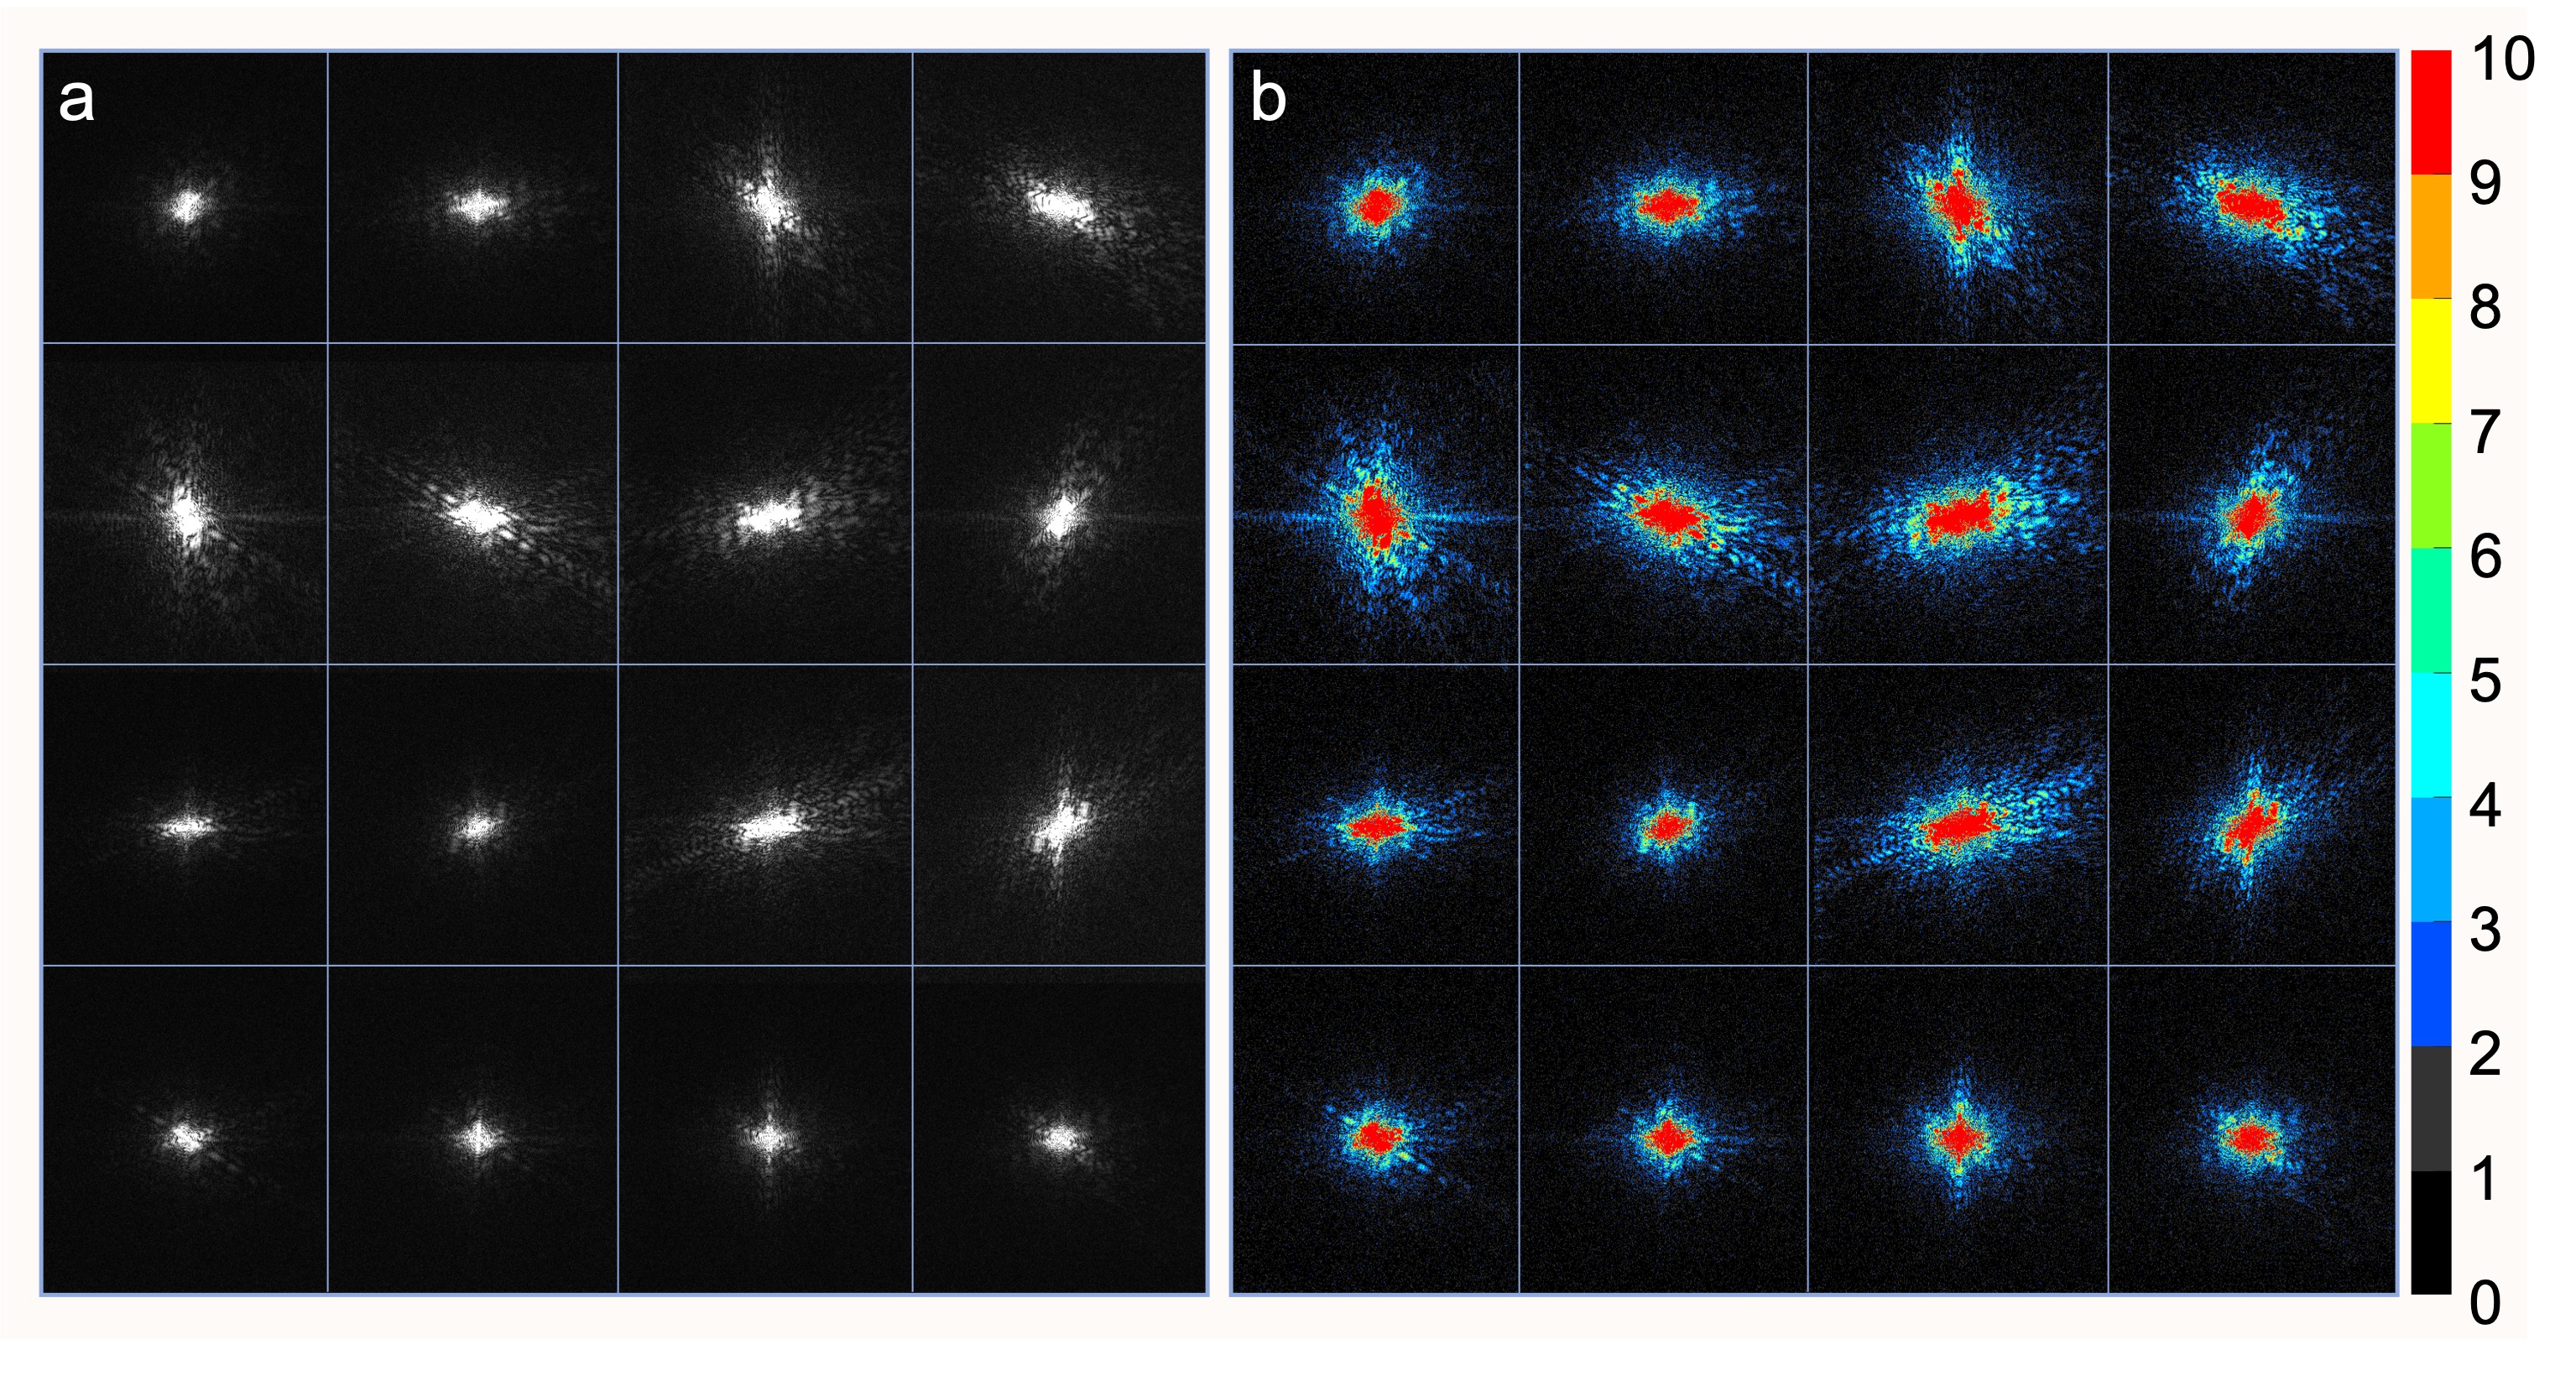
Importantly, hidden noise can be substantial, even when it is not visually obvious. To illustrate, Fig. 1 shows a typical multichannel brain MRI dataset from the widely-used fastMRI database1. While the root sum-of-squares (rSoS) image (a common choice of reference image in the modern literature) visually appears to have excellent SNR, closer examination demonstrates that there is substantial noise present in the individual channels. This implies that the pristine appearance of the rSoS image is misleading, and hides a substantial noise bias. (Note that rSoS images should follow the non-central chi distribution,2,3 with a biased mean value). Hidden noise is also evident in k-space, as illustrated in Fig. 2, which demonstrates that the SNR is small (<2) for substantial portions of k-space and suggests that high-frequency data is unreliable.
In this work, we investigate how this hidden noise can impact the assessment of image reconstruction performance. Importantly, we observe that the effects of hidden noise can mislead the interpretation of results. This can cause different reconstruction methods to be ranked incorrectly, leading to suboptimal reconstruction quality when standard performance metrics are used to optimize reconstruction performance. However, we also demonstrate that a novel metric based on the non-central chi distribution does not have the same confounds.
METHODS
We performed two separate experiments to assess the impact of hidden noise.In the first experiment, we acquired a standard fully-sampled MPRAGE dataset. In order to obtain both a typical reference dataset (to emulate standard performance assessment with a noisy reference) and a high-SNR reference dataset (to more accurately assess performance), the data was acquired with five averages. A single average was used to create the typical (noisy) reference, while all averages (with additional SVD-based denoising) were used for the high-SNR reference. To emulate a typical parameter tuning application in accelerated image reconstruction, the single-average k-space data was retrospectively undersampled (acceleration factor 3), and images were reconstructed using Autocalibrated LORAKS4 with many different regularization parameter choices. We then compared how well the conventional MSE, MAE, and SSIM metrics obtained using the noisy reference compared against metrics obtained using the averaged reference. We also compared against a novel performance metric obtained using the negative log-likelihood of the non-central chi distribution.2,3
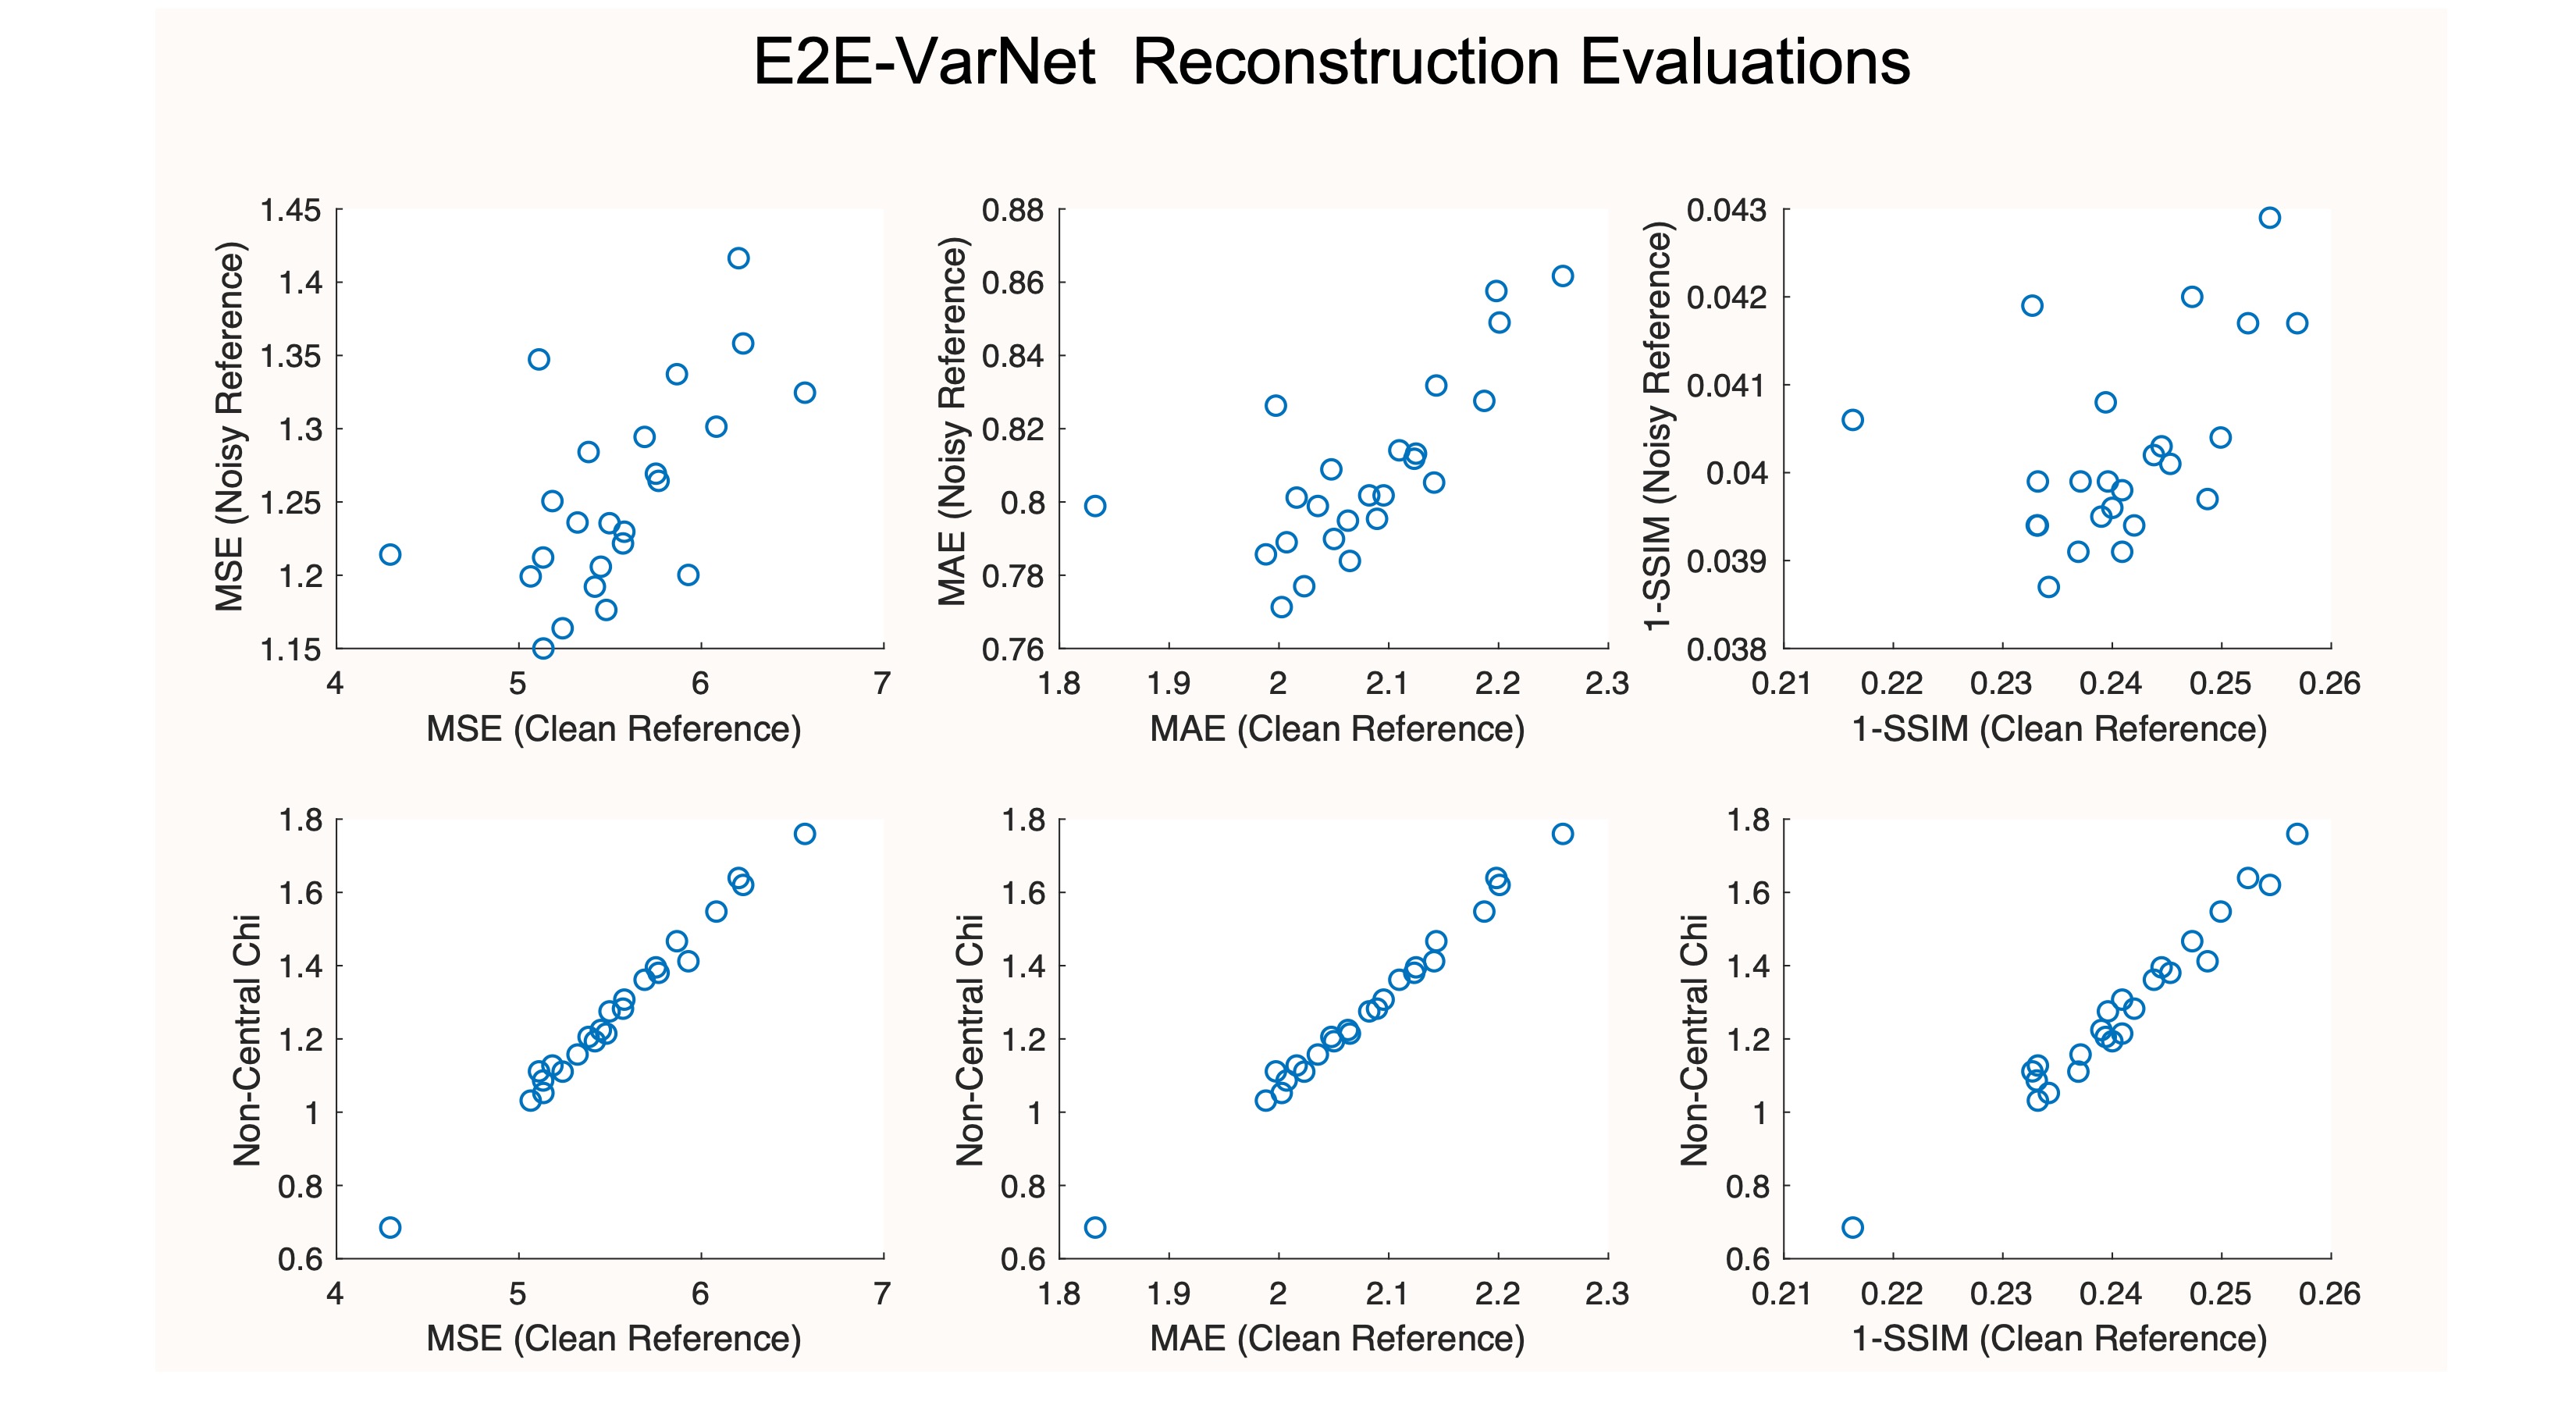
In the second experiment, we applied SURE-LET denoising5 to 3400 slices of multichannel T2-weighted brain images from fastMRI to create synthetic high-SNR reference images. We then added simulated Gaussian noise following the original noise statistics back to these synthetic datasets to create realistic noisy data. The noisy datasets were then retrospectively undersampled (acceleration factor 4), and we trained an image reconstruction neural network (E2E-VarNet6) using the noisy data, with a 3000:200:200 split for training, validation, and testing. We created 24 different VarNets using different choices of loss function (MSE or MAE), different numbers of training epochs, and different numbers of cascades. We compared MSE, MAE, and SSIM metrics obtained using noisy reference images against metrics obtained using clean reference images, and also compared against our novel non-central chi metric.
RESULTS
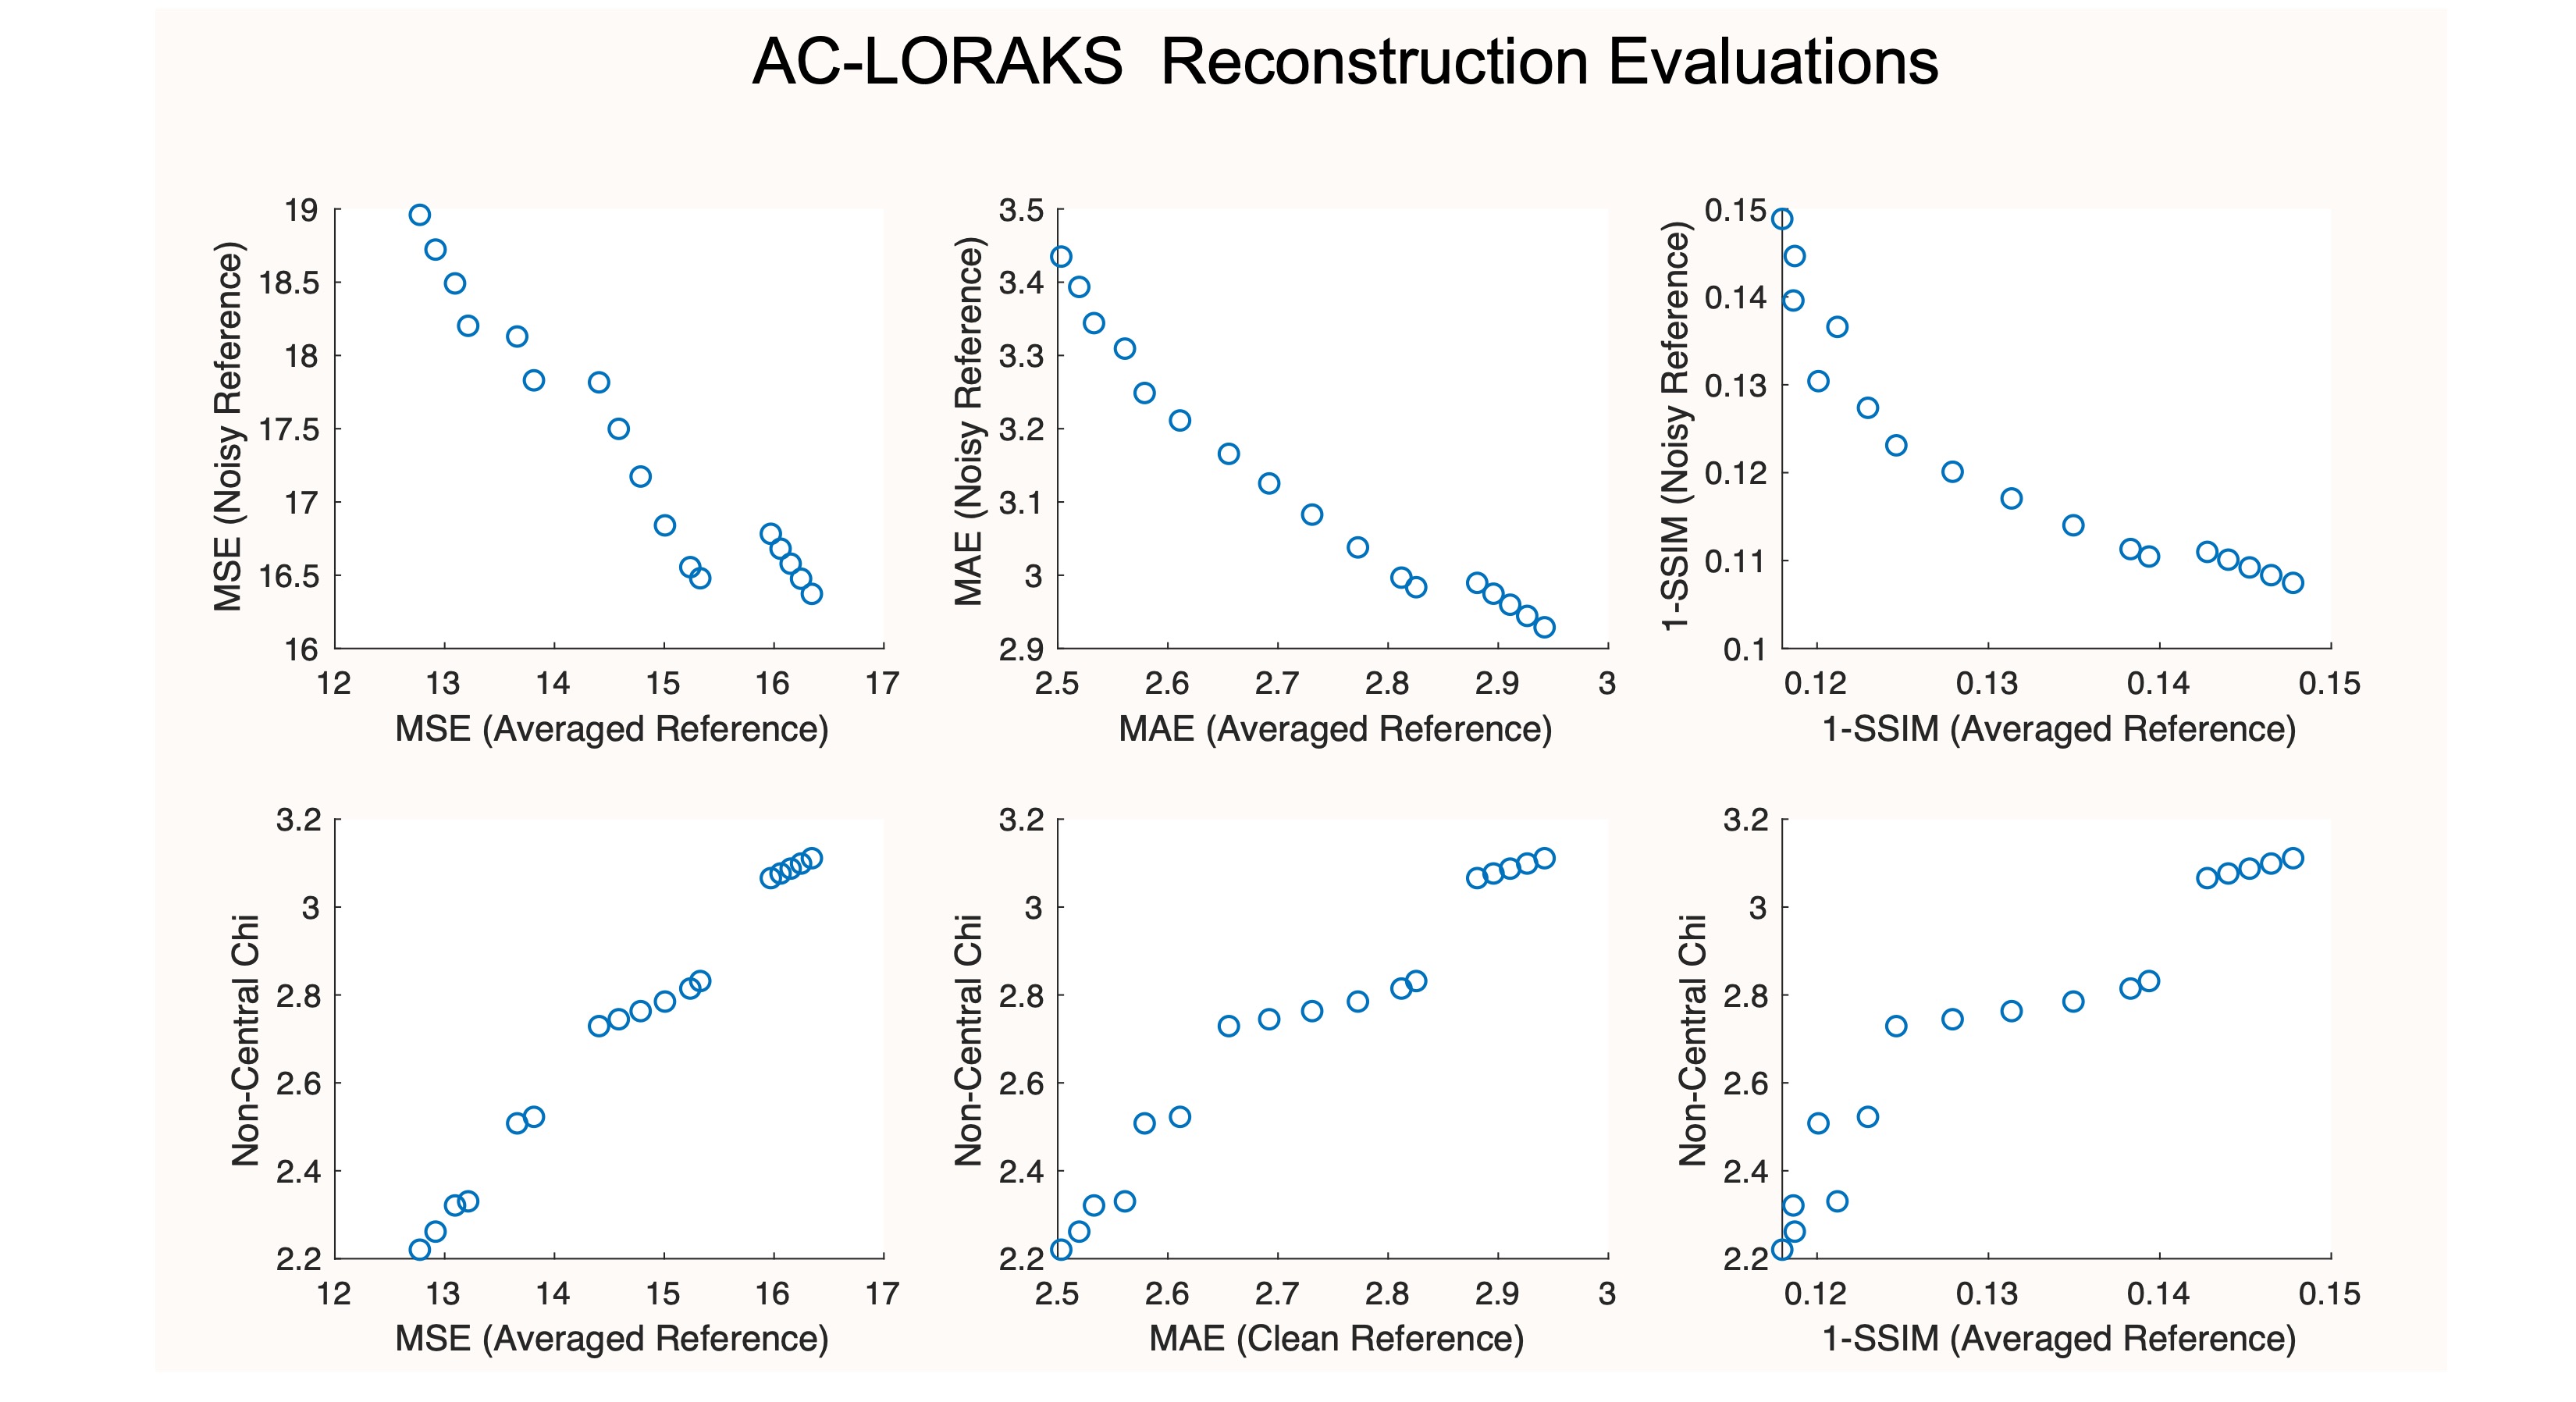
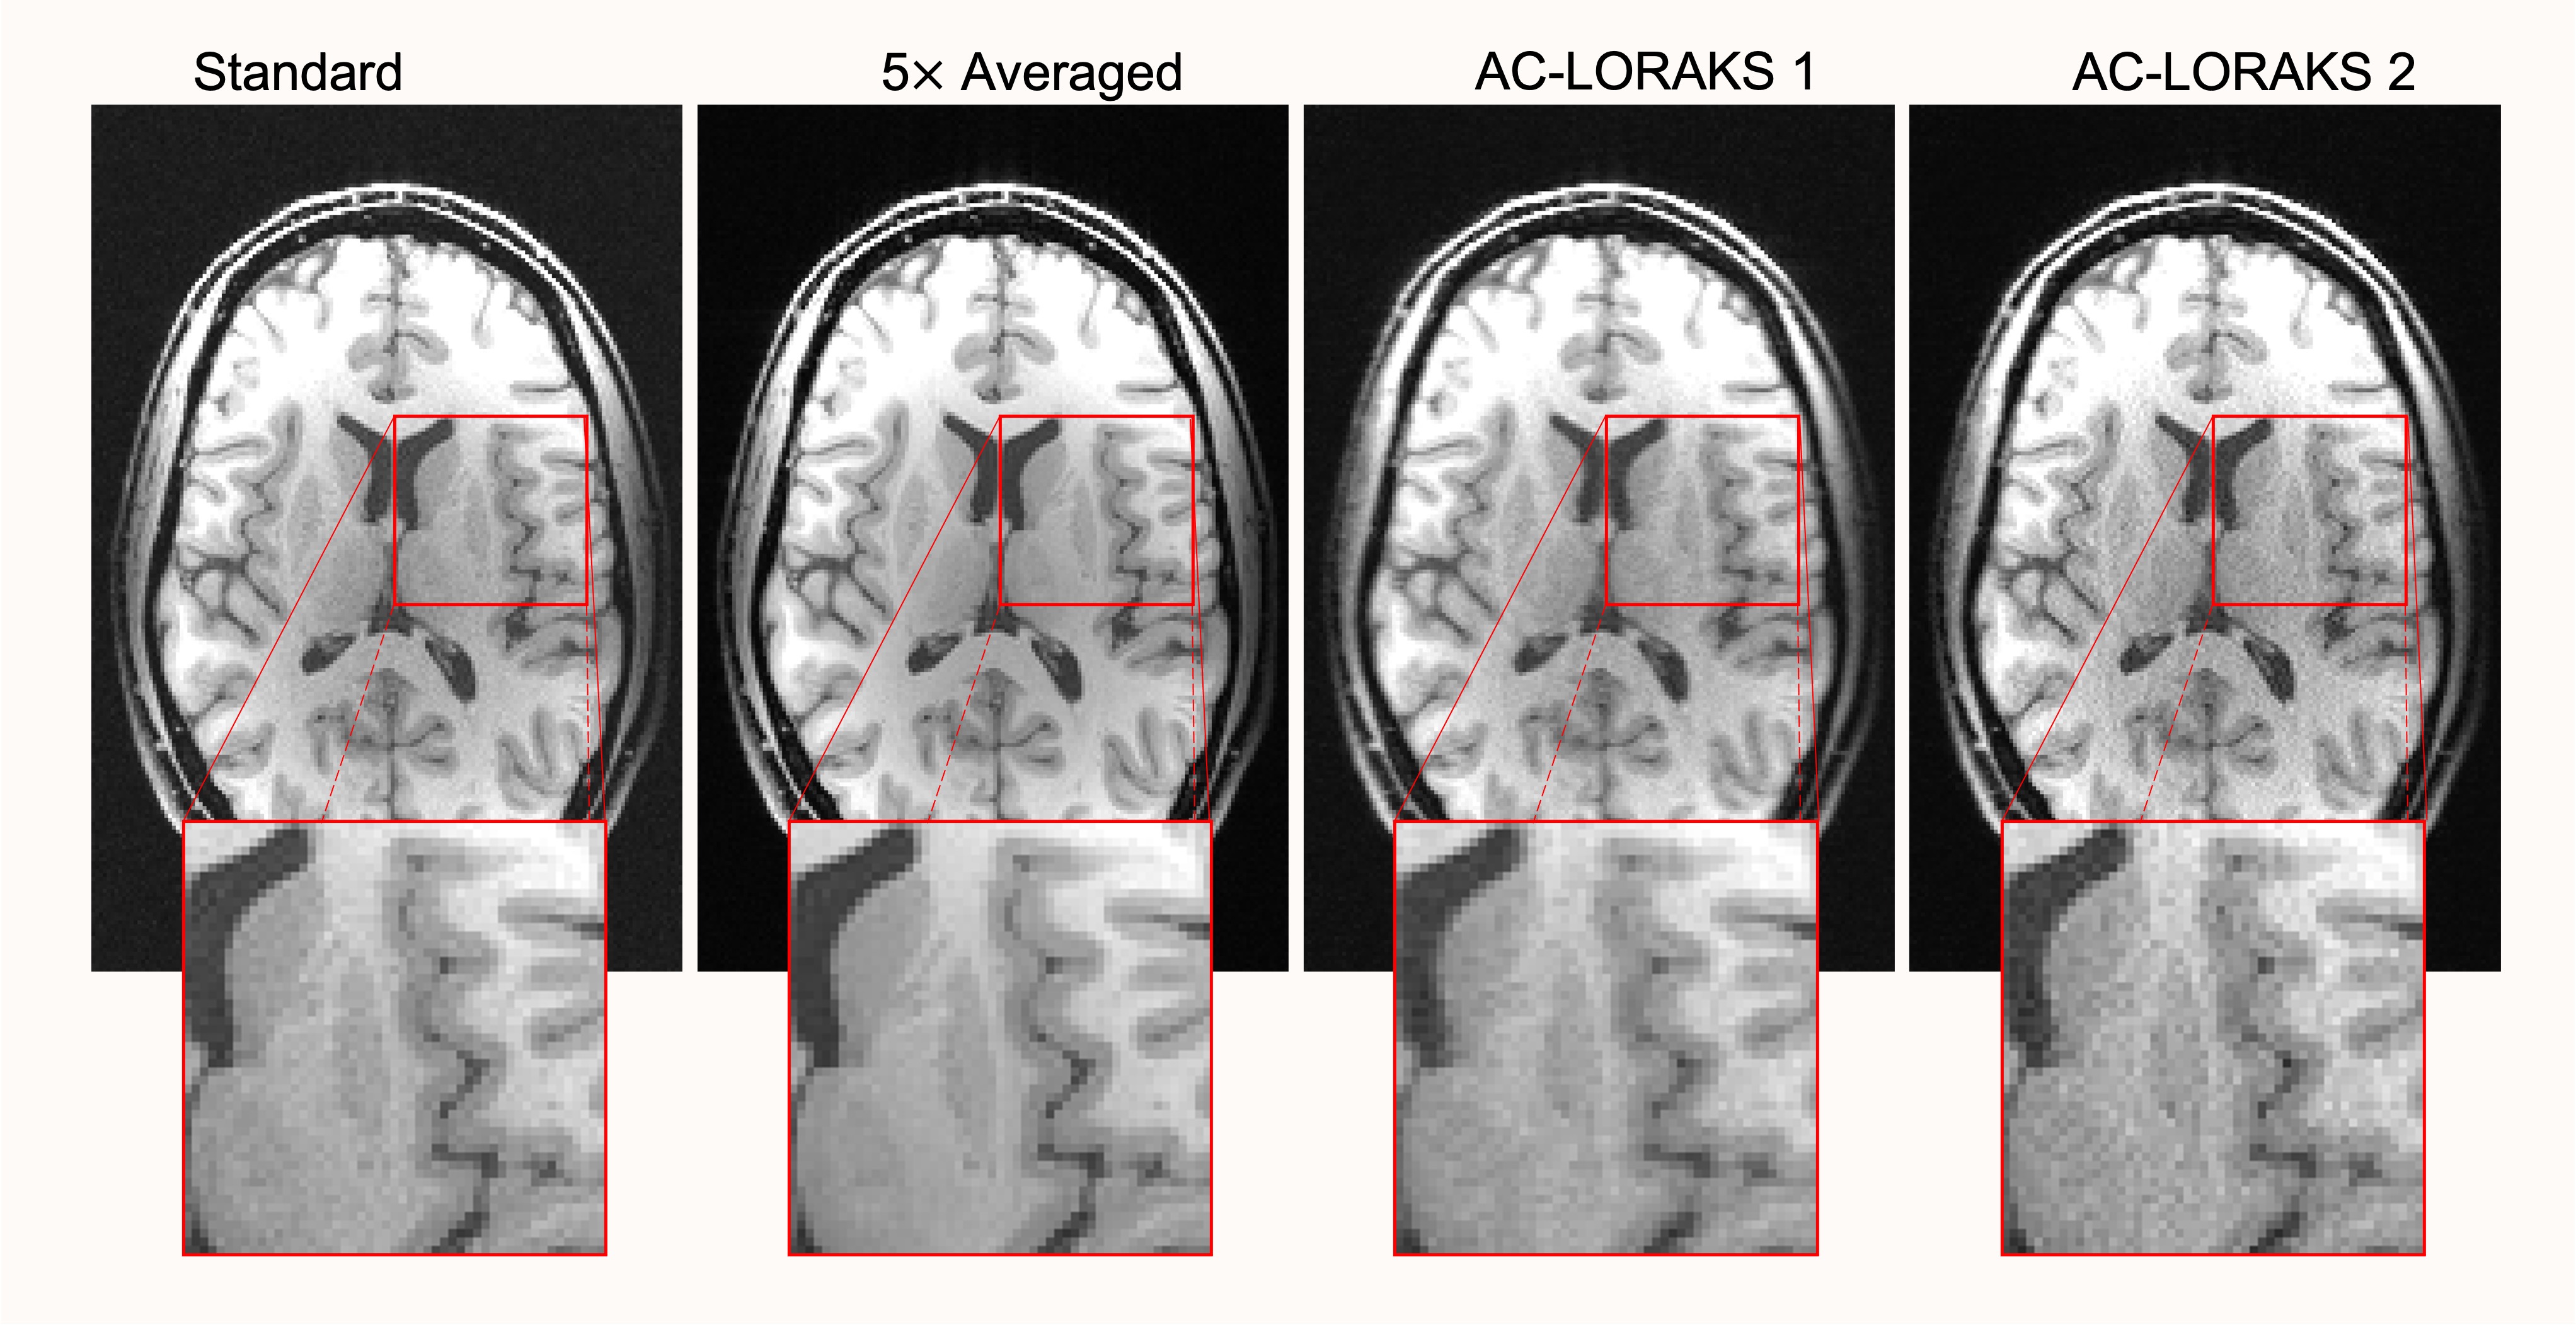
Figure 3 shows the results of the first (Autocalibrated LORAKS) experiment. We observe that error metrics obtained with the averaged reference have poor correspondence with the error metrics obtained with the typical noisy reference. Indeed, the metrics are negatively correlated, implying that tuning the regularization parameter based on the noisy reference would degrade image quality. In contrast, our proposed non-central chi metric had excellent correspondence with the error metrics computed using the averaged reference. The impact this has on optimal parameter tuning is shown in Fig. 4, which demonstrates that choosing the regularization parameter based on the non-central chi metric leads to a sharper-looking image, while choosing the regularization parameter based on conventional metrics leads to a blurrier-looking image.Figure 5 shows results of the second experiment. We again observe that standard error metrics calculated with a noisy reference have poor correspondence with error metrics calculated with a clean reference, while our non-central chi metric had much stronger correlation with the clean error metrics.
CONCLUSIONS
Our results demonstrate that, although hidden noise is usually neglected in the modern reconstruction literature, it can substantially confound the assessment of image reconstruction performance. Under the conventional paradigm, this will lead to suboptimal ranking of different reconstructions and unnecessary degradations in image quality. These issues can be mitigated by using a novel metric that is cognizant of noise in the reference data. Our findings suggest that there may be substantial advantages to changing the prevailing paradigm for ranking reconstruction methods.Acknowledgements
This work was supported in part by NIH grants R01-MH116173 and R01-NS074980, the Ming Hsieh Institute for Research on Engineering-Medicine for Cancer, and a USC Annenberg Graduate Fellowship.References
[1] Zbontar J et al. fastMRI: An open dataset and benchmarks for accelerated MRI. arXiv:1811.08839.
[2] Aja-Fernandez S, Vegas-Sanchez-Ferrero, G. Statistical Analysis of Noise in MRI: Modeling, Filtering and Estimation. Springer International Publishing Switzerland, 2016.
[3] Varadarajan D, Haldar JP. A majorize-minimize framework for Rician and non-central chi MR images. IEEE Trans Med Imaging 34:2191-2202, 2015.
[4] Haldar JP. “Autocalibrated LORAKS for fast constrained MRI reconstruction,” in Proc. IEEE Int. Symp. Biomed. Imag. 2015, pp. 910–913.
[5] Blu T, Luisier F. The SURE-LET Approach to Image Denoising. IEEE Trans Image Process. 16:2778-2786, 2007.
[6] Sriram A et al. "End-to-end variational networks for accelerated MRI reconstruction," in Proc. MICCAI 2020, pp. 64-73.
Figures