4615
The effect of AIF and tissue time-course temporal alignment on pharmacokinetic model trans-cytolemmal water exchange sensitivity
Xin Li1, Wei Huang1, William D. Rooney1, and Charles S Springer1
1Advanced Imaging Research Center, Oregon Health & Science University, Portland, OR, United States
1Advanced Imaging Research Center, Oregon Health & Science University, Portland, OR, United States
Synopsis
Keywords: Data Analysis, DSC & DCE Perfusion
Using DCE modeling to quantify prostate transcytolemmal water exchange effect faces the challenges of often insufficient interstitial contrast agent concentration as well as suboptimal temporal resolution. Using ultra-high temporal resolution prostate DCE data, the goal of this work is to investigate the impact of DCE-MRI temporal alignment between the arterial input function (AIF) and the tissue time-courses on water exchange quantification. Results here show that when perfect alignment is not achievable in practice, an earlier AIF bolus arrival bias will generally reduce the capability for water-exchange quantification using DCE-MRI.Introduction
Trans-cytolemmal water exchange effect in the prostate has been investigated using dynamic contrast-enhanced (DCE) MRI1,2 with limited success. Besides the often insufficient contrast agent (CA) concentration in the interstitium due to practical and safety considerations, suboptimal temporal resolution also limits DCE pharmacokinetic modeling in quantifying the water exchange effect. Using ultra-high temporal resolution prostate DCE data, the goal of this work is to investigate the impact of DCE-MRI temporal alignment between the arterial input function (AIF) and the tissue time-courses on this issue. Our results show that when perfect alignment is hard to achieve practically, an earlier AIF bolus arrival bias will generally reduce the ability for water-exchange quantification.Methods
Seven subjects underwent 3T (Siemens) prostate multi‑parametric MRI (mpMRI) with an endorectal RF coil after informed consent. The DCE data were acquired using a 3D TurboFLASH pulse sequence with a 192*144*20 matrix size and a 270 mm * 203 mm * 60 mm FOV, resulting in (1.4 mm)2 in-plane resolution and 3 mm slice thickness. Other parameters were: TR/TE/FA: 2.28 ms/0.89 ms/8º, image frame sampling interval: 1.55 s. A 0.1 mmol/kg CA (Prohance; Bracco) bolus was administered starting ~30 s after commencing the DCE-MRI sequence. The total acquisition time was ~3.6 minutes for a total of 140 imaging volumes. Five mpMRI visible lesions from five subjects were confirmed by clinical biopsies. Regions-of-interests (ROIs) were drawn on post-CA DCE images directly. Each individual AIF time-course was obtained from a small ROI completely within the femoral artery. The amplitude of the AIF was then scaled using the obturator muscle as reference tissue.1 Voxel-by-voxel pharmacokinetic modeling of the DCE data employed the Shutter-Speed Model (SSM).3 The unidirectional cellular water efflux rate constant kio was quantified in addition to the CA transfer constant, Ktrans, and the extravascular, extracellular volume fraction, ve.Results
Figure 1a shows a representative post-CA DCE image. The location of the lesion ROI enclosing the entire enhancing area is indicated with a red arrow. The location of the contralateral normal-appearing (NA) ROI is indicated with the green arrow. Panels b and c show representative voxel DCE time-course data (filled symbols) with fitting curves for the lesion and NA, respectively. The SSM fitted parameter values for the lesion voxel are: Ktrans = 0.71 (min-1); ve = 0.27; kio =3.7 (s-1). Those for the NA voxel are: Ktrans = 0.065 (min-1); ve = 0.26; kio =2.3 (s-1). Temporal shifts of the individually determined AIFs were then performed manually to create artificial temporal mis-alignment between the AIF and the tissue time-courses. Figure 2 shows three fittings of the same two voxel data as those in Fig.1, but with an AIF earlier (blue) by two time-frames (3.1s) and later (black) by two time-frames, respectively, besides the best temporal-matched one (red). For clarity, only every 4th data point is plotted here. As expected, the blue curve rate-of-change is generally less than the black one, especially during the CA uptake period. Using kio = 50 (s-1) cutoff, which is generally too large for reliable kio quantification using in vivo DCE MRI, the fraction of voxels with kio > 50 (s-1) for each ROI was calculated. Figure 3 summarizes the lesion and NA group fraction means with error bars for standard deviation. As the AIF temporally shifted from leading, to matching, to lagging the tissue time-courses, a clear trend of decreased kio > 50 (s-1) fraction is observed.Discussion
In this work, the effect of temporal alignment of AIF and tissue DCE time-course on kio quantification is investigated. A two-frame temporal shift of 3.1 s is approximately one half of the temporal resolution of ≥ 6.0 s routinely used in clinical prostate DCE-MRI. This shift therefore approximates a potential intrinsic uncertainty in CA bolus arrival time determination associated with a clinical DCE-MRI protocol. Our results indicate that when an AIF leading the tissue curve bias occurs, the model-fitted curve accelerates more slowly than with a lagging bias during CA uptake. That is, pharmacokinetic modeling with an AIF leading the tissue curve will result in a lower CA concentration in the interstitium during the bolus passage. The water exchange system is more likely to stay in the fast-exchange-limit condition (larger apparent kio). In other words, when perfect alignment is impossible, an AIF temporal bias to the right (or lagging) will favor the exchange sensitivity and thus the precision in quantifying kio. With fast DCE sequences like the golden-angle radial sparse parallel MRI4 available for clinical use, prostate DCE-MRI with a temporal resolution under 2.0 s is becoming increasingly practical. This will greatly reduce the mismatch uncertainties in AIF and tissue temporal signatures and improve water exchange quantification.Acknowledgements
Grant Support:
Brenden-Colson Center for Pancreatic Care.
Oregon Clinical and Translational Research Institute, NIH/NCATS.
NIH R01 CA248192
Thorsten Feiweier (Siemens) for providing the work-in-progress sequence for DWI data acquisition.
References
1. Li, Priest, Woodward, Tagge, Siddiqui, Huang, Rooney, Beer, Garzotto, Springer, Magn. Reson. Med. 69:171-178 (2013).
2. Li, Cai, Moloney, Chen, Huang, Woods, Coakley, Rooney, Garzotto, Springer, J. Magn. Reson. 269: 104-112 (2016).
3. Yankeelov, Rooney, Li, Springer, Magn. Reson. Med. 50:1151-69 (2003).
4. Feng, Grimm, Block, Chandarana, Kim, Xu, Axel, Sodickson, Otazo. Magn Reson Med. 72:707-17 (2014).
Figures
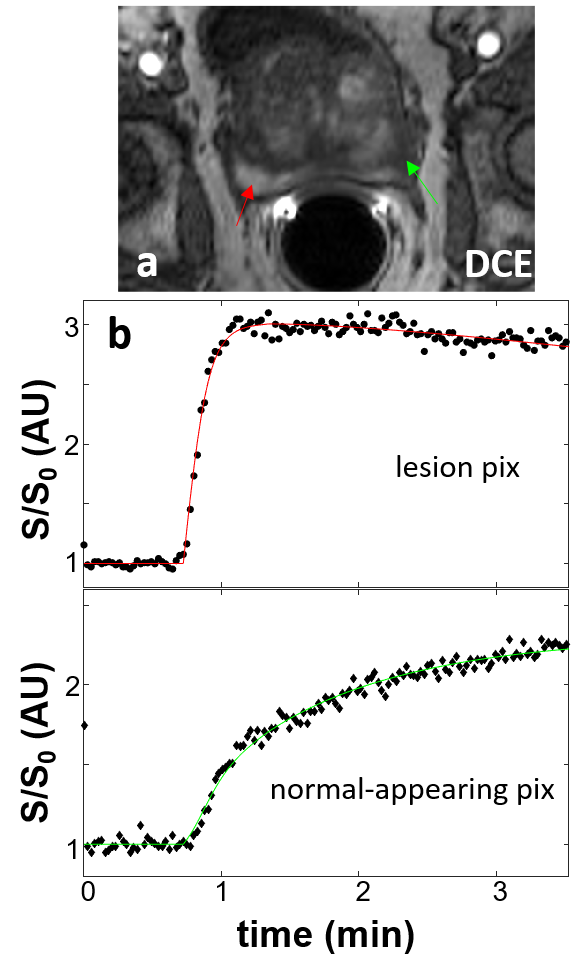
Figure 1. Panel a shows a
representative post-CA DCE image. The location
of the lesion ROI enclosing the entire enhancing area is indicated with a red
arrow and that for the contralateral normal appearing (NA) ROI is indicated
with the green arrow. Panels b and c show representative voxel DCE time-course data (filled symbols)
with SSM fitting curves for the lesion and NA, respectively.
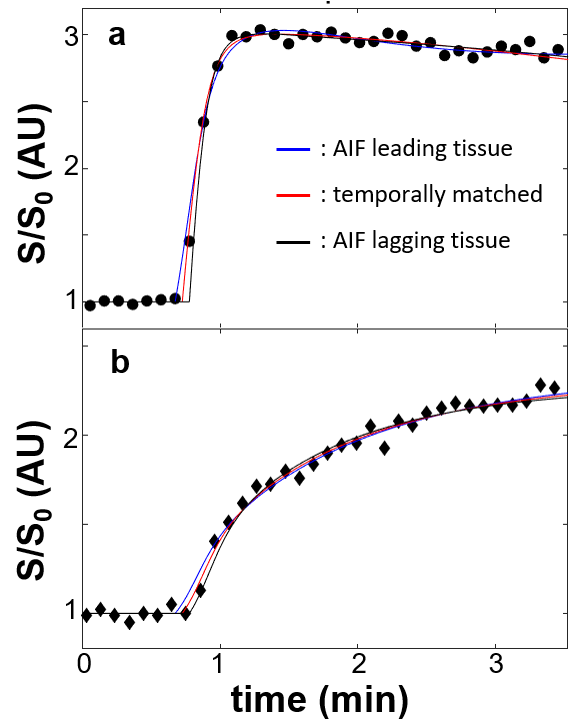
Figure 2. Three
fitting results of the same voxels as those in Fig. 1 are shown: a, lesion; b, NA. The blue curves
represent fittings with an artificial AIF temporal bias of 3.1 s (two frames)
earlier than the tissue data and black ones for the artificial AIF bias of 3.1
s later. The red curves represent fitting results with manually determined temporal-matched
AIF. Compared to Fig. 1, only every 4th data points are plotted here
for visual clarity.
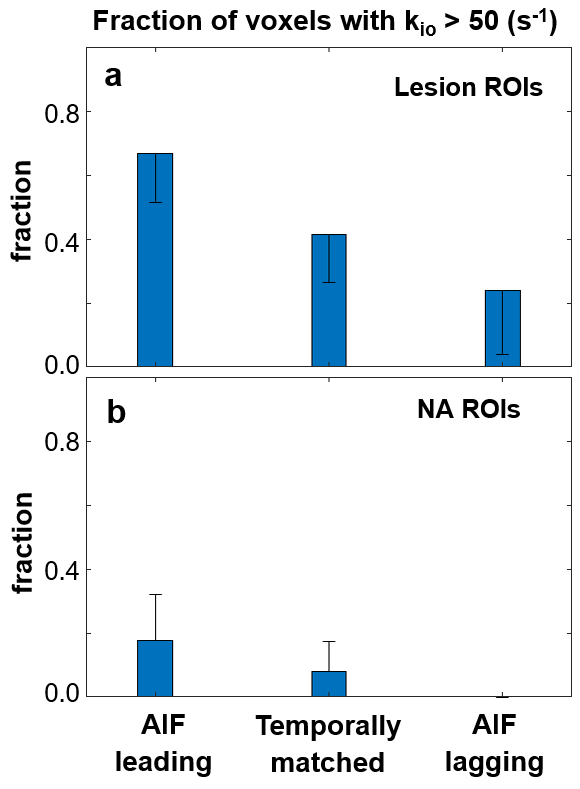
Figure 3. The column graph shows mean values of the fraction of voxels with kio
> 50 (s-1) in the ROIs for the lesion and NA groups (N = 5 for
both) in a and b, respectively. Error bars represent standard deviations. As the
AIF was temporally shifted from leading, to matching, to lagging the tissue
time-courses, a clear trend of decreased kio > 50 (s-1)
fraction is observed.
DOI: https://doi.org/10.58530/2023/4615