4614
Differential quantification of cortical and medullary perfusion through Gaussian Mixture Model based segmentation on transplanted renal MRI
Anne Oyarzun-Domeño1,2, Izaskun Cía 1, Rebeca Echeverria-Chasco2,3, María A. Fernández-Seara2,3, Paloma L. Martin-Moreno2,4, Nuria Garcia-Fernandez2,4, Gorka Bastarrika2,3, Javier Navallas1,2, and Arantxa Villanueva1,2,5
1Electrical, Electronics and Communications Engineering, Public University of Navarre, Pamplona, Spain, 2Health Research Insitute of Navarra, IdiSNA, Pamplona, Spain, 3Department of Radiology, Clínica Universidad de Navarra, Pamplona, Spain, 4Department of Nephrology, Clínica Universidad de Navarra, Pamplona, Spain, 5Institute of Smart Cities (ISC), Pamplona, Spain
1Electrical, Electronics and Communications Engineering, Public University of Navarre, Pamplona, Spain, 2Health Research Insitute of Navarra, IdiSNA, Pamplona, Spain, 3Department of Radiology, Clínica Universidad de Navarra, Pamplona, Spain, 4Department of Nephrology, Clínica Universidad de Navarra, Pamplona, Spain, 5Institute of Smart Cities (ISC), Pamplona, Spain
Synopsis
Keywords: Data Processing, Perfusion
Renal perfusion quantification is of importance in the post-operative surveillance of the allograft in translated patients. Together with cortical perfusion measurement, there is a strong interest in the quantification of medullary perfusion values, which requires an additional segmentation step of renal compartments. We applied Gaussian Mixture Models over renal MRI dataset to automatically extract the labels for each compartment to separately calculate cortical and medullary perfusion values. Proposed method showed performance metrics above 85% against ground truth labels and correlation coefficient above 96% and 58% for cortical and medullary perfusion values comparing with ground truth perfusion values.Introduction
Renal MRI technique serves as a non-invasive functional MRI biomarker of the renal allograft, presenting high clinical applicability in Renal Blood Flow (RBF) monitoring. RBF quantification involves manual segmentation of the kidney and its compartments, usually presenting low corticomedullary differentiation. This process is time-consuming and prone-to-error. Many ASL-MRI studies have measured cortical perfusion values, but few of them covered measurements in the medulla1. In this work, we used Gaussian Mixture Models (GMM) on the pixel gray values of T1 maps, in order to separate these regions and quantify tissue-dependant RBF.Methods
Dataset. ASL-MRI scans were performed on a 3T Skyra (Siemens, Erlangen, Germany) using an 18-channel body-array coil. Perfusion images were acquired using a pseudo continuous arterial spin labeling (PCASL) sequence with background suppression (BS) and spin-echo echoplanar (SE-EPI) readout. The classical inversion recovery (IR) scheme was used to acquire voxel-wise mapping of T1-weighted (T1-w) image relaxation time of the kidney. Data from 16 patients was used, with an acquisition matrix of 96 x 96 and 3 slices. Each dataset contained a M0 reference image and 50 (25 controls and 25 labels) PCASL images and 14 T1-w image series. The imaging plane was coronal-oblique/coronal-sagittal. Prior to the segmentation step, PCASL, M0, and T1-w images were collectively registered using Elastix2. T1 maps were calculated on a pixel-by-pixel basis on the kidney region by fitting the classic IR mapping scheme3 ,PWIs were calculated by subtracting corresponding label and control pairs and RBF maps were computed using the single compartment model3, 4. Whole kidney encompassing binary masks were obtained from previously trained CNN-based network. Custom scripts have been written in Python version 3.8 using OpenCV library.Segmentation. A GMM is a probabilistic model that assumes an underlying finite number of mixtures of K number of Gaussian distributions, characterized by a mean value and a covariance matrix for a given feature extracted from the image; in this case, the T1 values of the image. This algorithm iteratively applies the expectation-maximization (EM) algorithm for fitting the mixture-of-Gaussian models5. In this work, the GMM algorithm was initialized using K = 3 mixture components (background, cortex, and medulla), assuming each component had its own general covariance matrix, and 1000 maximum iterations. The pre-processing step consisted of a rescaling (between 0 and 255) of grayscale intensity values and histogram equalization of the grayscale pixels within the renal area, in order to increase the corticomedullary differentiation within it. The GMM algorithm was applied slice-wise within the region of the kidney, focusing within previously segmented renal area over patient-based T1 map. Once the model was fitted, each pixel within the renal area was labelled as background, cortex, or medulla. In this work, GMM-based segmentation also served as a differential T1 value estimation in cortex and medulla. The pipeline of the approach is represented in Figure 1.
Evaluation. Multiclass segmentation results were evaluated against manually drawn ground truth cortex and medulla labels, using a set of standard metrics: Dice Similarity Coefficient (DSC), expressed as $$$(2 \cdot |G ∩S|)⁄(|G|+|S|)$$$; precision (PC), expressed as $$$|S ∩G|⁄|S|; $$$; recall (RC), expressed as $$$|S ∩G|⁄|G|$$$; where S and G are the automatic and ground truth segmentations, respectively, and F-measure (FM) that consists of the harmonic mean of precision and recall, where β is the scaling of these two metrics6, expressed as $$$FM_β =((1+β^2 ) \cdot PC \cdot RC)/ (β^2 \cdot PC+RC)$$$, where β was set to 2 in order to raise the importance of recall. For RBF quantification evaluation, correlation coefficient (r) of ground truth and calculated perfusion values was calculated.
Results
Segmentation performance metrics are shown in Figure 2. Due to class imbalance between cortex and medulla samples, weighted metrics ensured that the prediction was not inflated due to classes of high-frequency (cortex) that dominated over the other (medulla). For weighted class, achieved RC is 85.03 ± 8.27%, PC is 89.79 ± 3.39% FM is 85.03 ± 8.10%, and DSC is 86.01 ± 6.75%. Median RBF values for predicted cortex and medulla regions were 173 ± 72 mL/min/100g and 105 ± 94 mL/min/100g, respectively; whereas perfusion values calculated from ground truth labels were 164 ± 88 mL/min/100g and 70 ± 69 mL/min/100g, respectively. Median cortical perfusion values showed an r above 96%, whereas medullary perfusion showed lower correlation (58%) between ground truth and predicted values (Figure 3). It should be noted that each dot on the scatter plot represented a slice of one individual from the dataset, and that encountered outlying points on median medullary perfusion values were discarded.Discussion and Conclusions
Regarding the automatic segmentation, the cortex achieved higher performance metric comparing with the medulla (Figure 4). This could be due to the effect of partial volume in the intersection of tissues, which led to a slightly over-segmented medulla and low corticomedullary differentiation of renal MRI images. With regard to this agreement, results showed good cortical perfusion measurement, whereas medullary perfusion measurements present higher discrepancy. It is shown that the quantification of perfusion values depended on the quality of the multiclass segmentation. In general, GMM-based multiclass segmentation approach generated more reliable, less operator-dependent and more reproducible data, as it is completely unsupervised process.Acknowledgements
Project PC181-182 RM-RENAL, supported by the Department of University, Innovation and Digital Transformation (Government of Navarra). The author would also like to acknowledge the Department of University, Innovation and Digital Transformation for the predoctoral grant number 0011-0537-2021-000050.References
- W.-C. Wu, M.-Y. Su, C.-C. Chang, W.-Y. I. Tseng, y K.-L. Liu, «Renal perfusion 3-T MR imaging: a comparative study of arterial spin labeling and dynamic contrast-enhanced techniques», Radiology, vol. 261, n.o 3, pp. 845-853, dic. 2011, doi: 10.1148/radiol.11110668.
- S. Klein, M. Staring, K. Murphy, M. A. Viergever, y J. P. W. Pluim, «elastix: a toolbox for intensity-based medical image registration», IEEE Trans. Med. Imaging, vol. 29, n.o 1, pp. 196-205, ene. 2010, doi: 10.1109/TMI.2009.2035616.
- F. Nery et al., «Consensus-based technical recommendations for clinical translation of renal ASL MRI», Magma N. Y. N, vol. 33, n.o 1, pp. 141-161, feb. 2020, doi: 10.1007/s10334-019-00800-z.
- R. Echeverria-Chasco et al., «Optimization of pseudo-continuous arterial spin labeling for renal perfusion imaging», Magn. Reson. Med., vol. 85, n.o 3, pp. 1507-1521, mar. 2021, doi: 10.1002/mrm.28531.
- «2.1. Gaussian mixture models», scikit-learn. https://scikit-learn/stable/modules/mixture.html (accedido 4 de noviembre de 2022).
- E. Fernandez-Moral, R. Martins, D. Wolf, y P. Rives, «A New Metric for Evaluating Semantic Segmentation: Leveraging Global and Contour Accuracy», en 2018 IEEE Intelligent Vehicles Symposium (IV), jun. 2018, pp. 1051-1056. doi: 10.1109/IVS.2018.8500497.
Figures
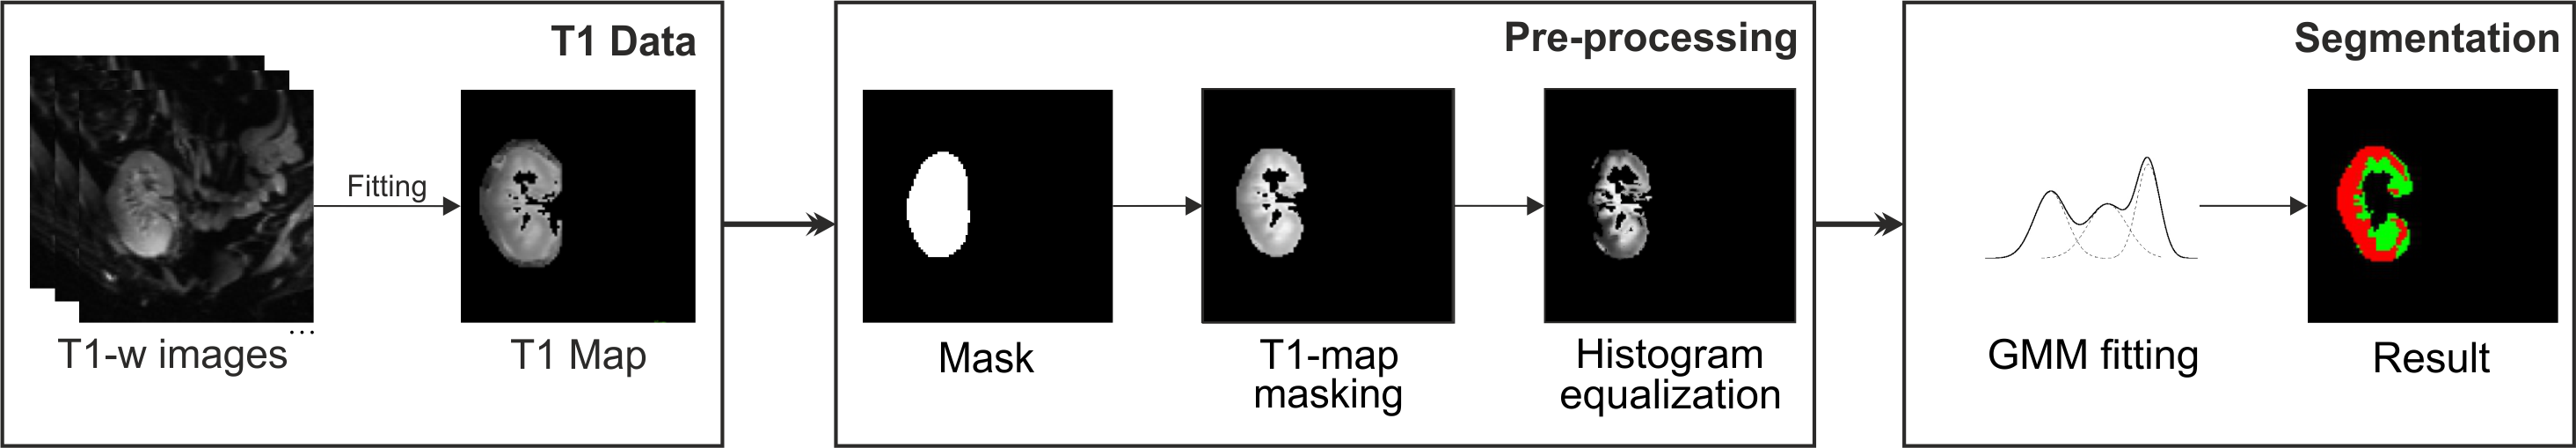
Multiclass segmentation pipeline. Red and green labels of the segmentation step correspond to cortex and medulla regions.

Comparative segmentation performance results for cortex, medulla and weighted class.
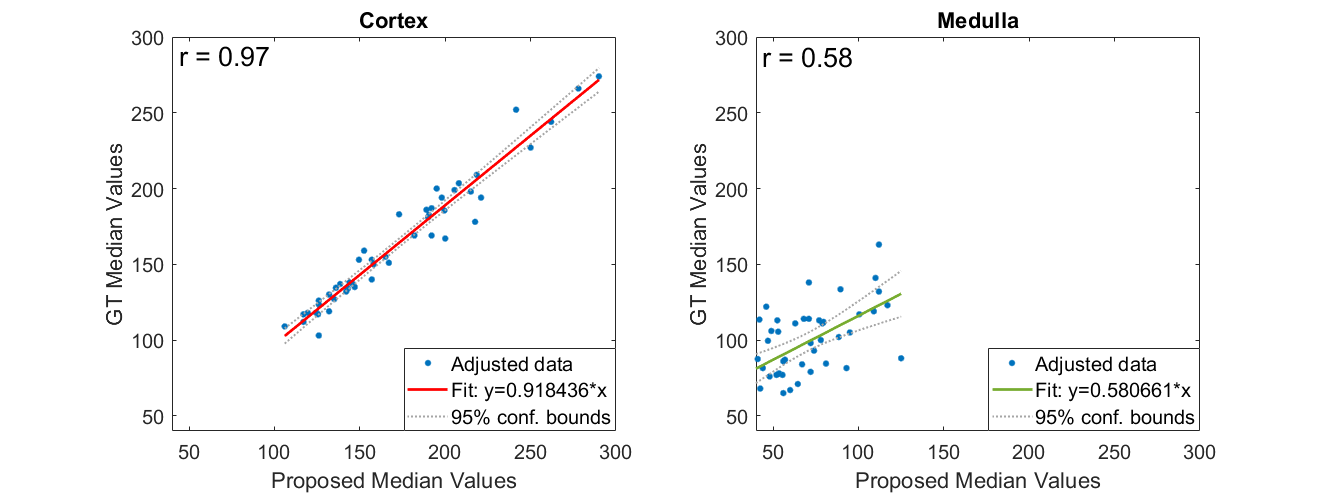
Scatter plot of pairwise comparison between ground truth and automatically calculated perfusion values, for cortex and medulla.
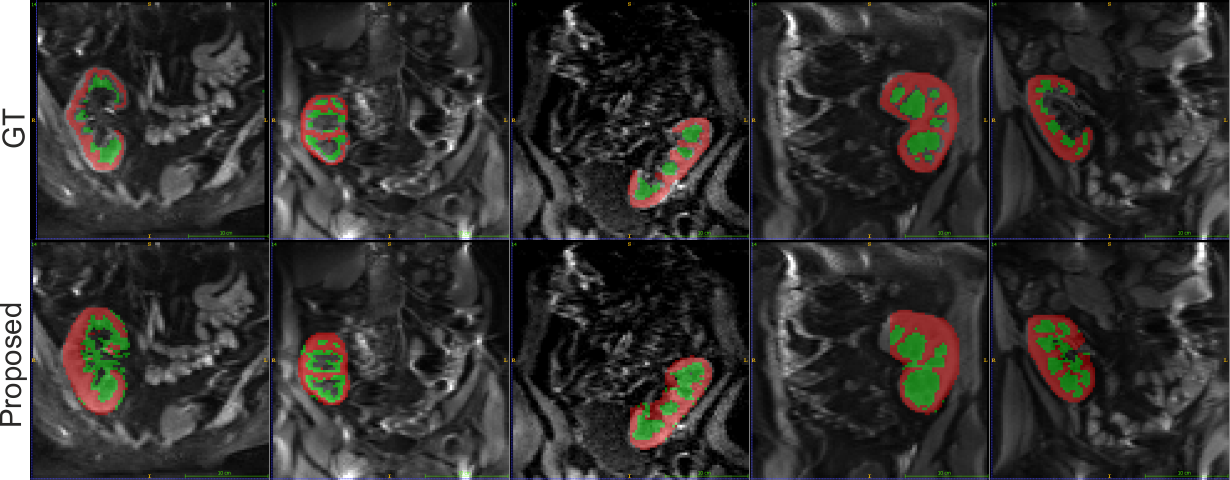
Examples of automatically calculated cortex and medulla regions over a T1-w image. Red and green labels correspond to cortex and medulla regions.
DOI: https://doi.org/10.58530/2023/4614