4613
Cluster Based Sparse Variational Minimization for Multi-Compartment Dictionary Fitting to bSSFP Signal Profiles1Department of Diagnostic, Interventional and Pediatric Radiology (DIPR), Inselspital, Bern University Hospital, University of Bern, Bern, Switzerland, 2Translation Imaging Center (TIC), Swiss Institute for Translational and Entrepreneurial Medicine, Bern, Switzerland, 3Department of Radiology, Lausanne University Hospital (CHUV) and University of Lausanne (UNIL), Lausanne, Switzerland, 4Advanced Clinical Imaging Technology,Department of Cardiology, Inselspital, Bern University Hospital, Bern, Switzerland, 5Siemens Healthineers International AG, Lausanne, Switzerland, 6LTS5, École Polytechnique Fédérale de Lausanne (EPFL), Lausanne, Switzerland
Synopsis
Keywords: Data Processing, Quantitative Imaging, phase-cycled bSSFP, fat fraction
A novel cluster-based sparse total-variation minimization (CSTV) dictionary matching algorithm for multi-compartment parameter mapping applied to a phase-cycled balanced steady state free precession (PC-bSSFP) signal profile is presented. A dictionary encoding off-resonance frequency and relaxation time ratio is matched to the measured profiles with the proposed method to recover the underlying fat fraction, proton density, and water-fat-separated images simultaneously. The performance of the proposed method is tested and compared with a Laplacian regularized non-negative least squares dictionary matching method in phantom and in vivo experiments.Introduction
Signal profiles obtained with phase-cycled (PC) balanced Stead-State Free Precession (bSSFP) acquisitions are typically known to be $$$T_1⁄T_2$$$ dependent with a pass-band and a and stop-band based on the underlying magnetic field inhomogeneity (B0) and tissue chemical shift1. Profile asymmetries have been observed in the presence of multiple compartments2. Recently, Signal Profile Asymmetries for Robust multi-Compartment Quantification (SPARCQ)3 was proposed to decompose the measured PC-bSSFP profiles into a weighted sum of dictionary entries which differ in relaxation time ratio and off-resonance frequency, enabling fat-water separation and fat fraction (FF) quantification. SPARCQ uses a non-negative least-squares fit with a Laplacian-penalization regularizer that operates on the dictionary, treating each voxel independently, therefore the inherent sparsity of a possible solution and information from neighboring voxels are not used. The current study aims to develop a cluster-based total-variation minimization (CSTV) dictionary matching scheme that uses the sparsity in dictionary entries to reconstruct a measured PC-bSSFP profile while simultaneously minimizing the variation of weights among the voxels that are members of the same cluster.Methods
Theory: The proposed CSTV formulation problem can be stated as follows:$$\left \|\begin{bmatrix}\phi\\\bar\lambda^T\end{bmatrix}W_c-\begin{bmatrix}Y_c\\\bar0\end{bmatrix}\right\|_2^2+\gamma\left\|GW_c^T\right\|_2^2\ subject\ to\ (W_c)_{i,j}\geq0$$
Where $$$\phi$$$ represents dictionary entries with Bloch-simulated PC-bSSFP profiles, $$$\bar{\lambda}$$$ is a constant vector with value $$$\lambda$$$, $$$W_c=[w_1w_2,...]$$$ are the concatenated weights of cluster $$$c$$$, $$$Y_c$$$ is the concatenated measured PC-bSSFP profiles of cluster $$$c$$$, $$$\gamma$$$ is a regularization parameter and $$$G$$$ is the finite difference operator. By augmenting $$$\phi$$$ with $$$\bar\lambda^T$$$ and $$$Y_c$$$ with $$$\bar 0$$$, considering the non-negativity constraint on weights, sparsity on the solution is enforced4.By minimizing $$$||GW_c^T ||_2^2$$$ , weights of voxels belonging to the same cluster are forced to be similar. The constrained optimization problem was solved with Alternating Direction Method of Multipliers (ADMM)5. $$$W_c$$$ update is based on a solution of the formation AX+XB=C by a series of matrix factorizations6.
Clustering is based on a dot product fit where voxels that are fitted to the same off-resonance frequency interval are assigned to the same cluster. 10 clusters were used in the current study. After their computation in each voxel, the weights are projected onto the off-resonance frequency dimension of the dictionary. Considering the water being on-resonance and the periodicity of the PC-bSFFP profile with $$$1/TR$$$, projected weights around $$$0$$$ and $$$1/TR\ Hz$$$ are assigned to water and remaining weights are assigned to fat. Proton density (PD), fat fraction (FF) and water fraction (WF) is then calculated as follows:$$PD=\sum{w},FF=\frac{\sum{w^f}}{PD},WF=1-PD$$ Where $$$w^f$$$ denotes the weights that are assigned to fat (Figure 1).
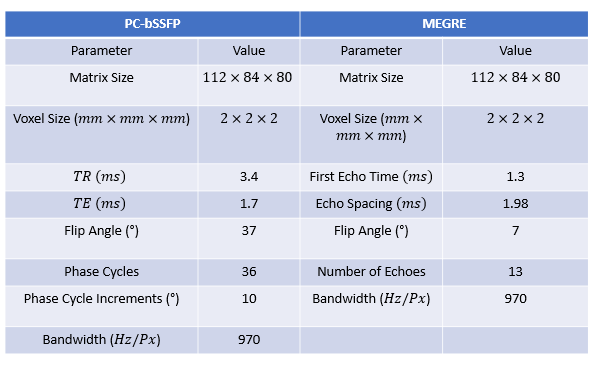
MRI Experiments: PC-bSSFP and multi-echo gradient-recalled echo (MEGRE) acquisitions were performed in a phantom with known fat fractions at 3T (MAGNETOM Prisma, Siemens Healthcare, Erlangen, Germany) with acquisition parameters given in Table 1. The same acquisitions were performed in knees of 2 human volunteers.
Data Processing: B0 and FF maps along with the fat and water images were recovered from MEGRE measurements with a graph-cut based method7. A bone marrow fat model was used for in vivo data8, and the measured3 fat spectrum was used for phantom data.
To be independent of B0, the measured PC-bSSFP profiles are shifted according to the recovered B0. Dictionary matching is conducted on the processed PC-bSSFP profiles with both SPARCQ, and CSTV and PD, FF, and WF maps are recovered as described3.
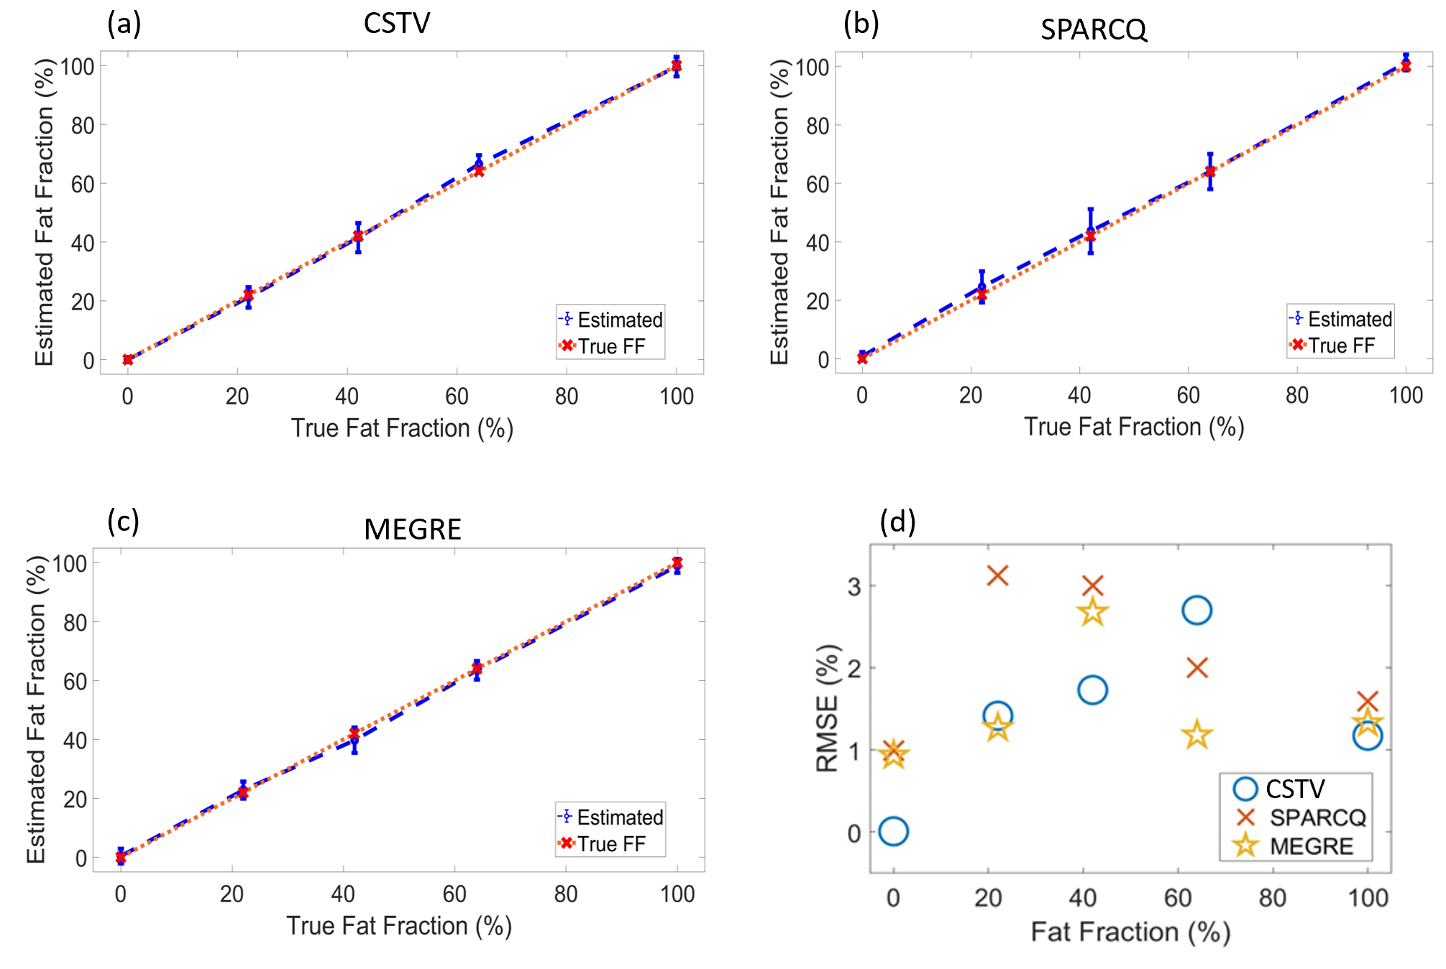
Data Analysis: Algorithm performance was determined in vitro by calculating the mean and standard deviation of FF maps in each region of interest (ROI). Root mean squared errors (RMSE) in each ROI is with respect to the reference FF values are calculated. Linear regression and $$$R^2$$$ values for different methods are reported. In vivo results are compared visually.
Results and Discussion
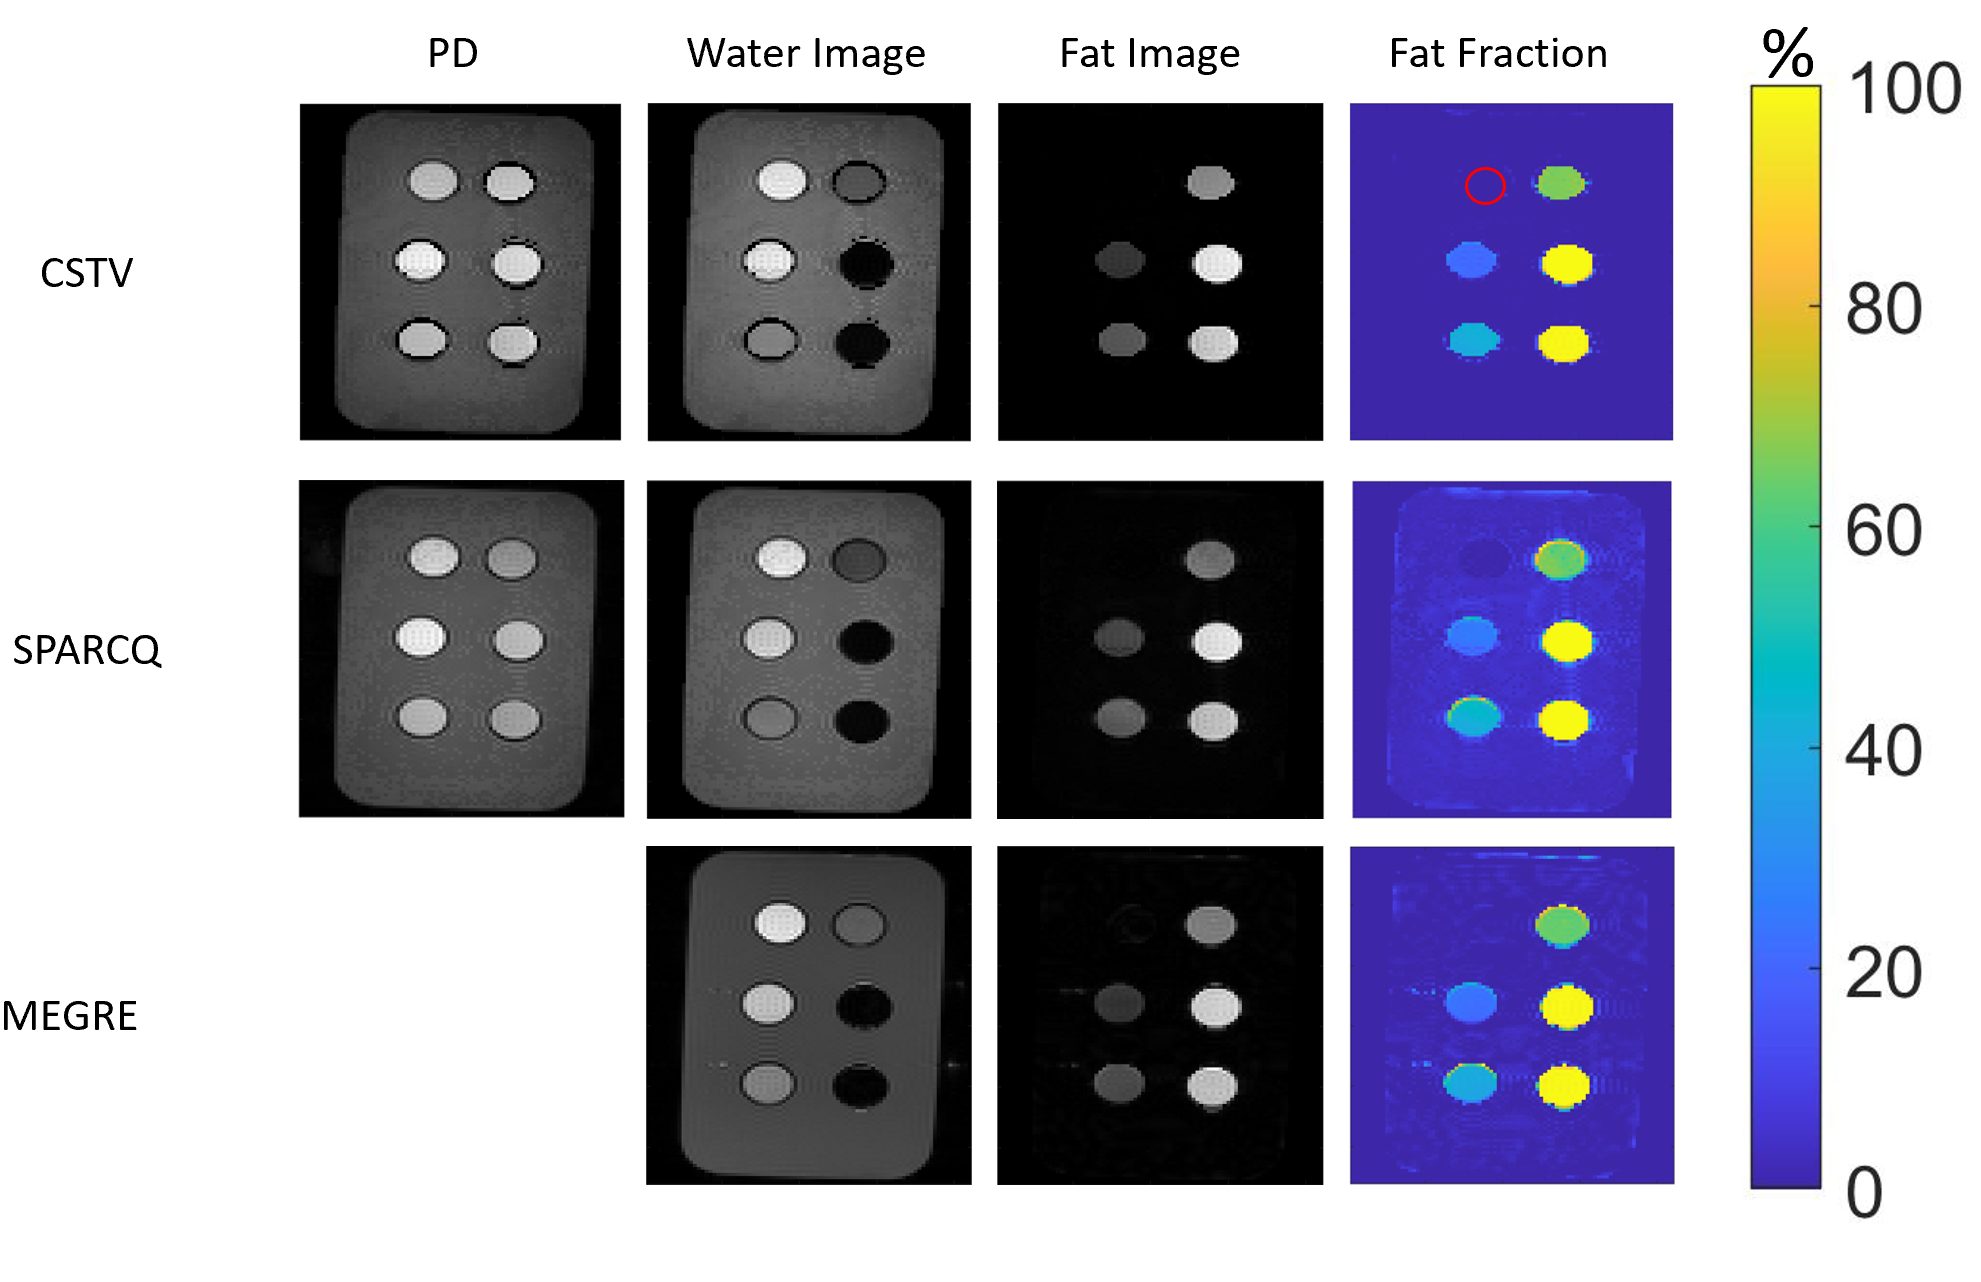
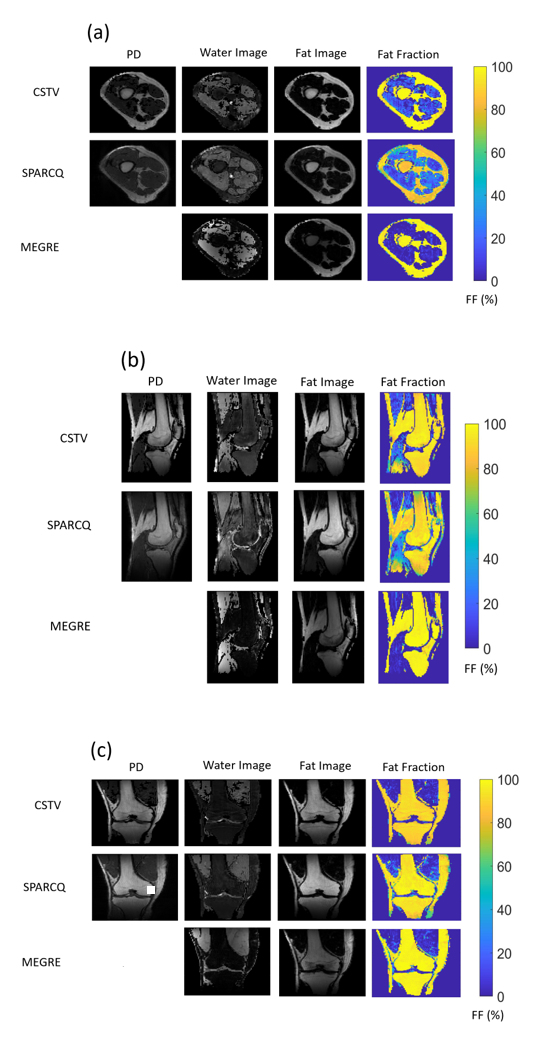
In phantom studies, SPARCQ and CSTV yield similar PD, water and fat images. SPARCQ, CSTV and MEGRE derived fat fractions match the reference with a maximum RMSE value of $$$3.1%$$$ (Figure 3-d). Linear regression of obtained FF maps yield $$$0.9979$$$, $$$0.9978$$$ and $$$0.9977$$$ $$$R^2$$$ values for CSTV, SPARCQ and MEGRE, respectively. The $$$0%$$$ fat fraction vial is blended into the background with CSTV (Figure 2, red-circle), which suggests the efficiency of the total variation minimization, corroborated by its RMSE of $$$0.02$$$ (Figure 3-d). CSTV method increases RMSE performance compared with original SPARCQ in phantoms (Figure 3-d), showing the value of sparsity and minimal-variation assumptions, with a drawback of an increased number of regularization parameters.In vivo, the water images obtained with SPARCQ and CSTV appear less homogenous compared with those obtained with MEGRE (Figure 4). This is likely related to a bias in fat signal because of the chosen flip angle. SPARCQ FF map in axial slice and CSTV FF map in sagittal slice yield underestimated fractions (Figure 4), which suggests a requirement for different regularization parameter selection for different orientations and/or slices. In MEGRE-based fat images, bone and joint region appears darker, which suggests a signal loss, to which PC-bSSFP-based fat images are more robust (Figure 4).
Conclusion
Dictionary matching approach to the PC-bSSFP profiles offer a robust fat fraction estimation independent of a spectral fat model. Promoting sparsity while enforcing intra-cluster minimized variation increases the performance of dictionary matching to the PC-bSSFP profiles by means of fat fraction estimation.Acknowledgements
This study was supported by the Swiss National Science Foundation (grant number PCEFP2_194296)References
1. Hilbert, T., Nguyen, D., Thiran, J. P., Krueger, G., Kober, T., & Bieri, O. (2018). True constructive interference in the steady state (trueCISS). Magnetic resonance in medicine, 79(4), 1901-1910.
2. Miller, K. L. (2010). Asymmetries of the balanced SSFP profile. Part I: theory and observation. Magnetic Resonance in Medicine: An Official Journal of the International Society for Magnetic Resonance in Medicine, 63(2), 385-395.
3. Rossi, G., Hilbert, T., Mackowiak, A. L., Pierzchała, K., Kober, T., & Bastiaansen, J. A. (2020). Fat fraction mapping using bSSFP Signal Profile Asymmetries for Robust multi-Compartment Quantification (SPARCQ). arXiv preprint arXiv:2005.09734.
4. Foucart, S., & Koslicki, D. (2014). Sparse recovery by means of nonnegative least squares. IEEE Signal Processing Letters, 21(4), 498-502.
5. Boyd, S., Parikh, N., Chu, E., Peleato, B., & Eckstein, J. (2011). Distributed optimization and statistical learning via the alternating direction method of multipliers. Foundations and Trends® in Machine learning, 3(1), 1-122.
6. Golub, G., Nash, S., & Van Loan, C. (1979). A Hessenberg-Schur method for the problem AX+ XB= C. IEEE Transactions on Automatic Control, 24(6), 909-913.
7. Hernando, D., Kellman, P., Haldar, J. P., & Liang, Z. P. (2010). Robust water/fat separation in the presence of large field inhomogeneities using a graph cut algorithm. Magnetic Resonance in Medicine: An Official Journal of the International Society for Magnetic Resonance in Medicine, 63(1), 79-90.
8. Karampinos, D. C., Melkus, G., Baum, T., Bauer, J. S., Rummeny, E. J., & Krug, R. (2014). Bone marrow fat quantification in the presence of trabecular bone: initial comparison between water‐fat imaging and single‐voxel MRS. Magnetic Resonance in Medicine, 71(3), 1158-1165.
9. Hu, H. H., Börnert, P., Hernando, D., Kellman, P., Ma, J., Reeder, S., & Sirlin, C. (2012). ISMRM workshop on fat–water separation: insights, applications and progress in MRI. Magnetic resonance in medicine, 68(2), 378-388.
Figures
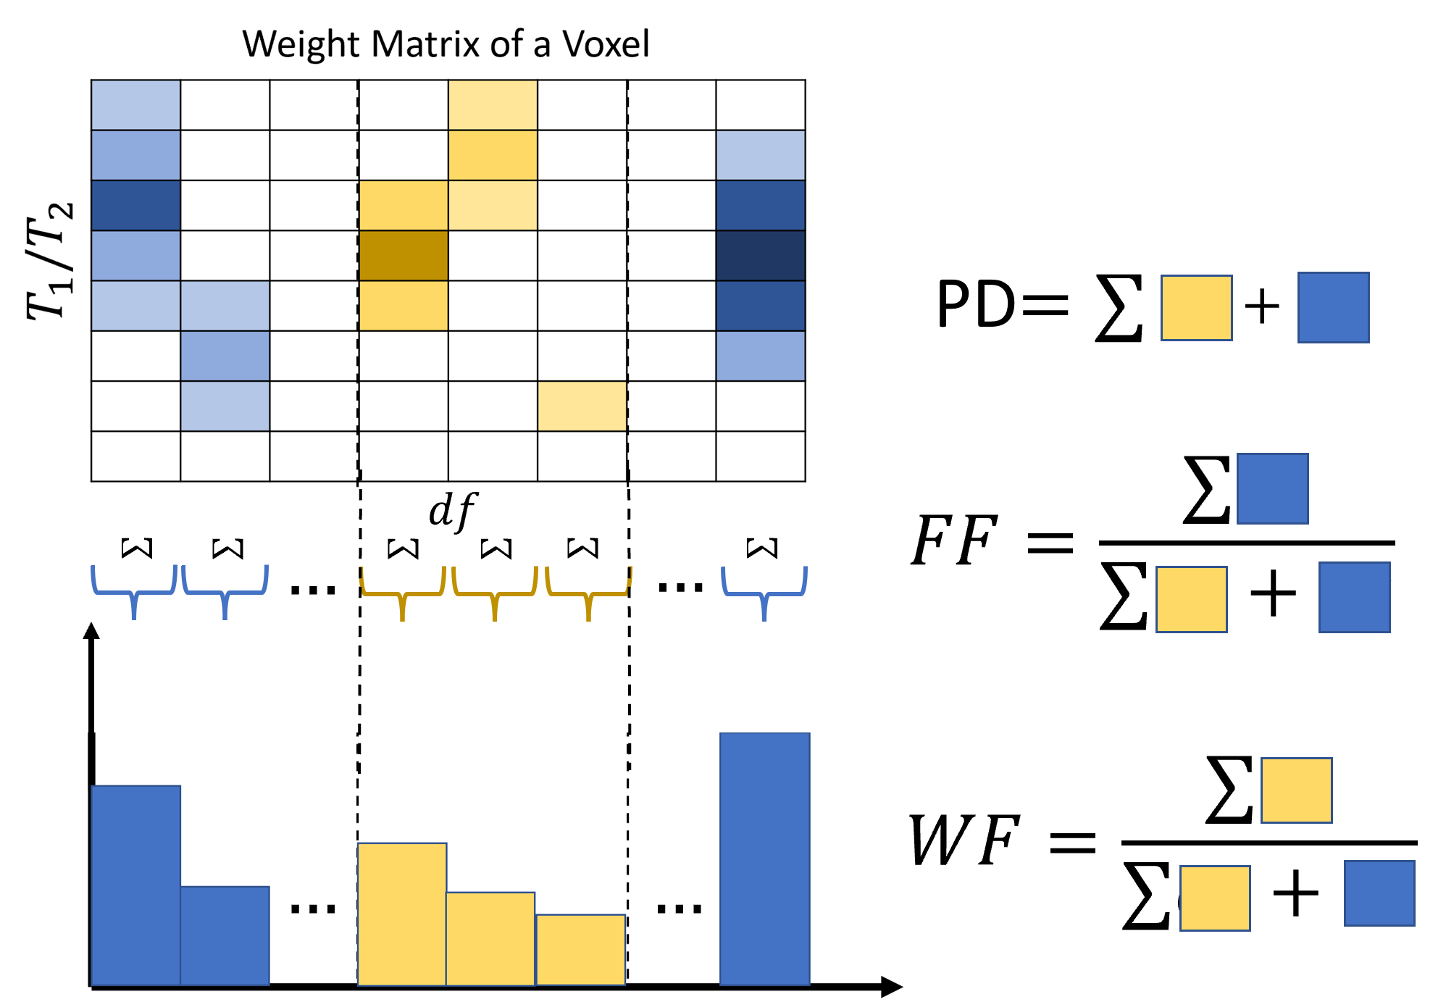
Figure 1: Fat fraction estimation process for a single voxel from the calculated weights. Since the dictionary has two dimensions, namely relaxation time ratio $$$T_1/T_2$$$ and frequency offset $$$df$$$, weights of a voxel can be represented as a matrix. All weights are projected onto $$$df$$$ axis. Weights are summed in predefined intervals to yield FF values of the voxel.