4611
Estimate the Linear Effect of Inter-Scanner Variability: Insight from Paired Cross-Scanner T1-weighted Images1Department of Bioengineering, University of Pittsburgh, Pittsburgh, PA, United States, 2Intelligent System Program, School of Computing and Information, University of Pittsburgh, Pittsburgh, PA, United States, 3Department of Radiology, University of Pittsburgh, Pittsburgh, PA, United States, 4Department of Artificial Intelligence, Yonsei University, Seoul, Korea, Republic of, 5Department of Biostatistics, Johns Hopkins University, Baltimore, MD, United States, 6Department of Neurology, University of California Davis, Davis, CA, United States, 7Department of Psychiatry, University of Pittsburgh, Pittsburgh, PA, United States, 8Department of Biostatistics, University of Pittsburgh, Pittsburgh, PA, United States
Synopsis
Keywords: Data Processing, Data Processing, Harmonization
To broaden our knowledge of inter-scanner variability, we established a pipeline to linearly estimate the site effect by incorporating ComBat modeling and superpixel parcellation. We found that the variation prominently manifested in tissue contrast, noise level, and field inhomogeneity with respect to cross-site data. We further used the estimated parameters to harmonize images. The image quality and structural similarity of cross-scanner data can be improved after the harmonization procedure, and the variation in volumetric measures can also be reduced. This study provides further insight for the research focusing on the development of image harmonization methods.Introduction
The collection of structural MRI data across sites increases statistical power and enables the generalization of research outcomes1; however, due to the variety of imaging acquisition, inter-scanner variability hinders the direct comparability of multi-scanner MRI data2. Thus, many harmonization methods have been proposed to reduce inter-scanner variability in the image domain3,4,5. Although proposed methods, especially incorporating deep learning techniques3,4,5, have achieved promising performance, interpretability and understanding of inter-scanner variability were still limited. In this study, we applied ComBat6, a statistical harmonization method, to the image domain and investigated the linear effect of inter-scanner variability and image quality metrics. We achieved harmonization by removing the estimated site effect from images.Materials & Methods
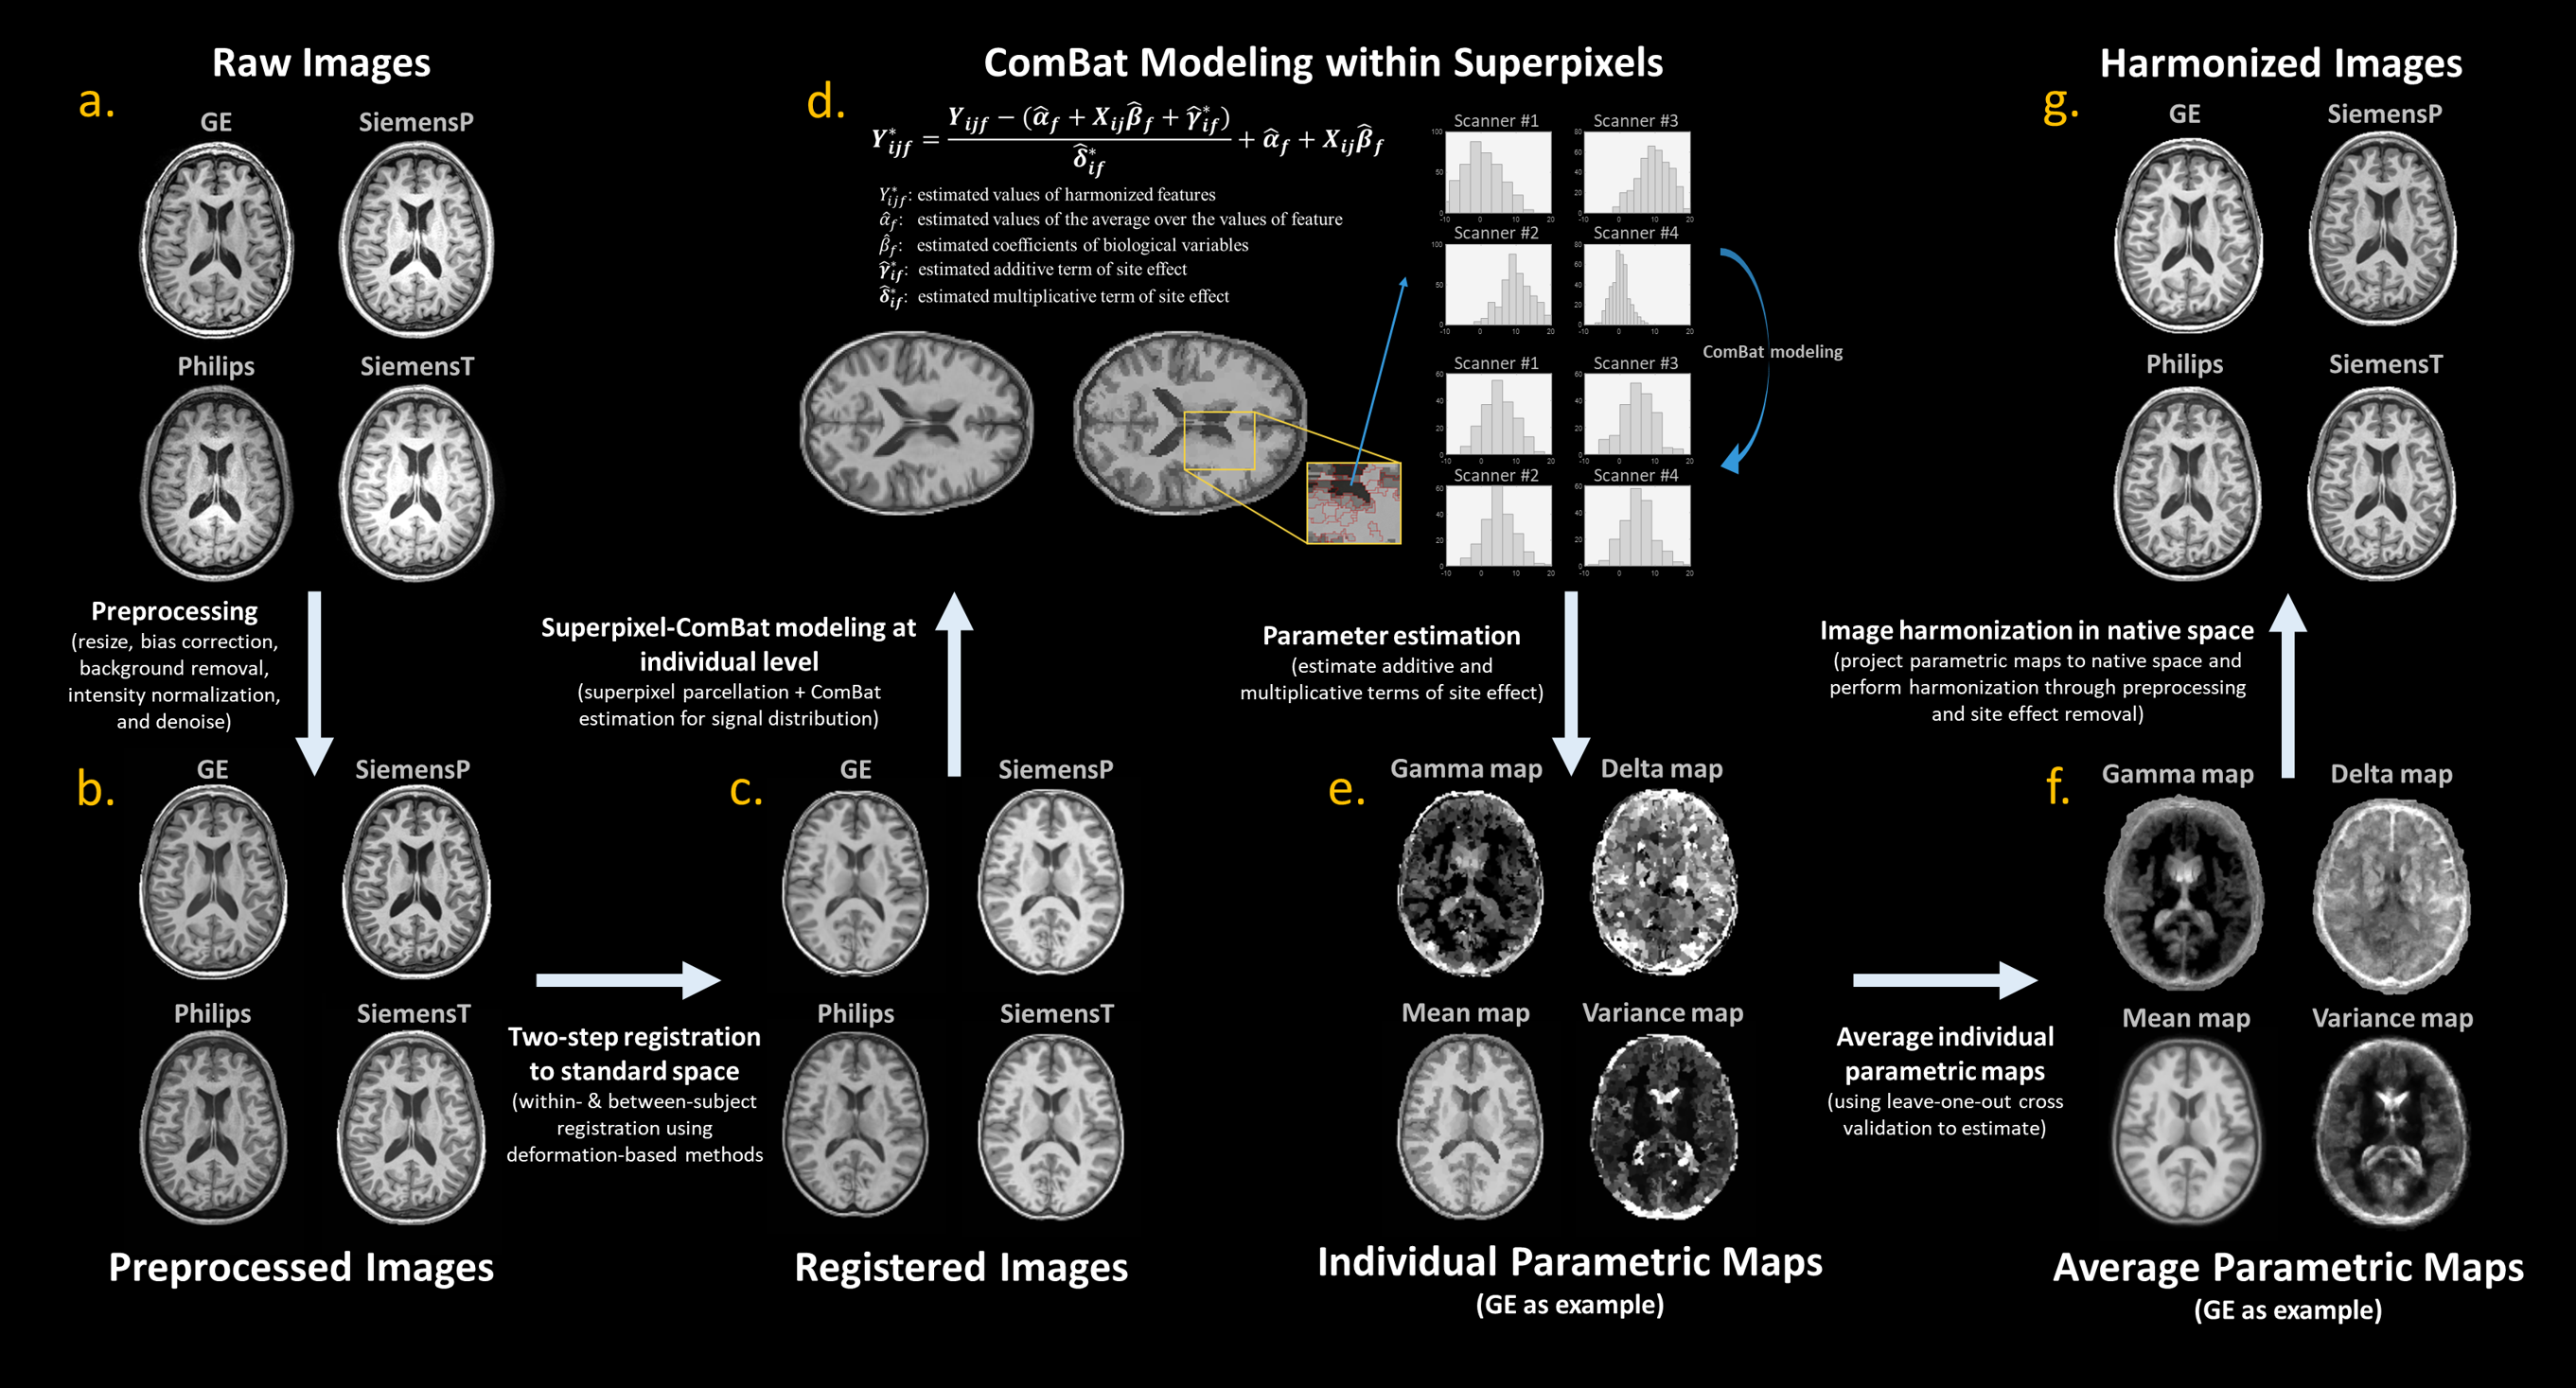
Eighteen cognitively normal participants were used in this study (age: 68.0 [9.3] years; 10 females). For each subject, T1-weighted images were acquired on each of four 3T scanners with different manufacturers or models including GE, Philips, Siemens-Prisma (SiemensP), and Siemens-Trio (SiemensT) during a short period of time (at most four months apart). The imaging acquisition protocols5 were MPRAGE with the resolution of isotropic 1mm cubic (for Philips, SiemensP, and SiemensT) and BRAVO with the resolution of 1x1x0.5 mm cubic (for GE), respectively. To estimate the site effect, we established an analytic pipeline to implement ComBat model in image domain (Figure 1). First, to standardize image format and fulfill the unimodal assumption of ComBat model, preprocessing including image resize (for GE data), bias correction, background removal, intensity normalization, and denoise was applied to all images using SPM and CAT12 packages7. Next, all images were registered to a template in the standard space by a two-step deformation-based registration. After that, for each subject, we averaged cross-scanner images and used a three-dimensional superpixel algorithm8 to parcellate the average image into superpixels, which consisted of voxels with similar intensity. Next, in each defined superpixel, we sampled voxel values from cross-scanner images and applied ComBat to estimate site effect by using voxels as observations. The use of superpixel parcellation can reduce the number of estimated parameters and meet the assumption of unimodal distribution. Eventually, we obtained estimated additive and multiplicative terms (parameter gamma and delta) of site effect from each subject and averaged them into final parametric maps. Besides estimating parametric maps of site effect, we calculated image quality metrics using MRIQC9 and similarity index10 to investigate the manifestation of scanner-related variation. Furthermore, we attempted to harmonize cross-scanner images by removing the estimated site effect. Specifically, the parametric maps were transformed into the native space to perform linear harmonization. Voxel-based morphometry using CAT127 was used to estimate cortical volumetric measures that were used to compare the difference before and after the harmonization.Results
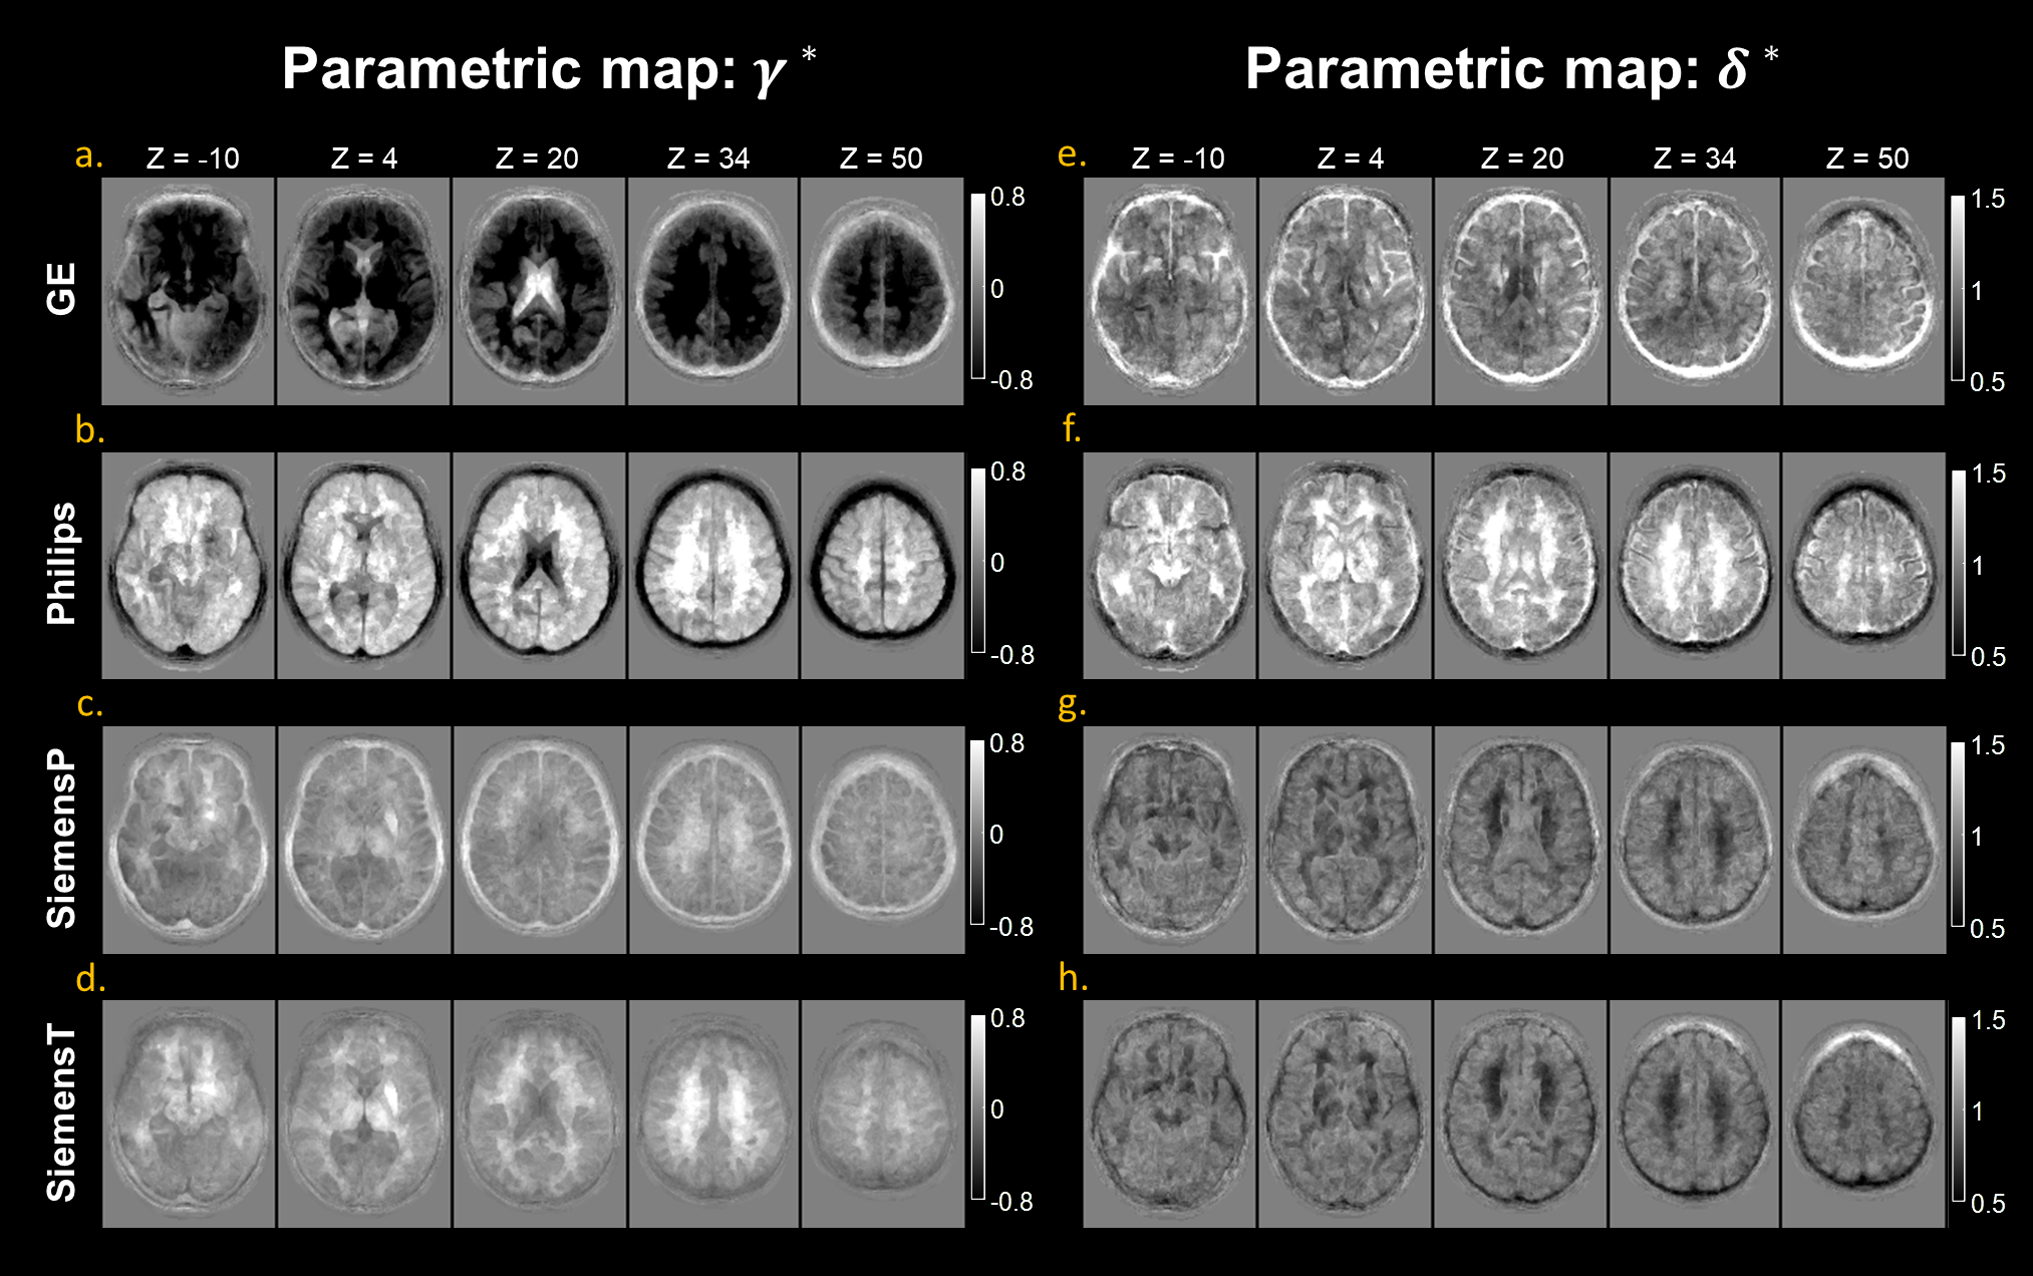
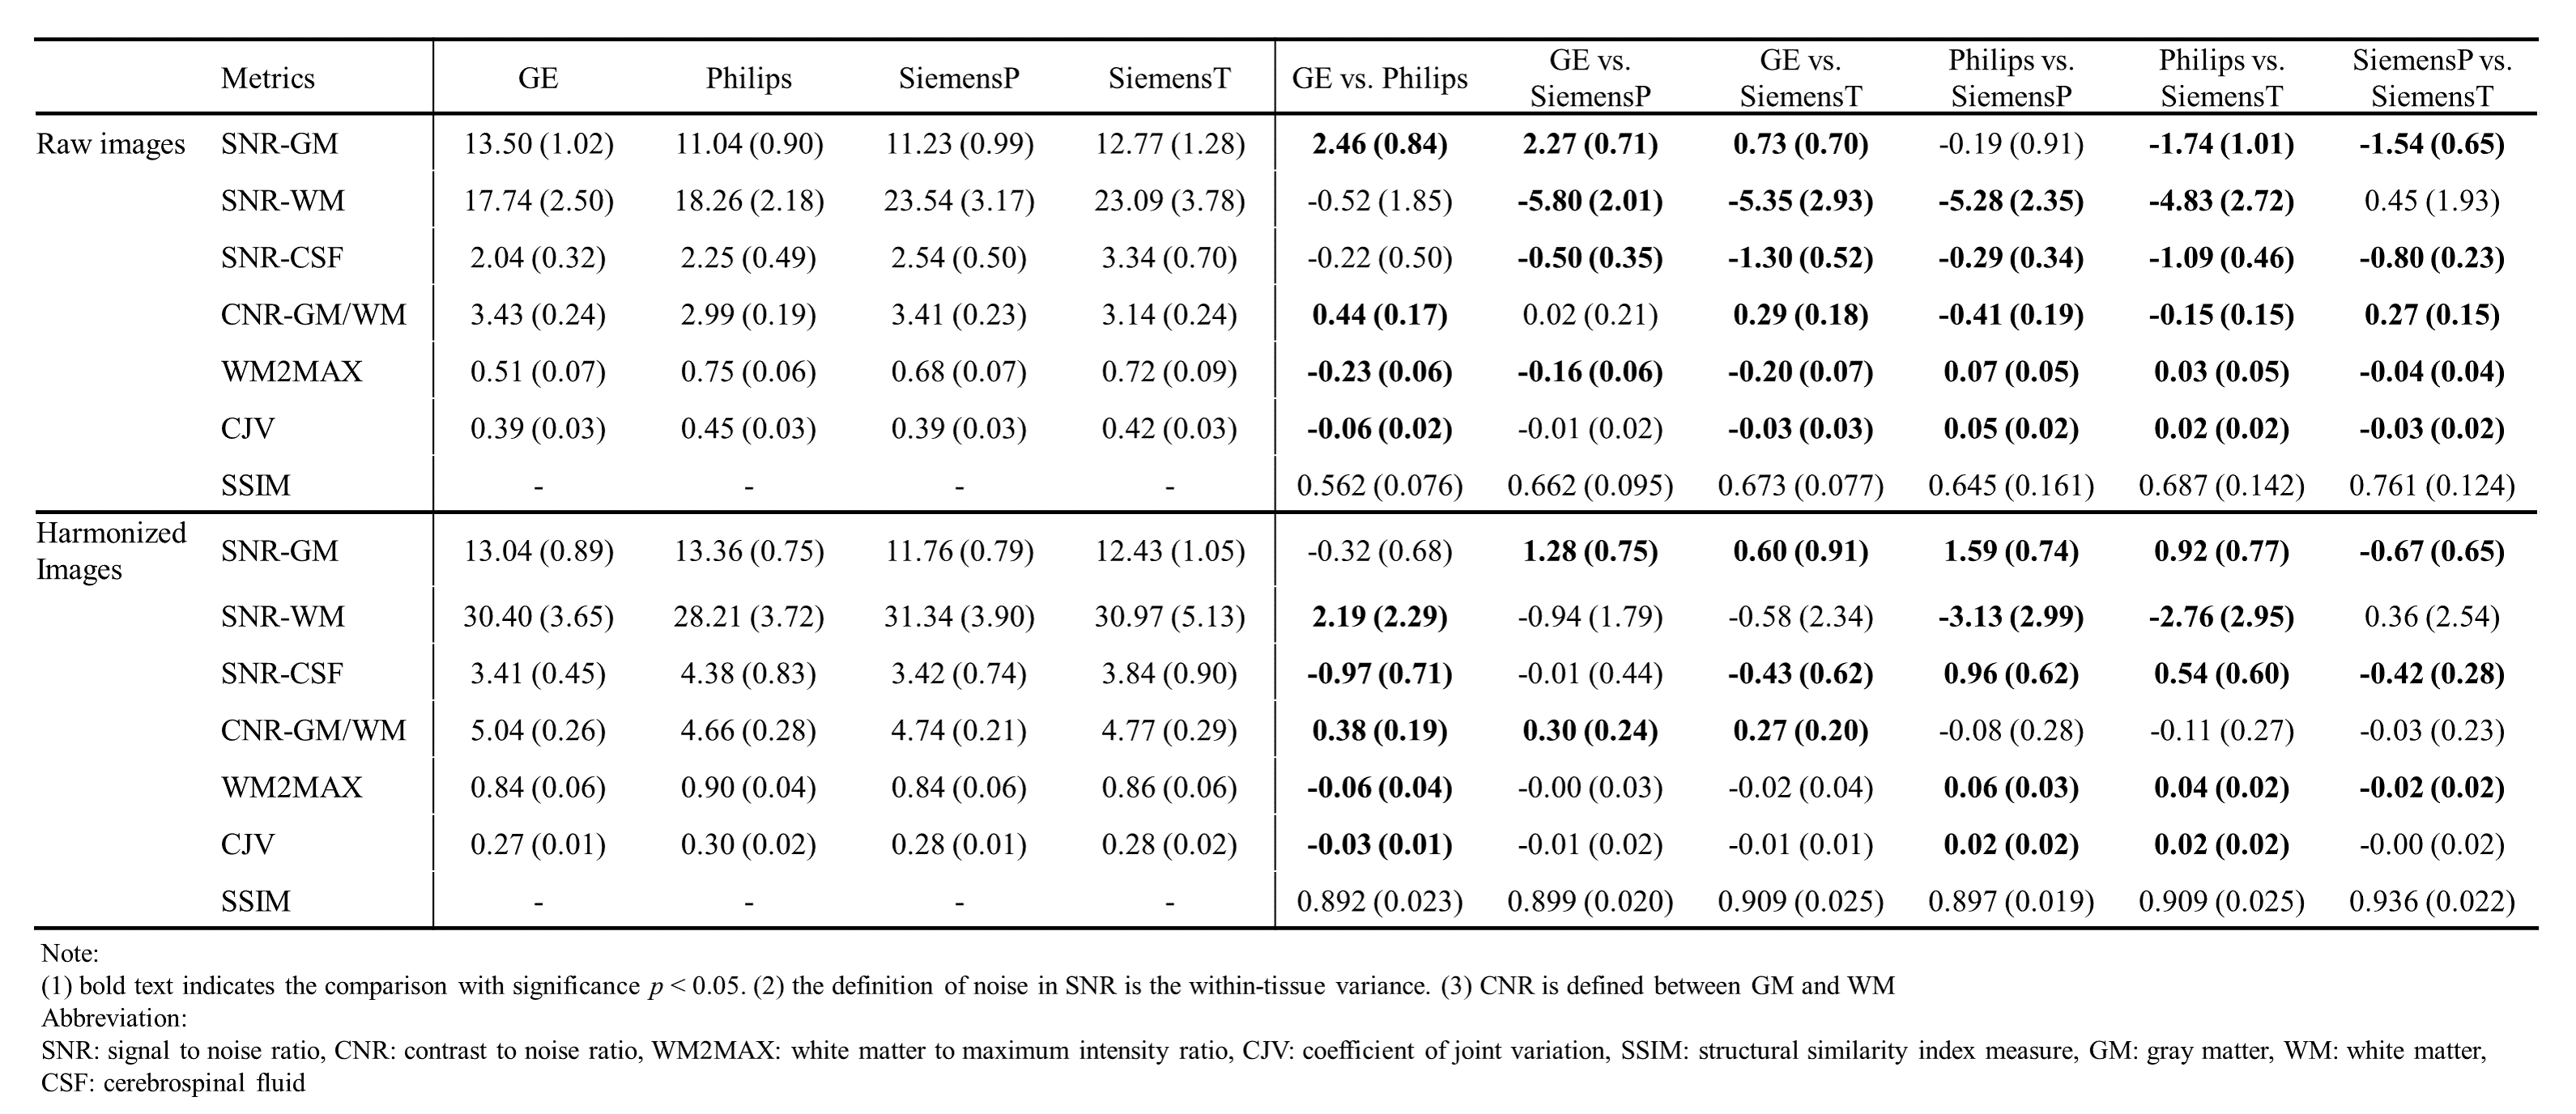
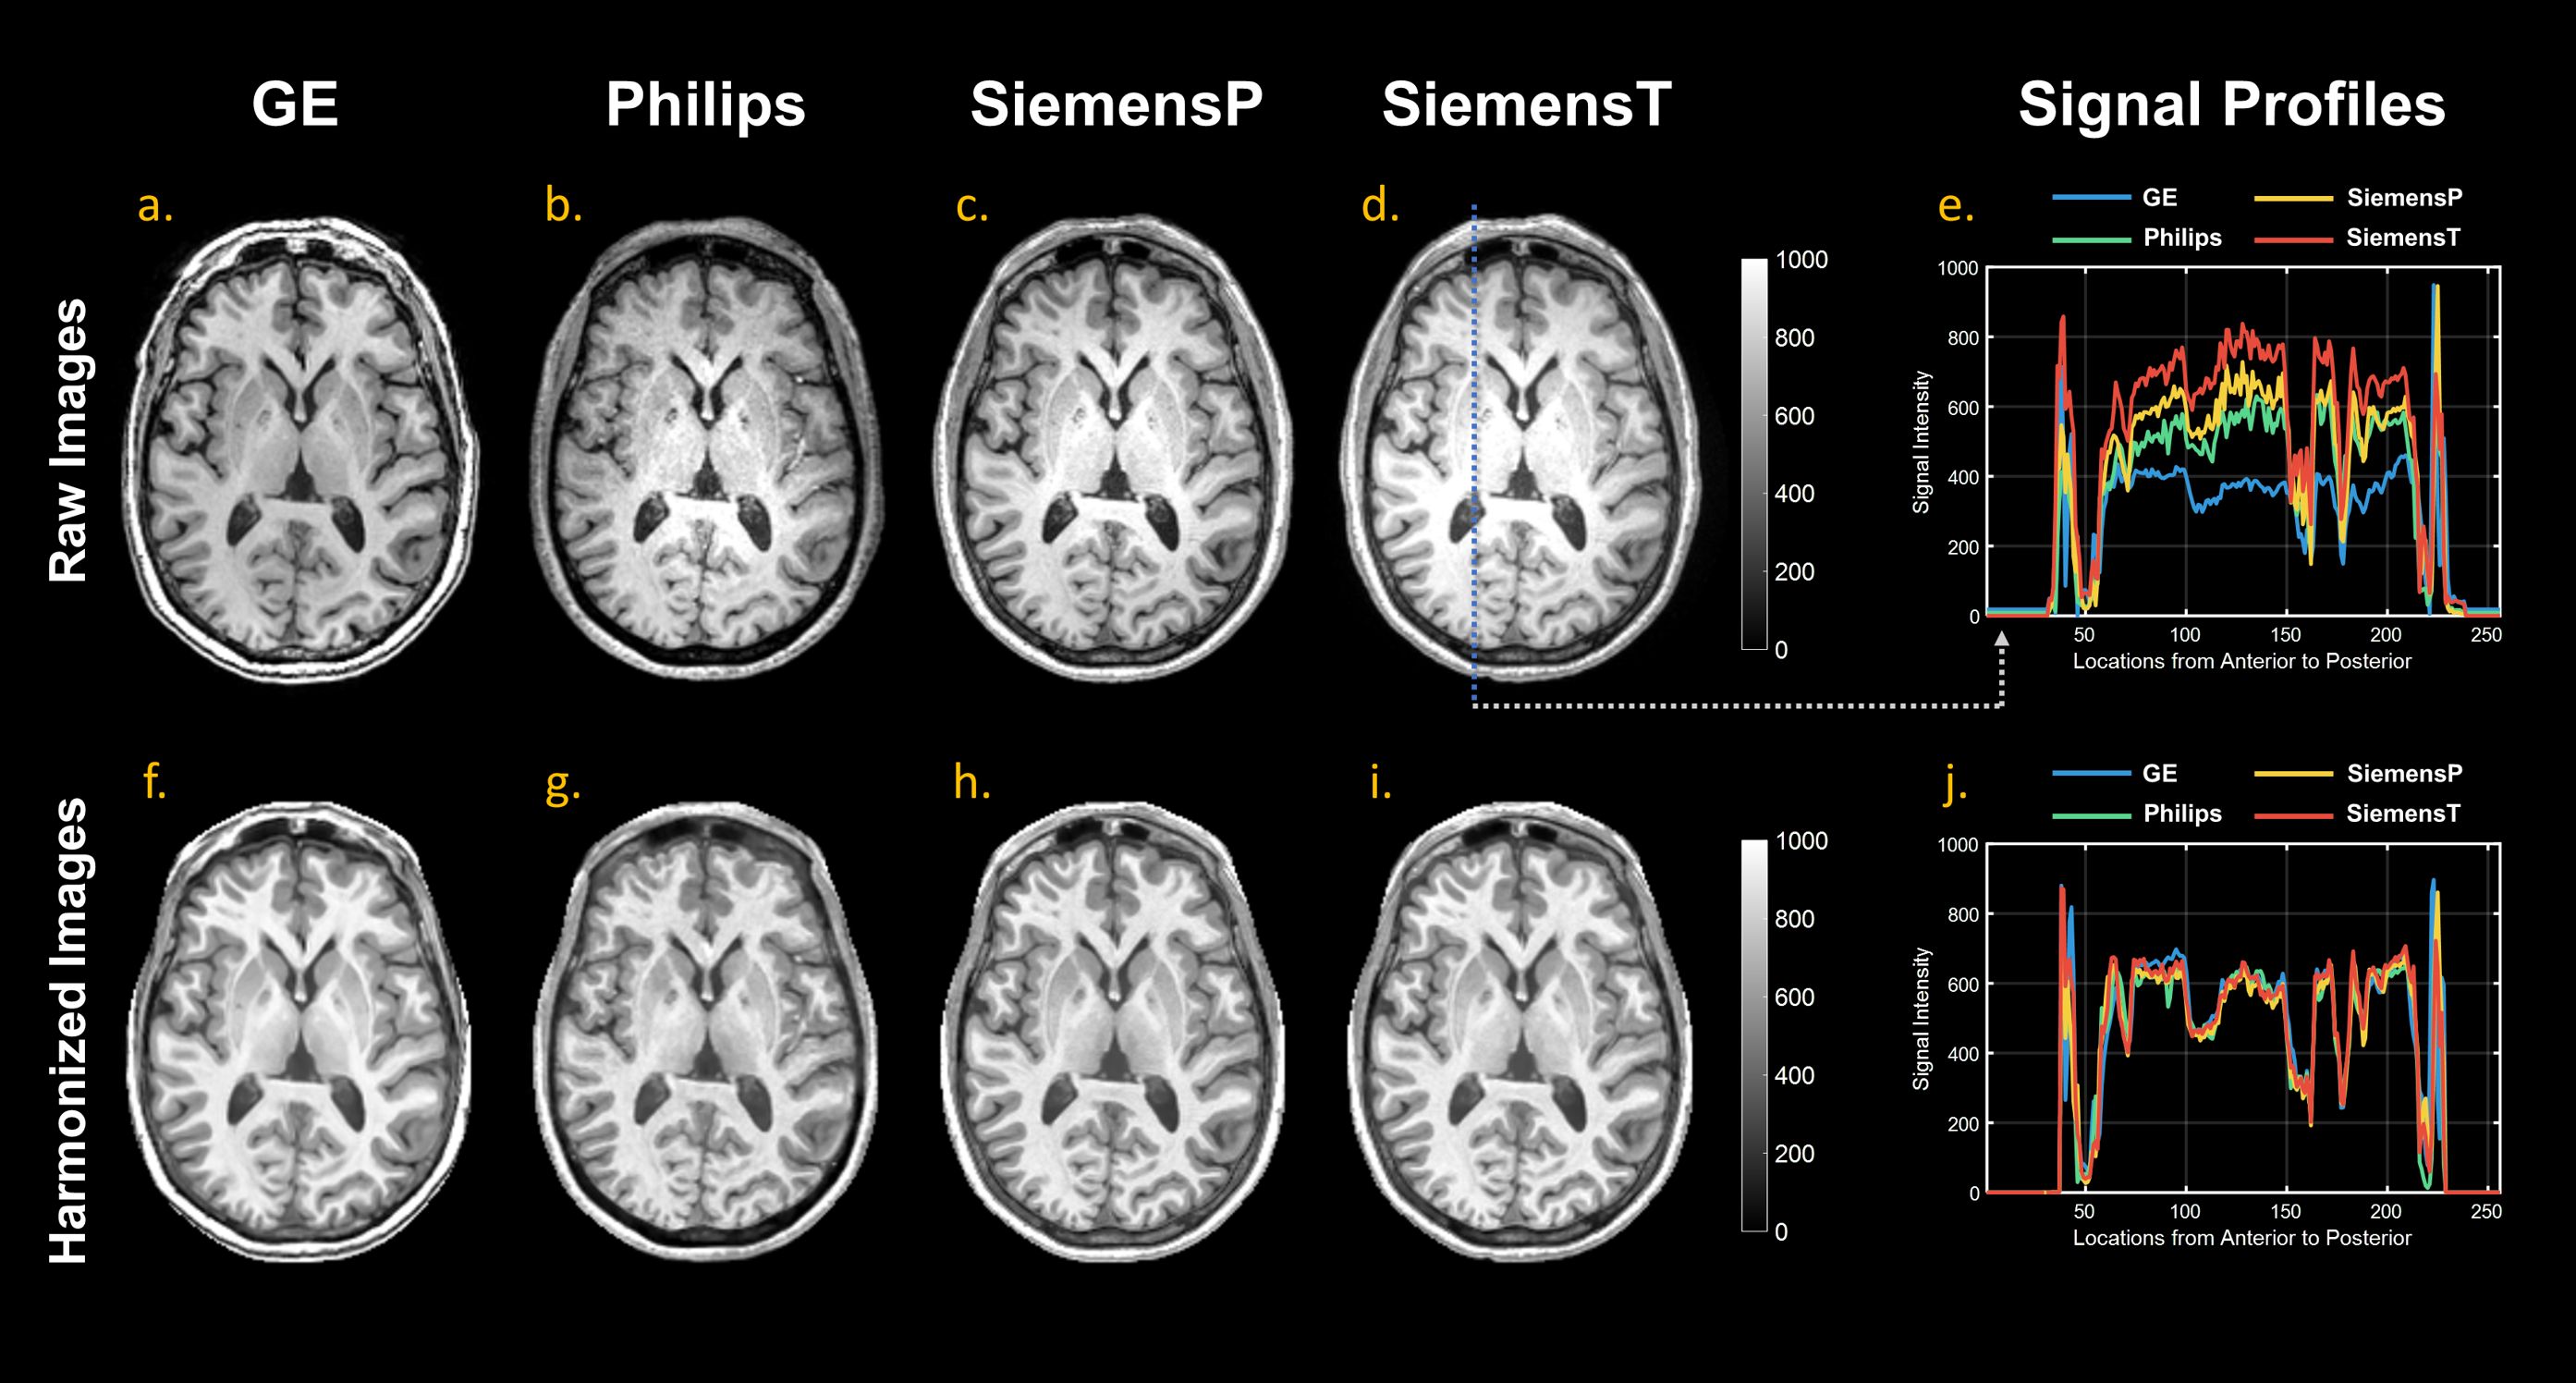
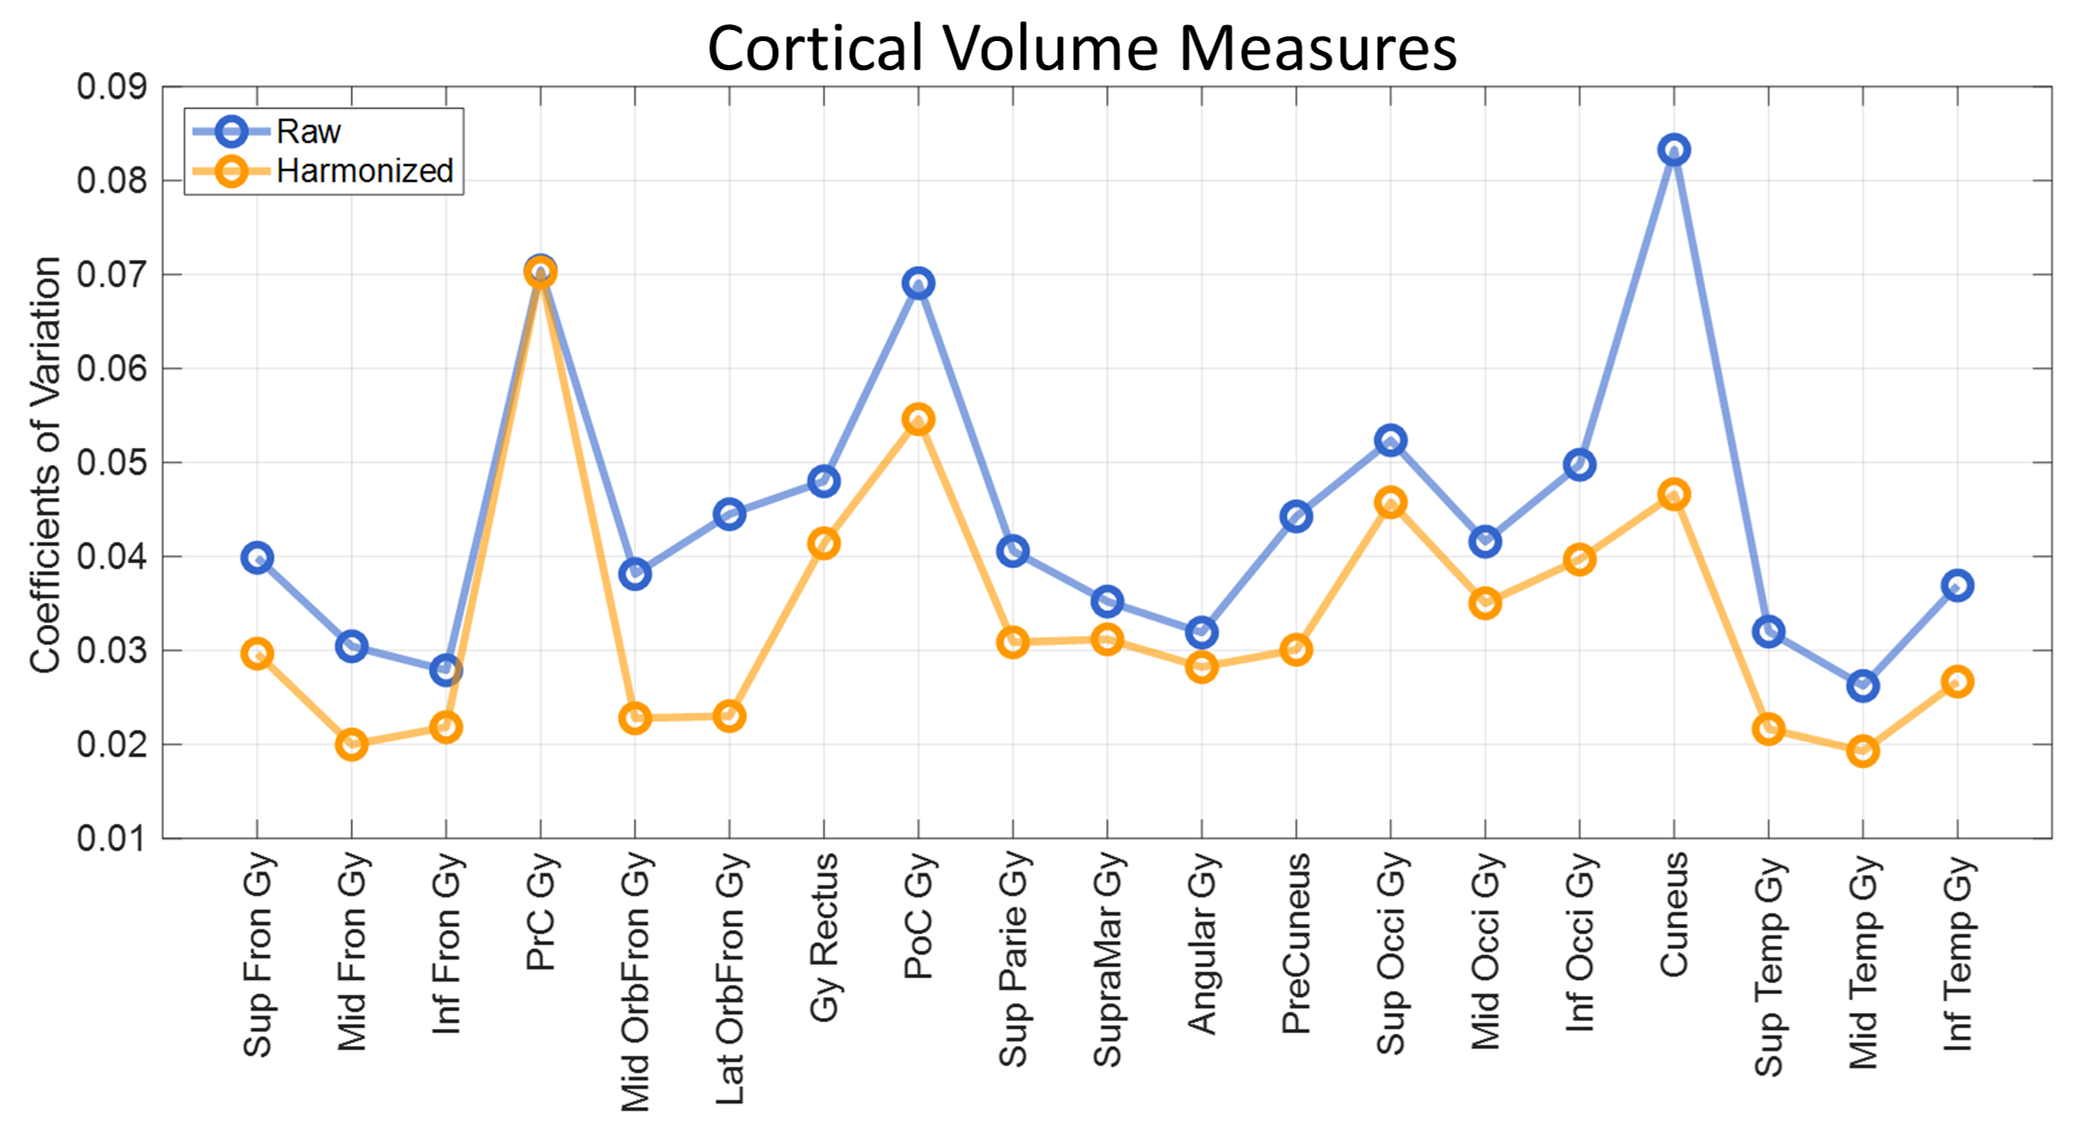
The estimated additive (gamma) and multiplicative (delta) terms of site effect on images were visualized in Figure 2. The additive and multiplicative terms indicated the shift and variation of signal intensity compared to the average, respectively. In the gamma maps, we observed the signal deviation in GE and Philips scanners was more profound compared to SiemensP and SiemensT; the signal difference in cerebrospinal fluid (CSF) and white matter (WM) were clearly distinguishable, implying that adjacent tissue boundaries were easily affected by the site effect. In the delta maps, we found that signal variation was greater in Philips, especially in WM. Also, the heterogeneity around the skull may denote the existence of bias field residual. Besides, we quantified image quality metrics of cross-scanner images (Table 1). In general, signal-to-noise ratio (SNR) of major tissue types were various; SNRs of gray matter (GM) and WM were relatively better in GE and Siemens scanners, respectively. Contrast-to-noise ratio (CNR) between GM and WM was similar but still significantly different between scanners. Coefficient of joint variation (CJV), indicating field inhomogeneity (lower, better), showed the difference across sites, behaving similarly with CNR. After the estimation of site effect was complete, we removed it from images by subtracting additive terms and then dividing multiplicative terms to linearly harmonize cross-scanner data. Although the site effect was not completely erased from images (Table 1), the difference in image quality metrics between scanners was generally decreased, and the structural similarity between cross-scanner data was increased. Also, the image quality metrics such as SNR of WM, CNR, and CJV were improved after preprocessing and site effect removal, suggesting the importance of proper preprocessing procedures and control of site effect. The qualitative result of harmonization was shown in Figure 3. In the result of GM volumetric measures, coefficients of variation for cross-scanner measures were generally reduced (p-value < 0.001) after harmonization; by removing the linear effect of inter-scanner variability, the variation was decreased by 24.4%, implying that the non-linear effect may be up to three-fourth of inter-scanner variation.Discussion & Conclusion
In this study, we established an analytic pipeline incorporating ComBat modeling and superpixel method to estimate the site effect using four-site paired T1-weighted images. The results demonstrated that the variation prominently manifested in tissue contrast, noise level, and field inhomogeneity with respect to cross-site data, providing further insight for the studies focusing on the development of image harmonization methods. Also, the proposed estimation method of site effect can serve as a metric to assess the performance of harmonization.Acknowledgements
This work was supported by the following NIH/NIA grants: R01 AG063752 (D. Tudorascu), P30 AG10129 and UH3 NS100608 (C. DeCarli), and the University of Pittsburgh Alzheimer’s Disease Research Center Grant P30 AG066468 (S. Hwang).References
[1] Bethlehem, R. A., Seidlitz, J., White, S. R., Vogel, J. W., Anderson, K. M., Adamson, C., ... & Schaare, H. L. (2022). Brain charts for the human lifespan. Nature, 604(7906), 525-533.
[2] Pomponio, R., Erus, G., Habes, M., Doshi, J., Srinivasan, D., Mamourian, E., ... & Davatzikos, C. (2020). Harmonization of large MRI datasets for the analysis of brain imaging patterns throughout the lifespan. NeuroImage, 208, 116450.
[3] Dewey, B. E., Zhao, C., Reinhold, J. C., Carass, A., Fitzgerald, K. C., Sotirchos, E. S., ... & Prince, J. L. (2019). DeepHarmony: A deep learning approach to contrast harmonization across scanner changes. Magnetic resonance imaging, 64, 160-170.
[4] Modanwal, G., Vellal, A., Buda, M., & Mazurowski, M. A. (2020, March). MRI image harmonization using cycle-consistent generative adversarial network. In Medical Imaging 2020: Computer-Aided Diagnosis (Vol. 11314, pp. 259-264). SPIE.
[5] Torbati, M. E., Minhas, D. S., Laymon, C. M., Maillard, P., Wilson, J. D., Chen, C. L., ... & Tudorascu, D. L. (2022). MISPEL: A deep learning approach for harmonizing multi-scanner matched neuroimaging data. bioRxiv.
[6] Torbati, M. E., Minhas, D. S., Ahmad, G., O’Connor, E. E., Muschelli, J., Laymon, C. M., ... & Tudorascu, D. L. (2021). A multi-scanner neuroimaging data harmonization using RAVEL and ComBat. Neuroimage, 245, 118703.
[7] Gaser, C., Dahnke, R., Thompson, P. M., Kurth, F., & Luders, E. (2022). CAT-a computational anatomy toolbox for the analysis of structural MRI data. BioRxiv.
[8] Achanta, R., Shaji, A., Smith, K., Lucchi, A., Fua, P., & Süsstrunk, S. (2012). SLIC superpixels compared to state-of-the-art superpixel methods. IEEE transactions on pattern analysis and machine intelligence, 34(11), 2274-2282.
[9] Esteban, O., Birman, D., Schaer, M., Koyejo, O. O., Poldrack, R. A., & Gorgolewski, K. J. (2017). MRIQC: Advancing the automatic prediction of image quality in MRI from unseen sites. PloS one, 12(9), e0184661.
[10] Wang, Z., Bovik, A. C., Sheikh, H. R., & Simoncelli, E. P. (2004). Image quality assessment: from error visibility to structural similarity. IEEE transactions on image processing, 13(4), 600-612.
Figures