4607
Calibration of R2' relaxation rate and hepatic iron concentration by Monte Carlo simulations1School of Biomedical Engineering, Anhui Medical University, Hefei, China, 2Department of MRI, The First Affiliated Hospital of Zhengzhou University, Zhengzhou, China, 3Department of Radiology, The Second Affiliated Hospital of Anhui Medical University, Hefei, China
Synopsis
Keywords: Signal Modeling, Liver
The R2' relaxation rate is expected to become a more specific biomarker in hepatic iron overload because it is not affected by pathological factors. However, calibrating the relationship between R2' relaxation rate and hepatic iron concentration (HIC) at different field strengths is time-consuming. In this work, we develop Monte Carlo simulations to investigate relationship between R2' relaxation rate and HIC in hepatic iron overload at both 1.5T and 3.0T. Results show strong linear relationships between R2' predictions and HIC. The Monte Carlo simulations may greatly shorten the clinical calibration time of MRI relaxation rates and HIC.Introduction
MRI relaxation rates R2 and R2* have been calibrated to biopsy-determined hepatic iron concentration (HIC) at 1.5T1, 2. R2* is composed of an irreversible part characterized by intrinsic relaxation rate R2, and a reversible part denoted as R2' ($$$=$$$R2*$$$-$$$R2). R2' reflects susceptibility-induced intra-voxel dephasing, and stands for the reversible contribution to total relaxation time3. Pathology-induced R2 changes may significantly affect the R2*, but not R2' relaxation rate4. As promising biomarker, R2' relaxation rate has been calibrated with HIC at 1.5T for 102 patients with iron overload1. However, it is cumbersome and expensive to empirically calibrate the relationship between R2' relaxation rate versus HIC, especially for different field strengths. Therefore, the purpose of this work was to develop Monte Carlo simulations for calibration of R2' relaxation rate with HIC at 1.5T and 3.0T.Methods
Virtual liver volumeAs described in previous studies5, 6, a virtual liver volume was simulated with dimensions of $$${80}\times{80}\times{80}$$$ μm3, and iron distribution was incorporated by considering particle size, particle grouping and intercellular anisotropy. Hepatocytes and iron particles were modelled as subcubes and spheres respectively. HIC from 0.5 to 60 mg/g was chosen for simulation, and volume fraction of spheres was calculated as a linear function of HIC7. Iron spheres were then distributed within the liver volume in a nonoverlapping manner, and collisions between iron spheres were resolved by regenerating a new position in 1000 attempts.
MRI signal simulation
Based on the virtual liver volume, MRI signal was simulated as follows:
1) Magnetic field generation: Each iron sphere can produce a dipole field, thus local magnetic field at any given point in the virtual liver volume can be computed as a superposition of dipole fields created by all iron spheres.
2) Proton movement & phase accumulation: A total of 5000 protons were randomly placed in the volume, and proton movement was simulated as an isotropic Gaussian diffusion procedure with time step of 0.5 μs and diffusion coefficient of 0.76 μm2/ms. For each proton, phase accumulation reflected the fluctuation of local magnetic field and the residence time in the field.
3) Signal synthesis & R2' prediction: MRI signal of each proton was computed based on phase evolution, and superposition of signals from all protons yielded the overall signals. For gradient echo sequence, signals were first simulated with echo times uniformly spaced between 1 and 60 ms, and then fit to a monoexponential model for R2* prediction. For single spin echo sequence, signals were first simulated with echo times logarithmically spaced between 0.1 and 30 ms, and then fit to a monoexponential plus a constant model for R2 prediction. Finally, R2' prediction was calculated by subtracting R2 from R2*.
Statistical analysis
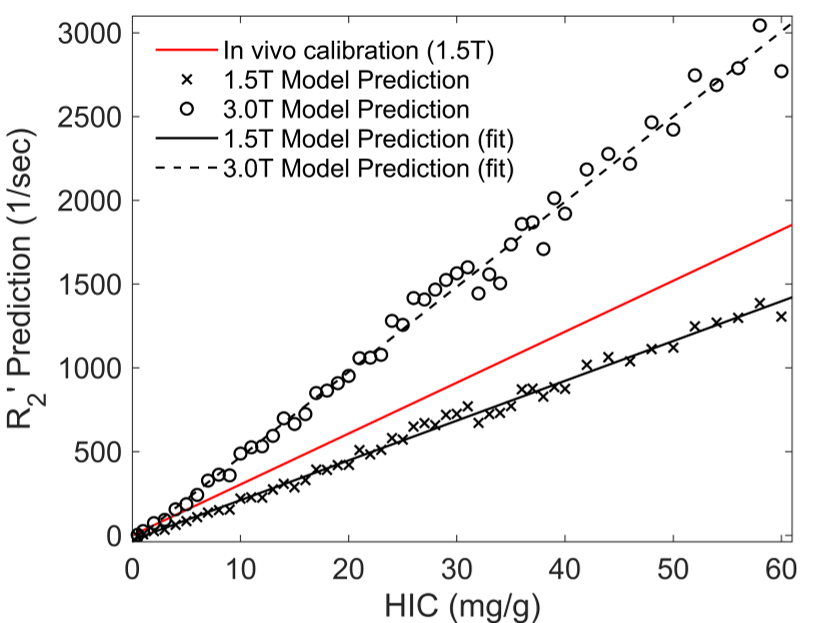
Monte Carlo simulations were implemented at both 1.5T and 3.0T. Linear regression analysis was performed for R2' predictions versus HIC as well as R2' predictions at 1.5T versus 3.0T, and statistical significance was accepted when P < 0.05. In addition, the Bland Altman analysis was used to compare R2' predictions with in vivo calibration1 (R2'=30.40$$$\times$$$HIC) at 1.5T. All experiments were conducted by MATLAB (R2018b, MathWorks, Natick, MA).
Results
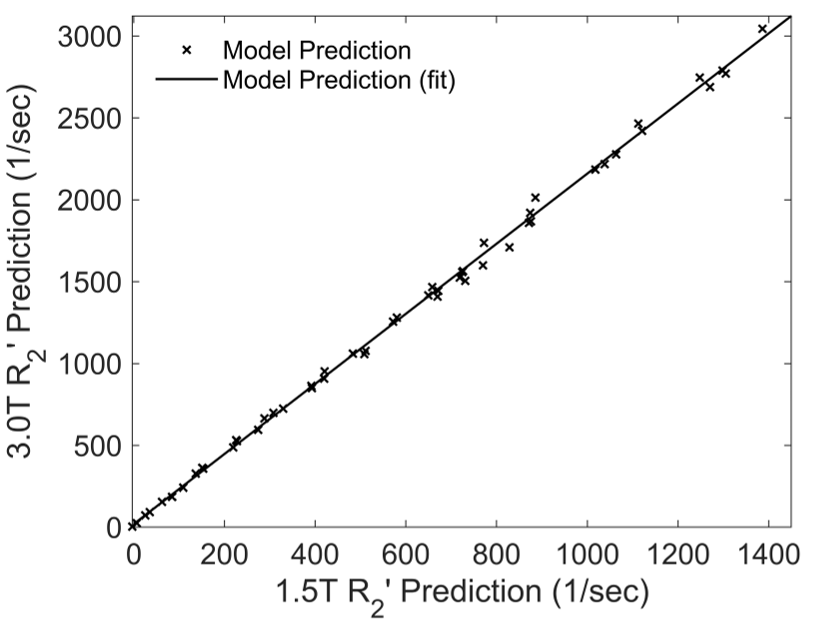
Figure 1 shows three representative virtual liver volumes with HIC of 1.8, 7.0 and 15.0 mg/g as well as their two-dimensional random sections. Three clinical hepatic iron concentration thresholds are selected: 1.8 mg/g (upper limit of normal HIC), 7.0 mg/g (upper limit of optimal for chelation therapy, and threshold for increased risk of hepatic fibrosis, diabetes mellitus, and other complications) and 15.0 mg/g (threshold for severe iron overload with increased risk of early death). Figure 2 shows correlations between R2' predictions and HIC at 1.5T and 3.0T. The R2' prediction rises linearly with HIC, and strong linear relationships are demonstrated with R2'$$$=$$$23.75$$$\times$$$HIC$$$-$$$27.51 (R2 $$$=$$$0.99, P < 0.01) at 1.5T and R2'$$$=$$$50.78$$$\times$$$HIC$$$-$$$39.47 (R2 $$$=$$$0.99, P < 0.01) at 3.0T. At 1.5T, R2' predictions are in good agreement with in vivo calibration curve1, and underestimate clinical calibration by 29.91% according to Bland Altman analysis. Figure 3 shows a linear correlation between R2' predictions at 1.5T versus 3.0T with R2'(3.0T)$$$=$$$2.14$$$\times$$$R2'(1.5T)$$$+$$$19.60, R2$$$=$$$0.99, P < 0.01.Discussion & Conclusions
In this study, Monte Carlo simulations are developed to predict R2' relaxation rate at 1.5T and 3.0T, and relationship of R2' predictions with HIC is investigated as well as R2' predictions across field strengths. Our results demonstrate that linear relationships between R2' predictions and HIC are captured by the simulations and in agreement with in vivo calibration at 1.5T. In addition, R2' predictions increase 2.14 times at 3.0T relative to 1.5T. This study has two limitations. First, the simulations only consider a virtual liver volume with simple geometry and simulation parameters are empirically assumed to be constant, including magnetic susceptibility coefficient of iron and proton diffusion coefficient. Second, more validations are warranted in future to verify the simulation results by phantom and in vivo studies. Moreover, the Monte Carlo simulations can generalize to other field strengths and pulse sequences, and may greatly reduce time cost for empirical calibration of relaxation-iron relationship.Acknowledgements
This work receives support from the National Natural Science Foundation of China (62001005), the Anhui Provincial Natural Science Foundation (2008085QH425), and the Grants for Scientific Research of BSKY (XJ201811) from Anhui Medical University.References
1. Wood J C, Enriquez C, Ghugre N, et al. MRI R2 and R2* mapping accurately estimates hepatic iron concentration in transfusion-dependent thalassemia and sickle cell disease patients. Blood. 2005;106(4): 1460-1465.
2. St Pierre T G, Clark P R, Chua-anusorn W, et al. Noninvasive measurement and imaging of liver iron concentrations using proton magnetic resonance. Blood. 2005;105(2): 855-861.
3. Wang C, Zhao K, Zhang R, et al. Evaluation of renal oxygenation change under the influence of carbogen breathing using a dynamic R2, R2' and R2* quantification approach. NMR Biomed. 2016;29(11): 1601-1607.
4. Ni W, Christen T, Zun Z, et al. Comparison of R2' measurement methods in the normal brain at 3 Tesla. Magn Reson Med. 2015;73(3): 1228-1236.
5. Ghugre N R, Wood J C. Relaxivity-iron calibration in hepatic iron overload: probing underlying biophysical mechanisms using a Monte Carlo model. Magn Reson Med. 2011;65(3): 837-847.
6. Wang C, Reeder S B, Hernando D. Relaxivity-iron calibration in hepatic iron overload: Reproducibility and extension of a Monte Carlo model. NMR Biomed. 2021;34(12): e4604.
7. Ghugre N R, Gonzalez-Gomez I, Shimada H, et al. Quantitative analysis and modelling of hepatic iron stores using stereology and spatial statistics. J Microsc. 2010;238(3): 265-274.
Figures
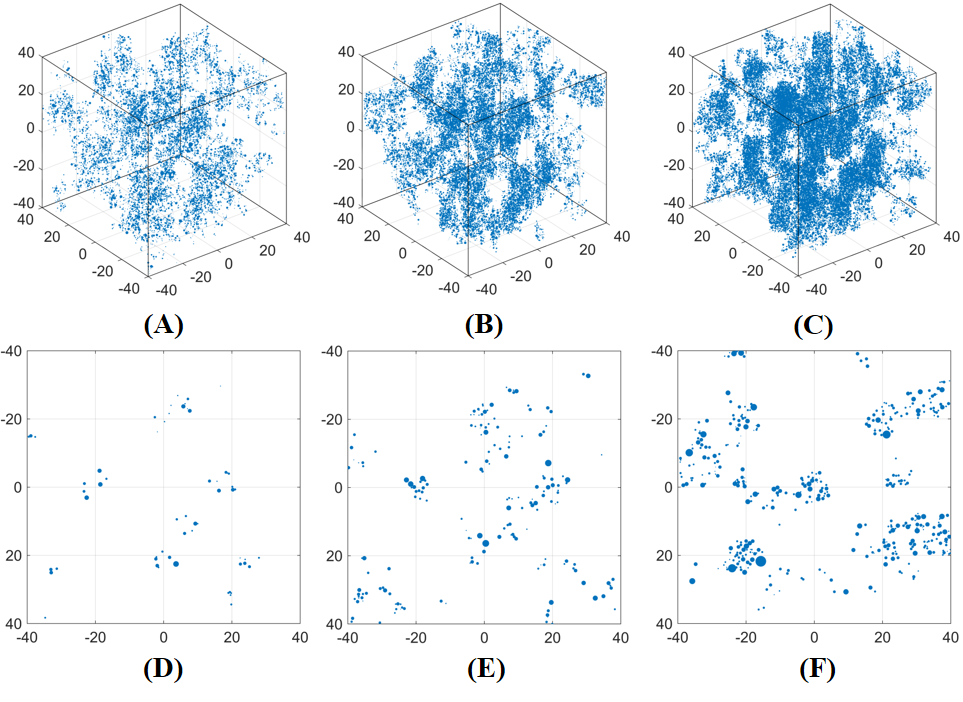
Figure 1. Three representative virtual liver volumes with HIC of 1.8 mg/g (A), 7.0 mg/g (B) and 15.0 mg/g (C), as well as their two-dimensional random sections (D-F). Note that the volume is simulated as an $$${80}\times{80}\times{80}$$$ μm3 cube, and the blue dots represent iron spheres.