4604
Partial Volume Averaging of Diffusion Tensor Imaging in the Fornix1The Cleveland Clinic, Cleveland, OH, United States, 2Imaging Institute, The Cleveland Clinic, Cleveland, OH, United States
Synopsis
Keywords: Signal Modeling, Multiple Sclerosis
Diffusion Tensor Imaging of the fornix promises to serve as an imaging biomarker for cognitive decline in multiple sclerosis and Alzheimer’s disease. As the fornix is surrounded by cerebrospinal fluid in the lateral ventricles, partial volume averaging can bias measures of tissue microstructure. Here, we use a high spatial resolution, multishell acquisition to test the methods for combating partial volume averaging in the fornix.INTRODUCTION
Diffusion Tensor Imaging (DTI) of the fornix promises to serve as a predictive imaging biomarker for cognitive decline in multiple sclerosis1-3 and Alzheimer’s disease4. As the fornix is surrounded by cerebrospinal fluid (CSF) in the lateral ventricles, partial volume averaging (PVA) can lead to biased measures of tissue microstructure5. One countermeasure to PVA is high spatial resolution. Previous work suggests that 1mm isotropic resolution is sufficient to avoid PVA in the fornix1-3. Another approach entails modeling of data from imaging acquisitions that use multishell acquisitions6,7. Multishell acquisitions have multiple diffusion weightings. The models fit the data to a tissue fraction and a CSF fraction. Here, we combine the two approaches, using a high spatial resolution, multishell acquisition to test the hypothesis that PVA has been adequately controlled.METHODS
One healthy subject was scanned under an IRB-approved protocol on a Siemens 3T Prisma with a standard 32-channel head coil (Siemens Healthineers, Erlangen). Multishell diffusion images (1mm isotropic voxels, 192mm x 192mm x 128mm FOV, 10/3/12/27/48 b=0/125/250/375/500 sec/mm2 TA=28 min) and a single reverse phase-encode images were acquired. Another set of scans with simultaneous multislice (SMS) acceleration factor 2 was also acquired (TA=26 min). All diffusion images were denoised8, corrected for Gibbs ringing9, corrected for susceptibility and eddy current distortion and motion10. A weighted least-squares fit to the diffusion tensor using dtifit10 was performed to determine standard DTI measures (mean diffusivity (MD), fractional anisotropy (FA), longitudinal diffusivity (LD) transverse diffusivity (TD)). The same data were fit to a partial volume model6,11 to yield corrected values (cMD, cFA, cLD, cTD) and an estimate of the fraction of signal attributable to CSF (fCSF). The fornix was segmented from an MPRAGE12 and coregistered to DTI space13. Normative DTI values were calculated in pure white matter (WM). To identify these voxels, the MPRAGE was segmented14, maps of white matter fraction were coregistered to DTI space and voxels with 100% white matter were selected.RESULTS
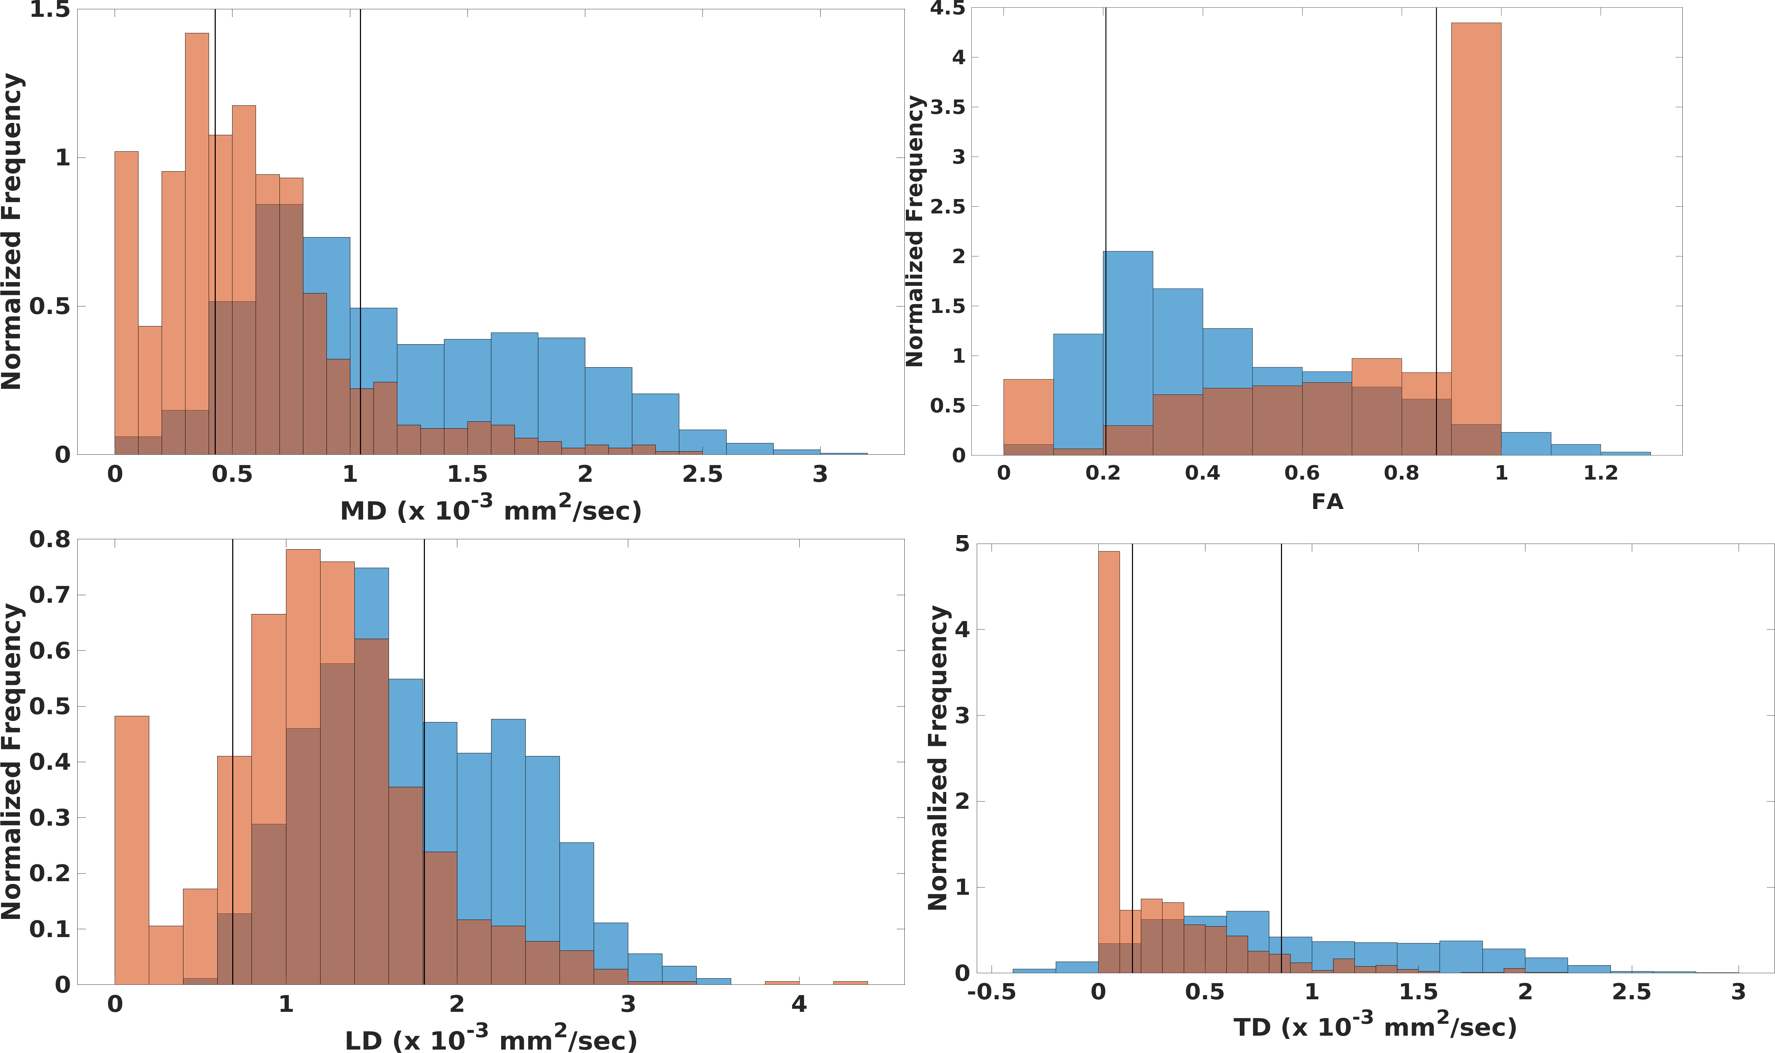
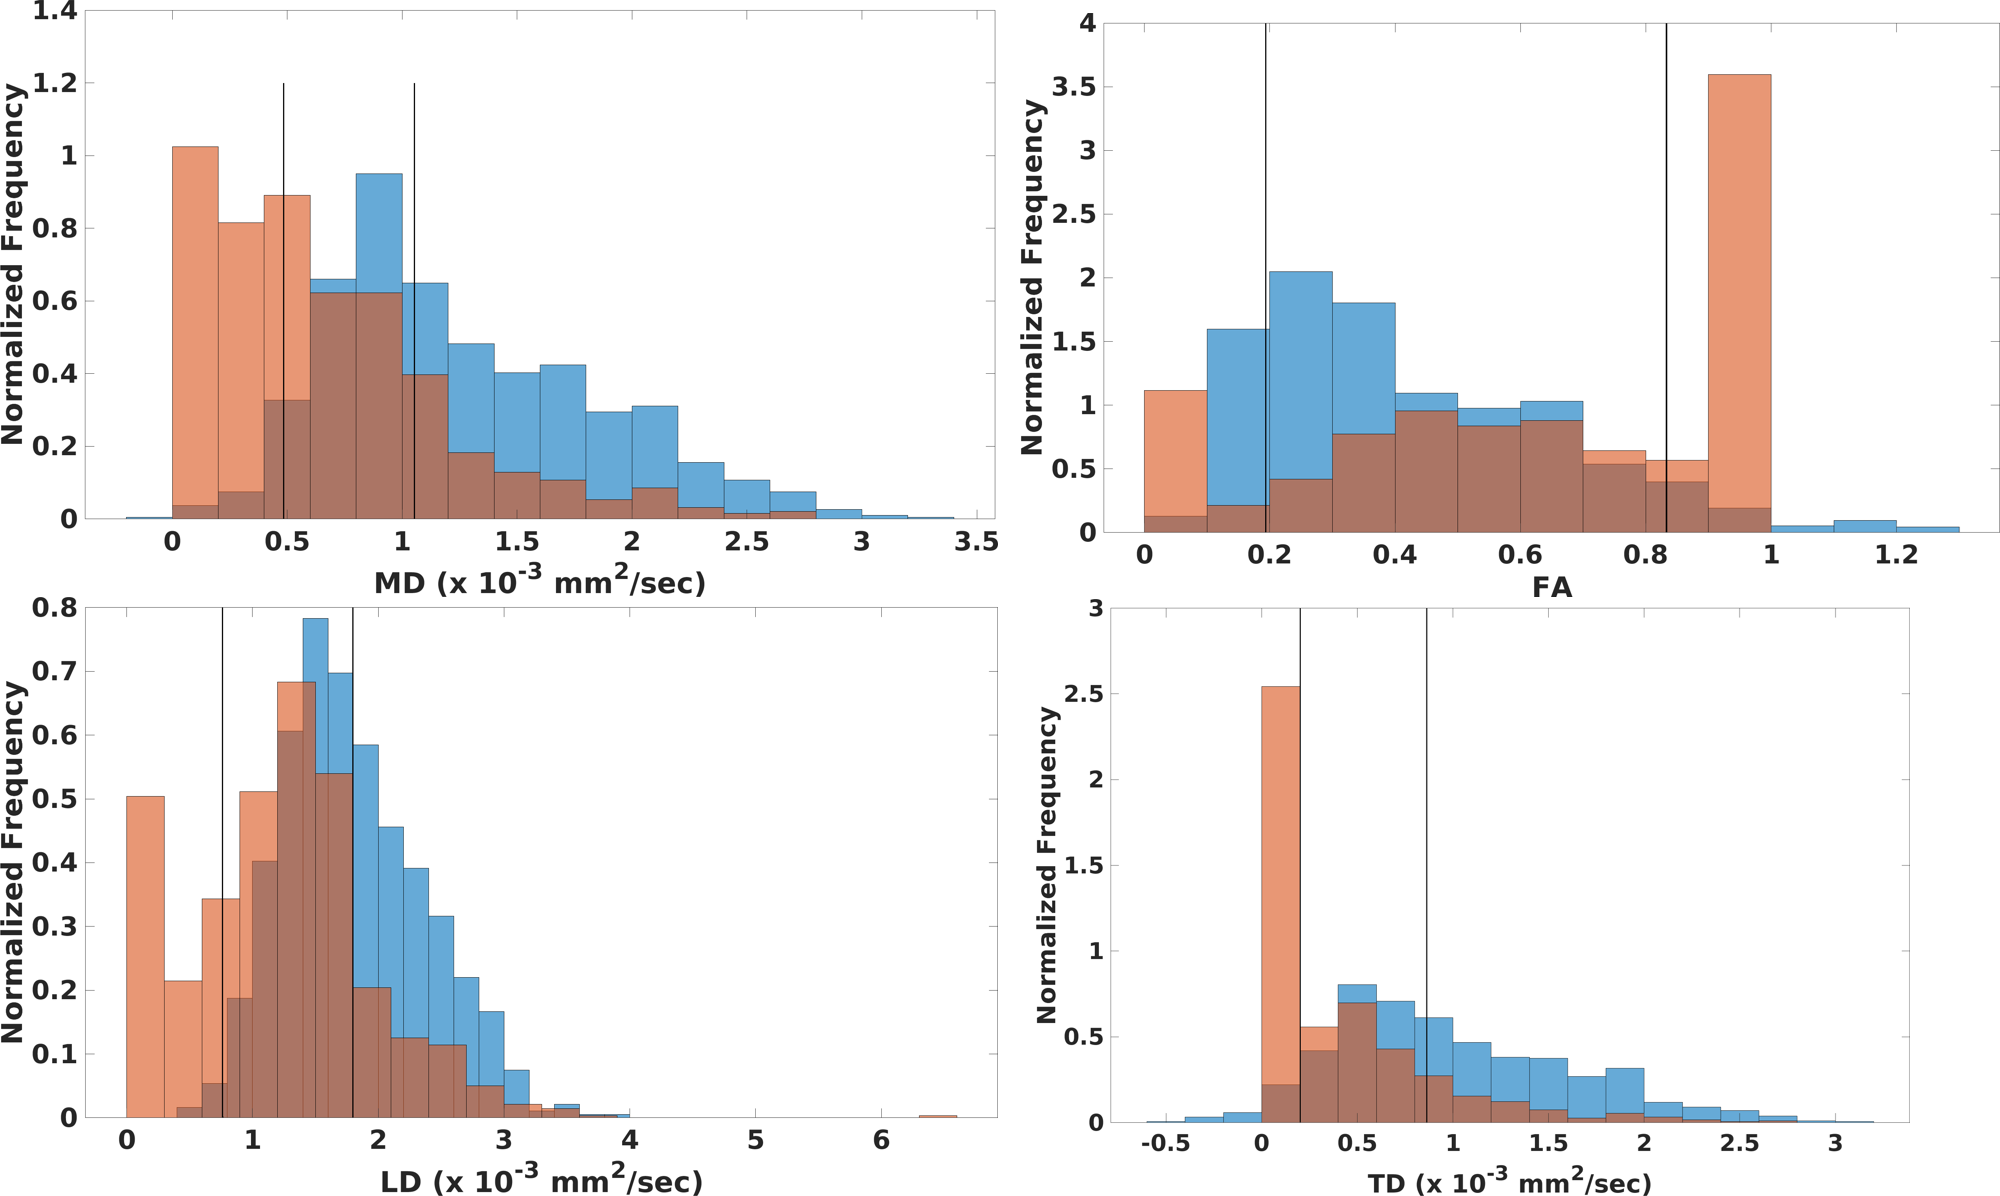
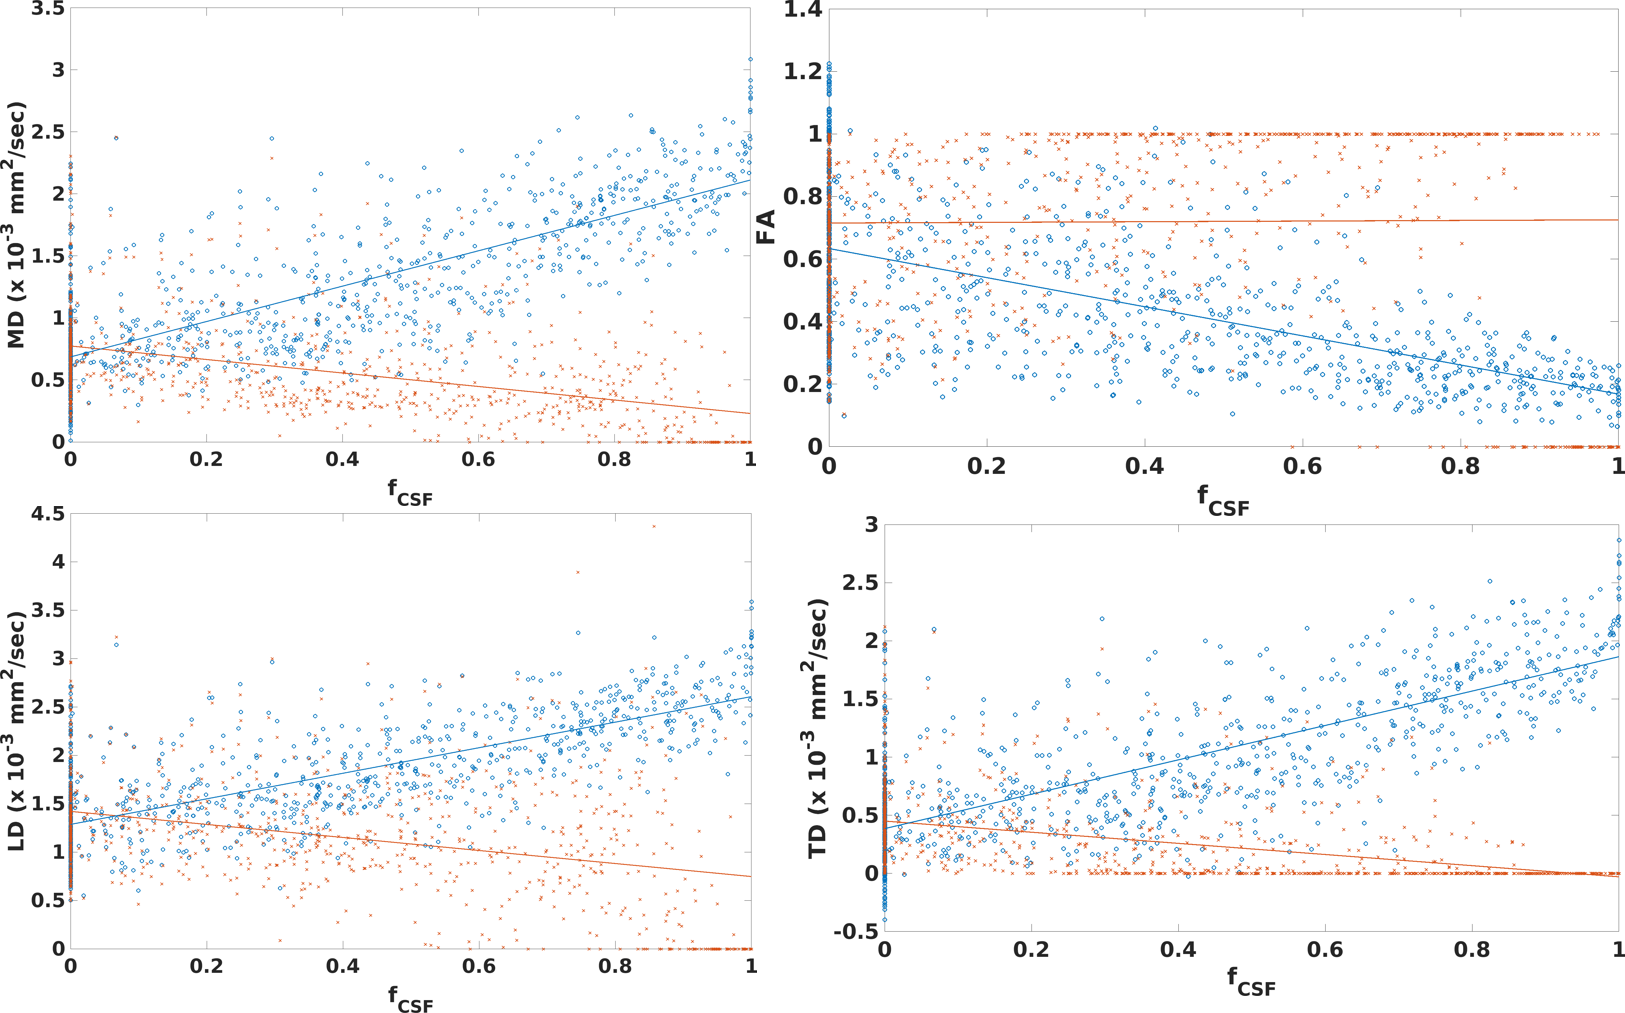
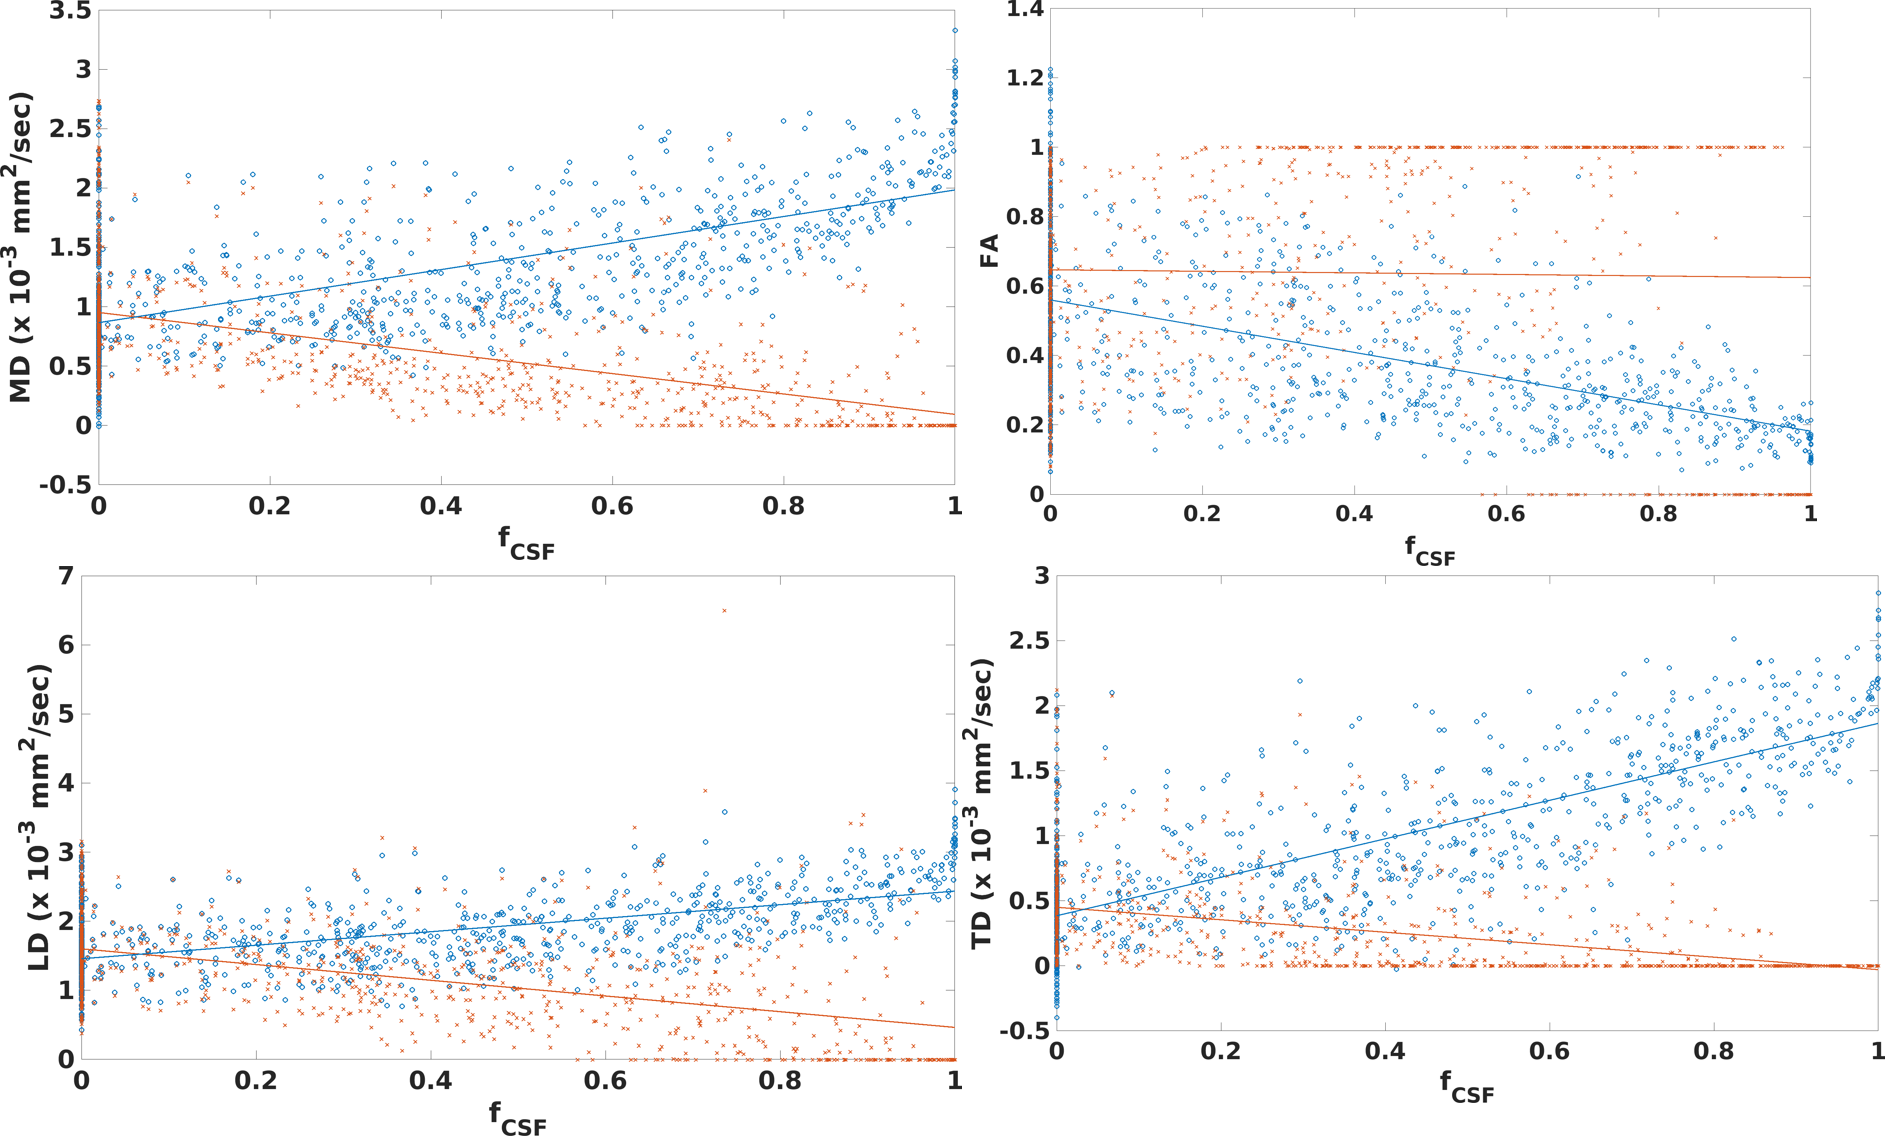
Figure 1 shows values of DTI measures in fornix as compared to those in pure white matter. Diffusivities calculated with a standard weighted least squares fit are significantly higher than pure white matter while FA is significantly lower (p < 10-6, Wilcoxson rank sum test). Values that were corrected for PVA showed the opposite trend: diffusivities are significantly lower than that in pure white matter while FA is higher (p < 0.006). PVA with CSF is substantial, with fCSF = 0.34±0.67 (median±interquartile ratio). Figure 2 shows results for the SMS-accelerated scan. Results are similar to that of the non-accelerated scan, except that cLD is not significantly different from that of pure white matter (p > 0.5). In the accelerated scan, fCSF = 0.31±0.66. Figure 3 shows plots of DTI parameters as a function of fCSF. Diffusivities calculated with a standard weighted least-squares show a positive correlation with fCSF and FA shows a negative correlation. Diffusivity values that were corrected for PVA showed negative correlation with fCSF while FA did not correlate (R = 0.01, p > 0.7). A substantial number of voxels (69 out of 902) have zero values for all parameters while an additional 266 voxels have zero TD. fCSF ranges to values as low as 0.58 among these voxels, so this behavior is not explained by the voxel being represented as pure CSF. Figure 4 shows a similar plot for SMS-accelerated values. Trends are similar to the non-accelerated case.DISCUSSION
Together, the results suggest that the 1mm spatial resolution scan used in this study does not eliminate PVA effects, but tissue fraction modeling seems to overcorrect. For DTI values calculated with a standard fit, high diffusivity values and low FA values, as compared to tissue far from CSF, are what one would expect if there is contamination of signal from CSF. Modeling suggests substantial PVA between tissue and CSF, yielding substantial CSF fraction, on average. However, modeling does introduce difficulties, such as systematically low diffusivities, as compared to tissue far from CSF and a substantial number of voxels with DTI values of zero. The acquisition used here differed from those used in previous work, which used more diffusion weightings, a longer scan and a larger maximum diffusion weighting1-3. The acquisition also deviates from that used to optimize the partial volume correction developed by Hoy et al.6, which featured larger voxels and larger diffusion weightings. The maximum diffusion weighting of 500 sec/mm2 was chosen to avoid bias due to noise floor effects15. It is possible that recent advances in reconstruction to increase SNR16 or explicitly account for Rician noise bias17 can allow larger diffusion weightings, smaller voxels and overall better DTI estimates without PVA artifact.CONCLUSION
PVA artifact in small structures surrounded by CSF remains an open challenge. Advances in both acquisition and modelling will be necessary to limit the level of the artifact.Acknowledgements
We acknowledge support from the Imaging Institute of the Cleveland Clinic and Siemens Healthineers.
References
1. Phillips, M., Koenig, K. A., Beall, E. B., Stone, L., Zimbelman, J., Marrie, R. A., Sakaie, K. E., Rao, S. M. & Lowe, M. J. Diffusion tensor imaging measures of forniceal damage correlate with episodic memory dysfunction in multiple sclerosis patients. Multiple Sclerosis 2008; 14:S210-S210.
2. Koenig, K. A., Sakaie, K. E., Lowe, M. J., Lin, J., Stone, L., Bermel, R. A., Beall, E. B., Rao, S. M., Trapp, B. D. & Phillips, M. D. Hippocampal volume is related to cognitive decline and fornicial diffusion measures in multiple sclerosis. Magn Reson Imaging 2014; 32:354-358.
3. Koenig, K. A., Sakaie, K. E., Lowe, M. J., Lin, J., Stone, L., Bermel, R. A., Beall, E. B., Rao, S. M., Trapp, B. D. & Phillips, M. D. The relationship between cognitive function and high-resolution diffusion tensor MRI of the cingulum bundle in multiple sclerosis. Multiple sclerosis (Houndmills, Basingstoke, England) 2015; 21:1794-1801.
4. Nowrangi, M. A. & Rosenberg, P. B. The fornix in mild cognitive impairment and Alzheimer's disease. Front Aging Neurosci 2015; 7:1.
5. Metzler-Baddeley, C., O'Sullivan, M. J., Bells, S., Pasternak, O. & Jones, D. K. How and how not to correct for CSF-contamination in diffusion MRI. Neuroimage 2012; 59:1394-1403.
6. Hoy, A. R., Koay, C. G., Kecskemeti, S. R. & Alexander, A. L. Optimization of a free water elimination two-compartment model for diffusion tensor imaging. Neuroimage 2014; 103:323-333.
7. Bergmann, O., Henriques, R., Westin, C. F. & Pasternak, O. Fast and accurate initialization of the free-water imaging model parameters from multi-shell diffusion MRI. NMR Biomed 2020; 33:e4219.
8. Veraart, J., Novikov, D. S., Christiaens, D., Ades-Aron, B., Sijbers, J. & Fieremans, E. Denoising of diffusion MRI using random matrix theory. Neuroimage 2016; 142:394-406.
9. Lee, H. H., Novikov, D. S. & Fieremans, E. Removal of partial Fourier-induced Gibbs (RPG) ringing artifacts in MRI. Magn Reson Med 2021; 86:2733-2750.
10. Jenkinson, M., Beckmann, C. F., Behrens, T. E., Woolrich, M. W. & Smith, S. M. Fsl. Neuroimage 2012; 62:782-790.
11. Henriques, R. N., Rokem, A., Garyfallidis, E., St-Jean, S., Peterson, E. T. & Correia, M. M. [Re] Optimization of a free water elimination two-compartment model for diffusion tensor imaging. ReScience 2017; 3:2.
12. Greve, D. N., Billot, B., Cordero, D., Hoopes, A., Hoffmann, M., Dalca, A. V., Fischl, B., Iglesias, J. E. & Augustinack, J. C. A deep learning toolbox for automatic segmentation of subcortical limbic structures from MRI images. Neuroimage 2021; 244:118610.
13. Avants, B. B., Tustison, N. J., Song, G., Cook, P. A., Klein, A. & Gee, J. C. A reproducible evaluation of ANTs similarity metric performance in brain image registration. Neuroimage 2011; 54:2033-2044.
14. Ashburner, J. & Friston, K. J. Unified segmentation. Neuroimage 2005; 26:839-851.
15. Jones, D. K. & Basser, P. J. "Squashing peanuts and smashing pumpkins": how noise distorts diffusion-weighted MR data. Magn Reson Med 2004; 52:979-993.
16. Moeller, S., Pisharady, P. K., Ramanna, S., Lenglet, C., Wu, X., Dowdle, L., Yacoub, E., Ugurbil, K. & Akcakaya, M. NOise reduction with DIstribution Corrected (NORDIC) PCA in dMRI with complex-valued parameter-free locally low-rank processing. Neuroimage 2021; 226:117539.
17. Sakaie, K. & Lowe, M. Retrospective correction of bias in diffusion tensor imaging arising from coil combination mode. Magn Reson Imaging 2017; 37:203-208.Figures