4600
A dual multi-dimensional integration (dMDI) method for reliable noise masking1United Imaging, Houston, TX, United States
Synopsis
Keywords: Signal Modeling, Data Processing
A dual multi-dimensional integration (dMDI) method was proposed for reliable image noise masking. By adopting a state-of-the-art MDI method, a signal ratio and a reciprocal signal ratio were constructed in the proposed dMDI method. The product of the two signal ratios display a highly reliable dependency of the intrinsic SNR of the signals, which can serve as a voxel-wise noise mask.Introduction
Determining a reliable noise mask for MRI images is challenging, especially for scenarios with low intrinsic signal-to-noise ratio (SNR) or at boundaries such as between tissues and backgrounds. Simply using a threshold cannot address all those real-life scenarios, while more sophisticated schemes on signal acquisition, noise analysis and image processing more or less suffer from certain caveats (1,2).Retrospectively, MR imaging noise analysis has been mostly based on real signals (3,4), predominantly on the signal magnitude images after certain coil combination process. However, real signal processing alters the noise behavior from Gaussian to Rician or Rayleigh (5). To our best knowledge, the intrinsic signal SNR effect has seldom, if ever, been analyzed in the multi-dimensional complex domain.
In this study, we propose and demonstrate a dual multi-dimensional integration (dMDI) for reliable image noise masking, which is sensitive to the intrinsic complex signal SNR on a voxel-wise domain, especially in the low SNR regime.
Methods
Consider two complex signals of a voxel, e.g. from two independent repetitions or echoes. Also assume a multi-channel coil is used. Let S1j and S2j be the true signals of the jth channel, and complex Gaussian noise ε = σ + iσ, where σ is the noise standard deviation. The noisy signals of the jth channel are thus S’1j=S1j+ε and S’2j=S2j+ε.The MDI method (6) defines a signal ratio as R≡B/A, which can be numerically calculated as $$$r=\frac{\sum_{}^{N_{1},N_{2}...}a^{*}b}{\sum_{}^{N_{1},N_{2}...}a^{*}a}$$$ by solving the problem of $$$min_{R}\left \| B-A\cdot R \right \|_{2}^{2}$$$, where N1, N2… are the signal dimension lengths in the signal sets of A and B, and a and b denote individual data points from A and B respectively. In light of this, we propose constructing two signal ratios in the following form:
$$R_{1}\equiv \frac{S_{1}}{S_{2}}=\frac{\sum_{j}^{}S_{2j}^{'*}S_{1j}^{'}}{\sum_{j}^{}S_{2j}^{'*}S_{2j}^{'}} [1]$$
$$R_{2}\equiv \frac{S_{2}}{S_{1}}=\frac{\sum_{j}^{}S_{1j}^{'*}S_{2j}^{'}}{\sum_{j}^{}S_{1j}^{'*}S_{1j}^{'}} [2]$$
where R1 is the same as the MDI signal ratio while R2 is the reciprocal, thus the term ‘dual’ MDI.
Accordingly, the noise mask is proposed as:
$$R=\left | R_{1}R_{2} \right | [3]$$
The range of R lies between 0 and 1, with R=0 corresponding to zero SNR or pure noise and R=1 to infinitely high SNR.
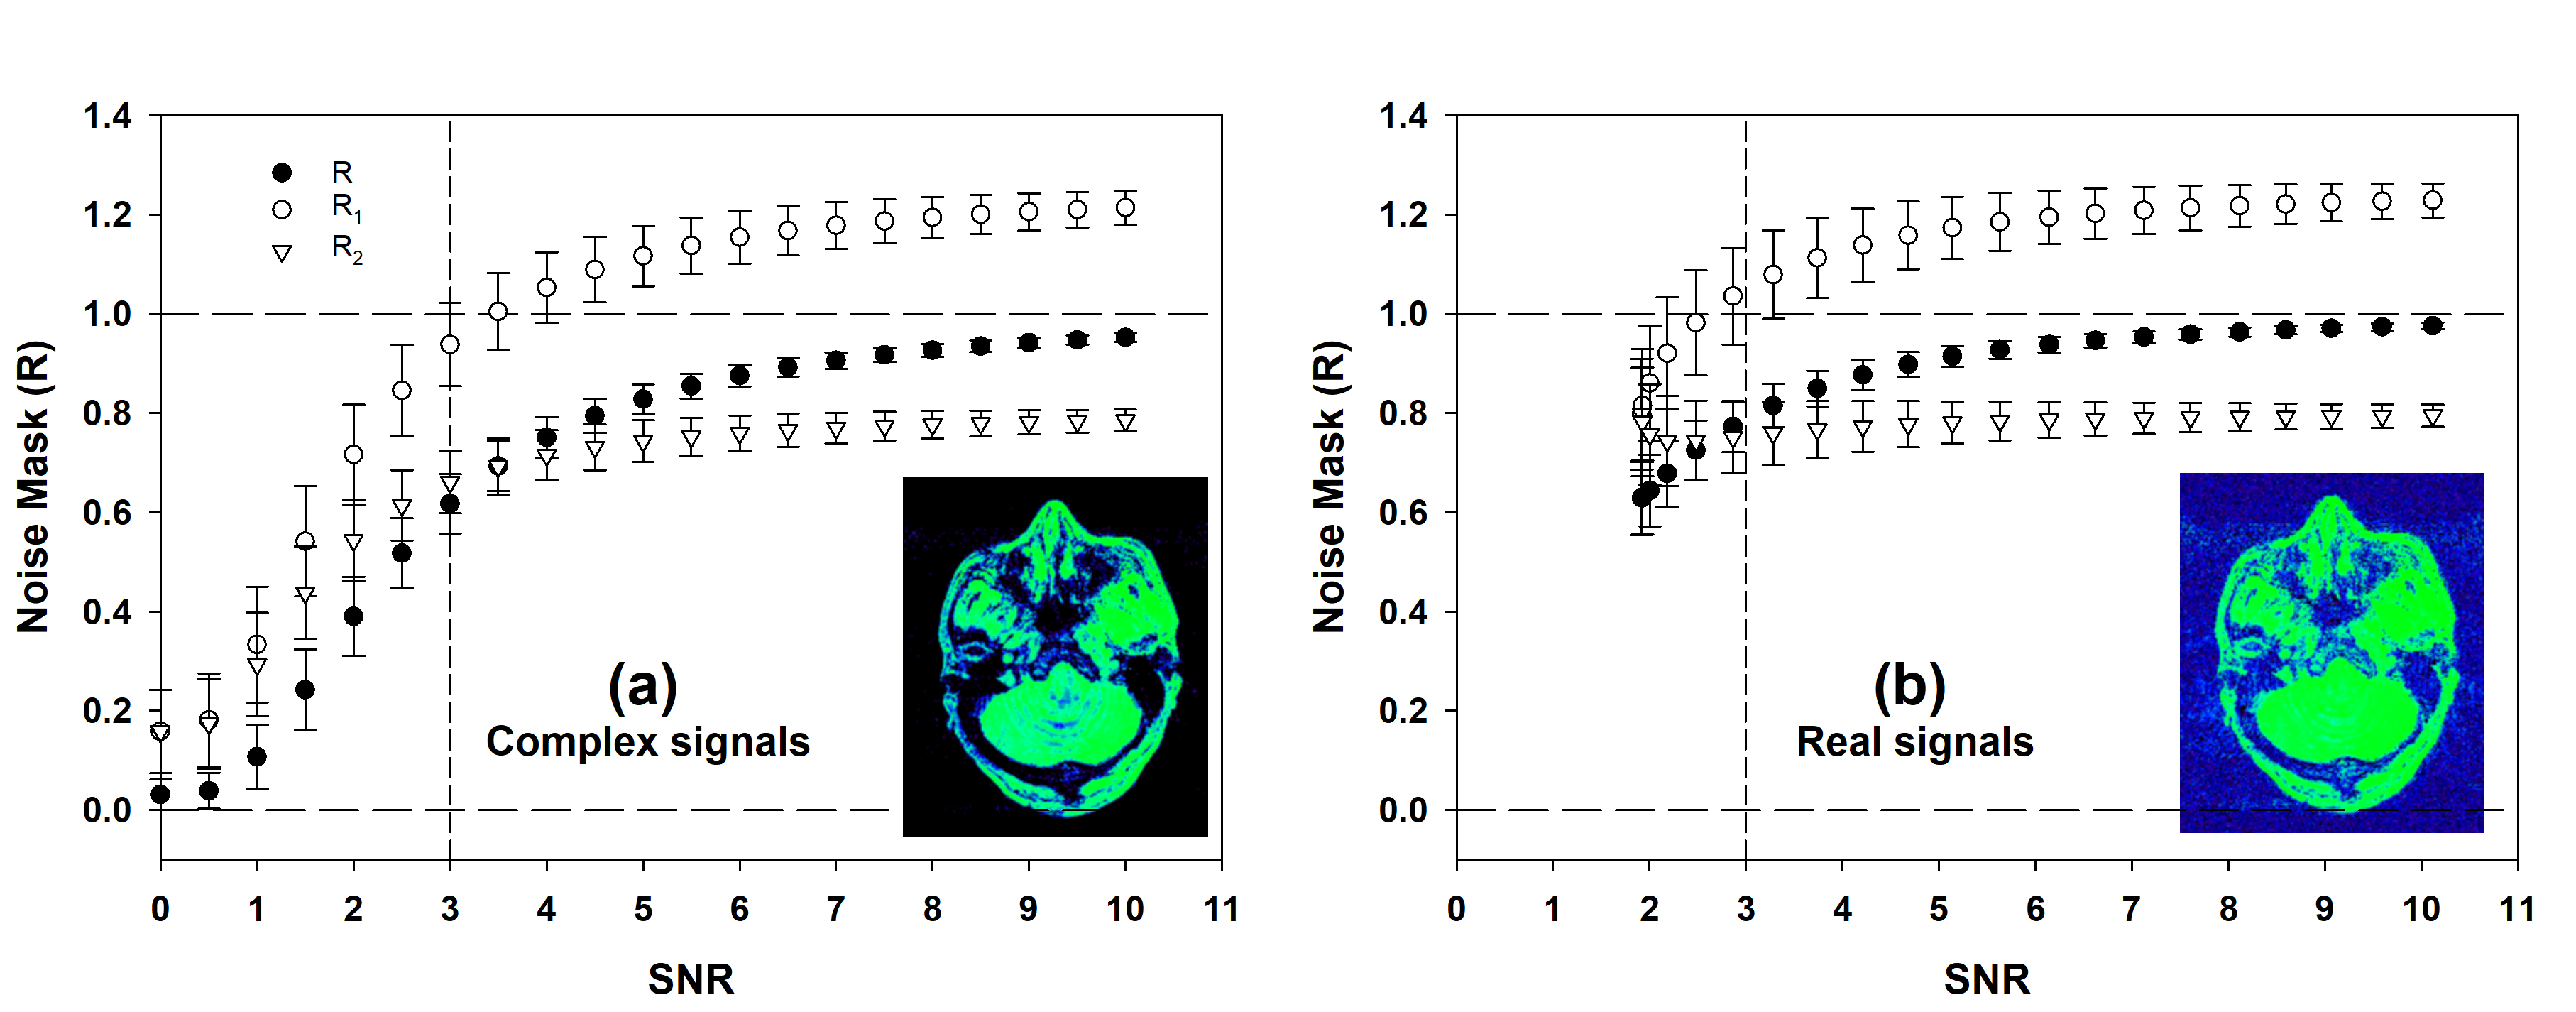
To demonstrate the relationship of R vs. SNR, Monte Carlo simulation was performed as followed: σ=1, S1=0~10 and thus SNR of 0~10. S2=0.8S1 (S2 can be arbitrary values though). Assuming the channel number is 32, Eqs.1~3 were repeatedly simulated 106 times for each S1 intensity level.
For MRI testing, brain data were acquired using a 3D GRE dual-echo sequence on a 5T scanner (uMR Jupiter, UIH, Shanghai, China) with TE = 3&7ms respectively, TR = 20ms, FA=10°, voxel size =0.8x0.8x2mm3. A 48-channel head coil was used. The complex images of all 48 individual channels and both echoes were first reconstructed, then the noise mask was calculated using Eqs.1~3.
Results
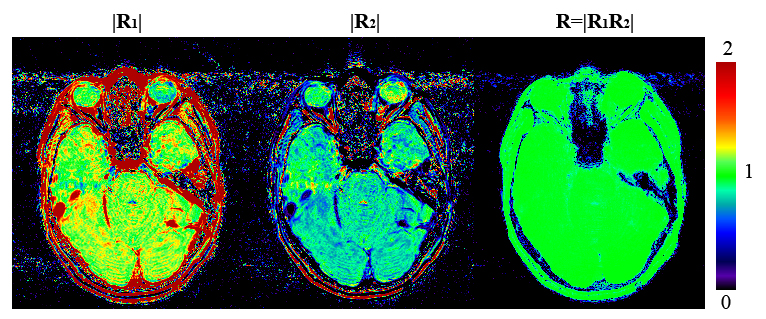
Simulation of R vs. SNR is shown in Figure.1, comparing dMDI results with complex and real signals as input. With complex processing, R is very close to zero for SNR<1 (Figure.1a), and rapidly increases towards 1 as SNR increases. On the other hand, real signals processing (Figure.1b) holds a lower limit at R≈0.63, therefore low SNR and pure noise signals (i.e. SNR < 1.91) cannot be reliably suppressed.Figure.2 shows an exemplary noise mask of the brain. Because of T2* decay, the first/second echo’s signal intensity is higher/lower for most tissues, thus the R1/R2 images show overall >1/<1 values. For background voxels, however, both R1&R2 images display very low values. Thus the resultant R image is uniformly close-to-1 in tissues and uniformly close-to-0 in backgrounds, with rapid yet smooth transition at tissue-air boundaries.
Figure.3 illustrates the noise masking effects, with the difference image indicating selective suppression of the noise without affecting tissue signals.
Discussion & conclusions
Image noise suppression has been challenging, and numerous strategies from image domain (7) to k-space domain (8), and from model based (9) to AI assisted (10) have been proposed. In this work, a dMDI method is proposed for reliable noise masking associated with the intrinsic signal SNR. At first glance, the proposed concept of R would seem counterintuitive, as the product of two reciprocals should simply be 1. However, with the proposed dMDI method, the R1 and R2 ratios (Eqs.1&2) are weighted differently, that R1 is weighted by S2 of each channel and vice versa. As a result, their product R will approach zero rather than 1 at low SNR (Figure.1).With a deeper look between complex and real processing results(Figure.1), the complex processing clearly offered highly reliable suppression on noise and low SNR signals (Fig.1a), as complex processing preserves the Gaussian distribution in noise and resulting in the numerator of both R1&R2 approaching 0 at low SNR (11). Therefore, it will be favorable to use high-channel phased-array coils.
On the other hand, the statistical distribution of noise in real domain is Rician or Rayleigh with a non-zero mean, leading to a theoretical minimal SNR of ~1.9. As a result, the R value bottoms at 0.63 (Fig.1b) and cannot achieve reliable suppression on pure noise.
In conclusion, a dMDI noise masking method was proposed and demonstrated to be highly sensitive and reliable to the intrinsic signal SNR.
Acknowledgements
No acknowledgement found.References
1.Veraart J, Fieremans E, Novikov DS. Diffusion MRI noise mapping using random matrix theory. Magn Reson Med 2016;76(5):1582-1593.
2.Manjon JV, Coupe P, Buades A. MRI noise estimation and denoising using non-local PCA. Medical image analysis 2015;22(1):35-47.
3.Pandian DS, Ciulla C, Haacke EM, Jiang J, Ayaz M. Complex threshold method for identifying pixels that contain predominantly noise in magnetic resonance images. J Magn Reson Imaging 2008;28(3):727-735.
4.Ocali O, Atalar E. Ultimate intrinsic signal-to-noise ratio in MRI. Magn Reson Med 1998;39(3):462-473.
5.Haacke EM, Brown R, Thompson M, Venkatesan R. Magnetic resonance imaging. Physical principles and sequence design. New York: Wiley-Liss: 1999. 32-45 p.
6.Ye Y, Zong J, Lyu J, Zhang W. SWI+: A roubust artifact-free SWI procedure with improved contrast. Proceedings 26th Scientific Meeting, International Society for Magnetic Resonance in Medicine. Paris, France; 2018. p. 4135.
7.Thunberg P, Zetterberg P. Noise distribution in SENSE- and GRAPPA-reconstructed images: a computer simulation study. Magn Reson Imaging 2007;25(7):1089-1094.
8.Ding Y, Ying L, Zhang N, Liang D. Noise behavior of MR brain reconstructions using compressed sensing. Conf Proc IEEE Eng Med Biol Soc 2013;2013:5155-5158.
9.Khan AF, Younis MS, Bajwa KB. Nonlinear Bayesian estimation of BOLD signal under non-Gaussian noise. Comput Math Methods Med 2015;2015:389875.
10.Kidoh M, Shinoda K, Kitajima M, et al. Deep Learning Based Noise Reduction for Brain MR Imaging: Tests on Phantoms and Healthy Volunteers. Magn Reson Med Sci 2019.
11.Ye Y, Lyu J, Hu Y, Zhang Z, Xu J, Zhang W. Augmented T1 weighted (aT1W) contrast using dual flip angles acquisition. Proceedings 29th Scientific Meeting, International Society for Magnetic Resonance in Medicine; 2021. p. 2606.
Figures