4597
Estimation of the Spatial Gradient of the MR Image from the Diffusion Profile1Athinoula A. Martinos Center for Biomedical Imaging, Massachusetts General Hospital, Boston, MA, United States, 2Radiology Department, Harvard Medical School, Boston, MA, United States, 3Siemens Healthcare GmbH, Erlangen, Germany
Synopsis
Keywords: Signal Modeling, Diffusion Tensor Imaging
In the course of diffusion, water molecules experience varying values for the relaxation-time property of the underlying tissue, a factor that has not been accounted for in diffusion MRI (dMRI) modeling. Accordingly, we derive a relationship between the diffusion profile measured by dMRI and the spatial gradient of the image, and subsequently estimate the latter from the former. We test our hypothesized relationship via dMRI of the human brain (a public in vivo image and an acquired ex vivo stimulated-echo image), showing statistically significant results that may be due to our model and/or the confounding factor of “fiber continuity”.INTRODUCTION
The diffusion MRI (dMRI) signal is proportional to the mean proton density (PD) inside a voxel, weighted according to tissue relaxation times,1 and attenuated by water molecule displacement. The Stejskal-Tanner pulsed gradient spin-echo sequence2 applies two gradient pulses $$$\vec{G}$$$ of duration $$$\delta$$$, separated in time by $$$\Delta$$$. Molecules located at $$$\vec{x}_0$$$ during the first pulse and ending up at $$$\vec{x}=\vec{x}_0+\vec{u}$$$ at the second pulse presumably contribute the following to the signal $$$S^v(\vec{q})$$$ at voxel $$$v$$$, where $$$\vec{q}:=\gamma\delta\vec{G}$$$ with $$$\gamma$$$ the gyromagnetic ratio:3| $$\begin{aligned}S^v(\vec{q})&=\int_vw\left(\vec{x}_0\right)\rho\left(\vec{x}_0\right)\operatorname{Pr}\left(\vec{x}\mid\vec{x}_0\right)e^{-i\vec{q}\cdot\left(\vec{x}-\vec{x}_0\right)}\mathrm{d}\vec{x}_0\mathrm{~d}\vec{x}\\&=\int_vw\left(\vec{x}_0\right)\rho\left(\vec{x}_0\right)\mathrm{d}\vec{x}_0\int\operatorname{Pr}\left(\vec{u}\mid\vec{x}_0\right)e^{-i\vec{q}\cdot\vec{u}}\mathrm{~d}\vec{u}\\&=S_0^v\hat{P}^v(\vec{q}),\end{aligned}$$ | (1) |
For model simplification, the relaxation-time properties of tissue have been assumed to be constant along the diffusion trajectory. Since the spatial distribution of molecules diffusing from $$$\vec{x}_0$$$ to $$$\vec{x}$$$ is their initial density, the integrals are weighted by $$$\rho\left(\vec{x}_0\right)$$$. However, $$$w$$$ is expected to vary in the tissue continuum along the molecule’s trajectory, and the integrals must be weighted by an effective value of $$$w$$$ experienced by the molecules going from $$$\vec{x}_0$$$ to $$$\vec{x}$$$, rather than by $$$w\left(\vec{x}_0\right)$$$ as done in state-of-the-art dMRI models.
We propose a more comprehensive model that considers, and enables the estimation of, within-voxel variation of tissue relaxation time. We evaluate our model via experiments on standard in vivo dMRI from the Human Connectome Project (HCP)4 and stimulated-echo (STE)5,6 ex vivo dMRI (with long $$$\tau$$$).
METHODS
We propose using an effective value for $$$w$$$ to account for its change during a molecule’s diffusion. For particles going from $$$\vec{x}_0$$$ to $$$\vec{x}$$$, instead of weighting the integrals in Eq. (1) by the initial value $$$w\left(\vec{x}_0\right)$$$, we use the midpoint value, $$$w\left(½\left(\vec{x}_0+\vec{x}\right)\right)=w\left(\vec{x}_0+½\vec{u}\right) \cong{w}\left(\vec{x}_0\right)+½\nabla_xw\left(\vec{x}_0\right)\cdot\vec{u}$$$, with $$$\nabla_x$$$ the spatial gradient, leading to:| $$\begin{aligned}S^v(\vec{q})&=\int_vw\left(\vec{x}_0\right)\rho\left(\vec{x}_0\right)\mathrm{d}\vec{x}_0\int{P}(\vec{u})e^{-i\vec{q}\cdot\vec{u}}\mathrm{~d}\vec{u}+½\int_v\nabla_xw\left(\vec{x}_0\right)\rho\left(\vec{x}_0\right)\mathrm{d}\vec{x}_0\cdot\int\vec{u}P(\vec{u})e^{-i\vec{q}\cdot\vec{u}}\mathrm{~d}\vec{u}\\&=\langle{w}\rangle_\rho^v\mathcal{F}\{P(\vec{u})\}+½\left\langle\nabla_xw\right\rangle_\rho^v\cdot\mathcal{F}\{\vec{u}P(\vec{u})\}\\&=S_0^v\hat{P}^v(\vec{q})+½i\left\langle\nabla_x w\right\rangle_\rho^v\cdot\nabla_q\hat{P}^v(\vec{q}),\end{aligned}$$ | (2) |
Equation (2) allows estimation of $$$\left\langle\nabla_xw\right\rangle_\rho^v$$$ from the (antipodally symmetric) signal magnitude:
| $$\begin{aligned}\left|S^v(\vec{q})\right|&=S_0^v\hat{P}^v(\vec{q})\sqrt{1+\left(\vec{L}^v\cdot½\nabla_q\log\hat{P}^v(\vec{q})\right)^2}\\&\cong{S}_0^ve^{-\tau\vec{q}^TD^v\vec{q}}\sqrt{1+\left(\tau{\vec{L}^v}^TD^v\vec{q}\right)^2},\end{aligned}$$ | (3) |
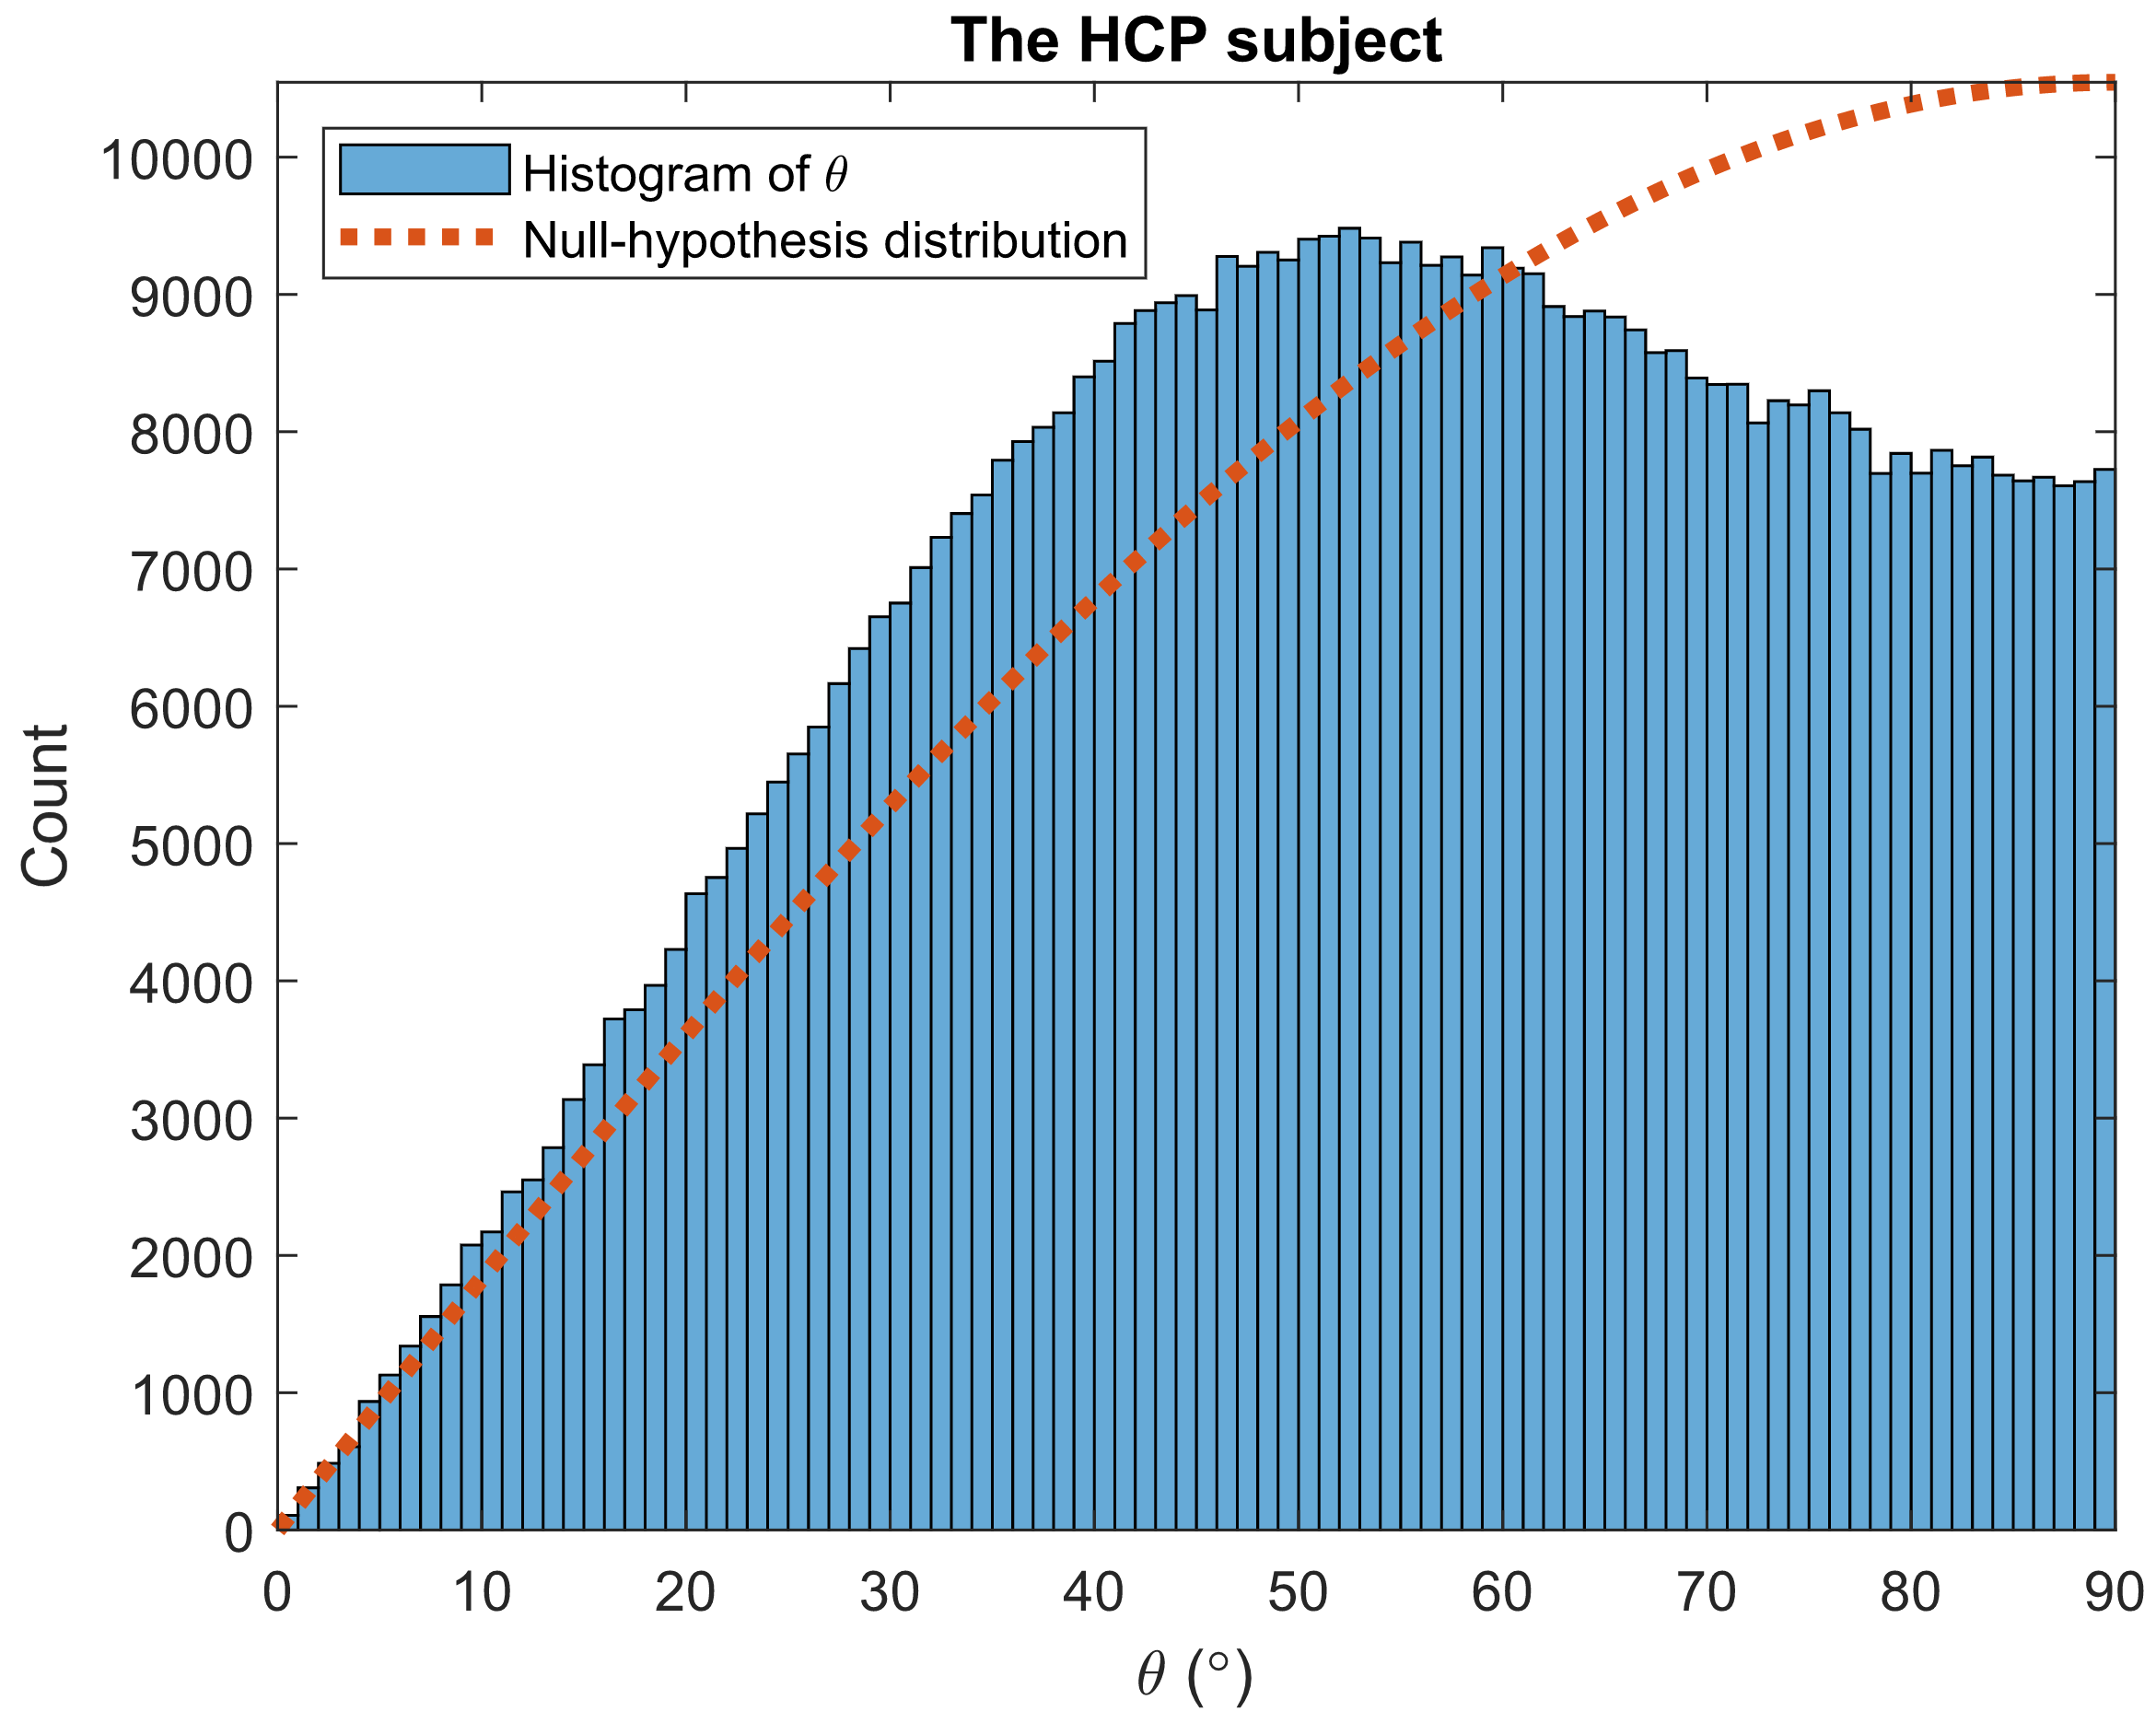
To estimate $$$D^v$$$ and $$$\vec{L}^v$$$ at each voxel, we fit the diffusion signal for all $$$\vec{q}$$$ to Eq. (3) via the pattern search algorithm8, while initializing $$$D^v$$$ with standard DTI7. We then compute (as gold standard) the discrete counterpart of $$$\vec{L}^v$$$, i.e. gradient of $$$\log{S}_0^v$$$ (approximating $$$\log{w}^v$$$) via the finite-element approach. To assess orientational accuracy, we compute the acute angle ($$$0\leq\theta\leq90^{\circ}$$$) between the orientations of the estimated $$$\vec{L}^v$$$ and its discrete counterpart, which should be small if the two are similarly oriented. The null hypothesis ($$$\vec{L}^v$$$ randomly oriented w.r.t. its discrete counterpart) predicts the $$$\sin\theta$$$ distribution, with mean of 57.3° (1 rad) and median of 60°.
RESULTS
We first applied our estimation to the white-matter mask of the 1st HCP subject (Figure 1). The estimated $$$\vec{L}^v$$$ and its discrete counterpart (Figure 2) resulted in a $$$\theta$$$ distribution (Figure 3) with mean and median of 53.3° and 54.0°, respectively, i.e. significantly small compared to chance (57.3° and 60°). A two-sided sign test revealed a p-value of 0 (to be interpreted cautiously, as neighboring-voxel correlation violates the test’s independence assumption).Since $$$\vec{L}^v$$$ affects the signal more strongly at longer diffusion times, we then used an STE5,6 research sequence to scan an ex vivo brain hemisphere with $$$\tau=1\mathrm{~s}$$$ (Figure 4). The computed $$$\theta$$$ had the mean and median of 57.1° and 59.6°, respectively, i.e. still smaller than by chance (p=0.002).
DISCUSSION AND CONCLUSION
We have derived a relationship between the diffusion profile and the spatial gradient of tissue relaxation-time weighting, which might be helpful in learning about tissue microstructure or for dMRI super-resolution. We observed the effect of our hypothesized relationship on in vivo and ex vivo dMRI, which was weaker for the STE image, possibly because of its larger voxel size, less specific white-matter mask, lower SNR inherent to ex vivo imaging and STE, and inadequacy of the Gaussian model at long $$$\tau$$$. Although we approximated $$$\log{w}^v$$$ with $$$\log{S}_0^v$$$, both expectedly have similar variation orientations, related to the same underlying tissue.A confounding factor in validating our hypothesis is a characteristic of the fibrous tissue, called fiber continuity,9-11 which implies smooth variation of a fiber bundle along its orientation, hence smaller image gradient along high-diffusion orientations. Our significant results, therefore, may be due to our model and/or fiber continuity. Further evaluation, e.g. on phantoms constructed without fiber continuity, is necessary to conclusively validate our hypothesis, which is a subject of our ongoing research.
Acknowledgements
Support for this research was provided by the National Institutes of Health (NIH), specifically the National Institute on Aging (RF1AG068261), and the Michael J. Fox Foundation for Parkinson’s Research (MRI Biomarkers Program award MJFF-021226).
Additional support was provided in part by the BRAIN Initiative Cell Census Network grant U01MH117023, the National Institute for Biomedical Imaging and Bioengineering (P41EB015896, R01EB023281, R01EB006758, R21EB018907, R01EB019956, P41EB030006), the National Institute on Aging (R01AG064027, R01AG008122, R01AG016495, R01AG070988), the National Institute of Mental Health (R01MH123195, R01MH121885, RF1MH123195), the National Institute for Neurological Disorders and Stroke (R01NS0525851, R21NS072652, R01NS070963, R01NS083534, U01NS086625, U24NS10059103, R01NS105820), and the NIH Blueprint for Neuroscience Research (U01MH093765), part of the multi-institutional Human Connectome Project.
B. Fischl has a financial interest in CorticoMetrics, a company whose medical pursuits focus on brain imaging and measurement technologies. His interests were reviewed and are managed by Massachusetts General Hospital and Mass General Brigham in accordance with their conflict-of-interest policies. T. Feiweier is an employee of Siemens Healthcare GmbH, owns stocks of Siemens (Healthineers) AG, and holds patents filed by Siemens.
References
1. Bloch, F. Nuclear Induction. Physical Review 70, 460-474 (1946).
2. Stejskal, E.O. & Tanner, J.E. Spin Diffusion Measurements: Spin Echoes in the Presence of a Time‐Dependent Field Gradient. The Journal of Chemical Physics 42, 288-292 (1965).
3. Wedeen, V.J., Hagmann, P., Tseng, W.-Y.I., Reese, T.G. & Weisskoff, R.M. Mapping complex tissue architecture with diffusion spectrum magnetic resonance imaging. Magnetic Resonance in Medicine 54, 1377-1386 (2005).
4. Van Essen, D.C., Smith, S.M., Barch, D.M., Behrens, T.E.J., Yacoub, E. & Ugurbil, K. The WU-Minn Human Connectome Project: An overview. NeuroImage 80, 62-79 (2013).
5. Tanner, J.E. Use of the Stimulated Echo in NMR Diffusion Studies. The Journal of Chemical Physics 52, 2523-2526 (1970).
6. Cotts, R.M., Hoch, M.J.R., Sun, T. & Markert, J.T. Pulsed field gradient stimulated echo methods for improved NMR diffusion measurements in heterogeneous systems. Journal of Magnetic Resonance (1969) 83, 252-266 (1989).
7. Basser, P.J., Mattiello, J. & LeBihan, D. MR diffusion tensor spectroscopy and imaging. Biophysical Journal 66, 259-267 (1994).
8. Audet, C. & J. E. Dennis, J. Analysis of Generalized Pattern Searches. SIAM Journal on Optimization 13, 889-903 (2002).
9. Reisert, M. & Kiselev, V.G. Fiber continuity: An anisotropic prior for ODF estimation. Medical Imaging, IEEE Transactions on 30, 1274-1283 (2011).
10. Duits, R. & Franken, E. Left-Invariant Diffusions on the Space of Positions and Orientations and their Application to Crossing-Preserving Smoothing of HARDI images. International Journal of Computer Vision 92, 231-264 (2011).
11. Aganj, I. Automatic verification of the gradient table in diffusion-weighted MRI based on fiber continuity. Scientific Reports 8, 16541 (2018).
12. Aganj, I., Lenglet, C., Sapiro, G., Yacoub, E., Ugurbil, K. & Harel, N. Reconstruction of the orientation distribution function in single- and multiple-shell q-ball imaging within constant solid angle. Magnetic Resonance in Medicine 64, 554-566 (2010).
13. Aganj, I. Diffusion MRI Orientation Distribution Function in Constant Solid Angle (CSA-ODF) and Hough-Transform Tractography; https://www.nitrc.org/projects/csaodf-hough. (2017).
Figures
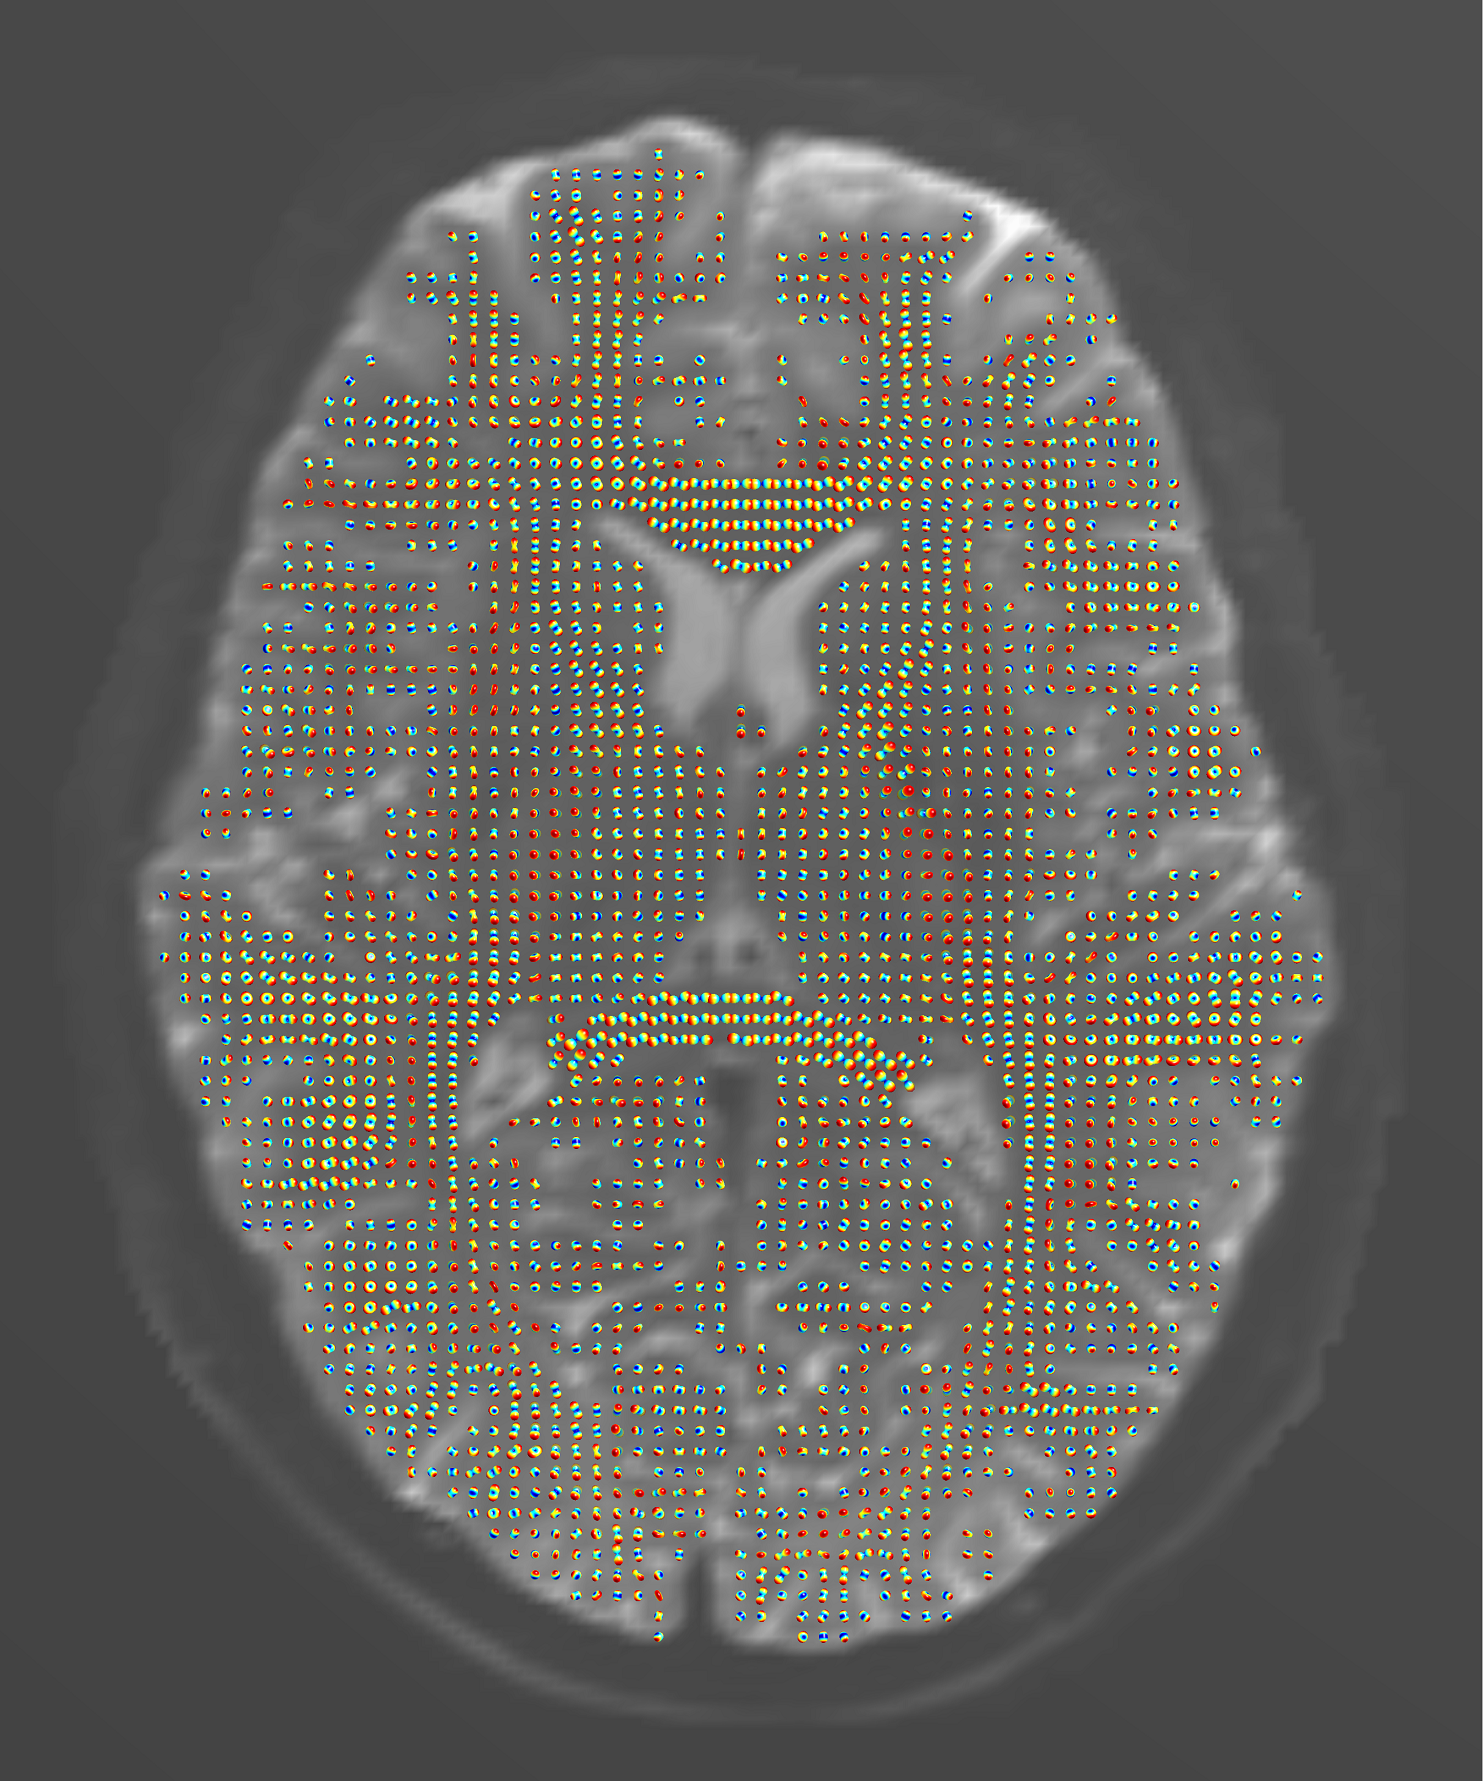
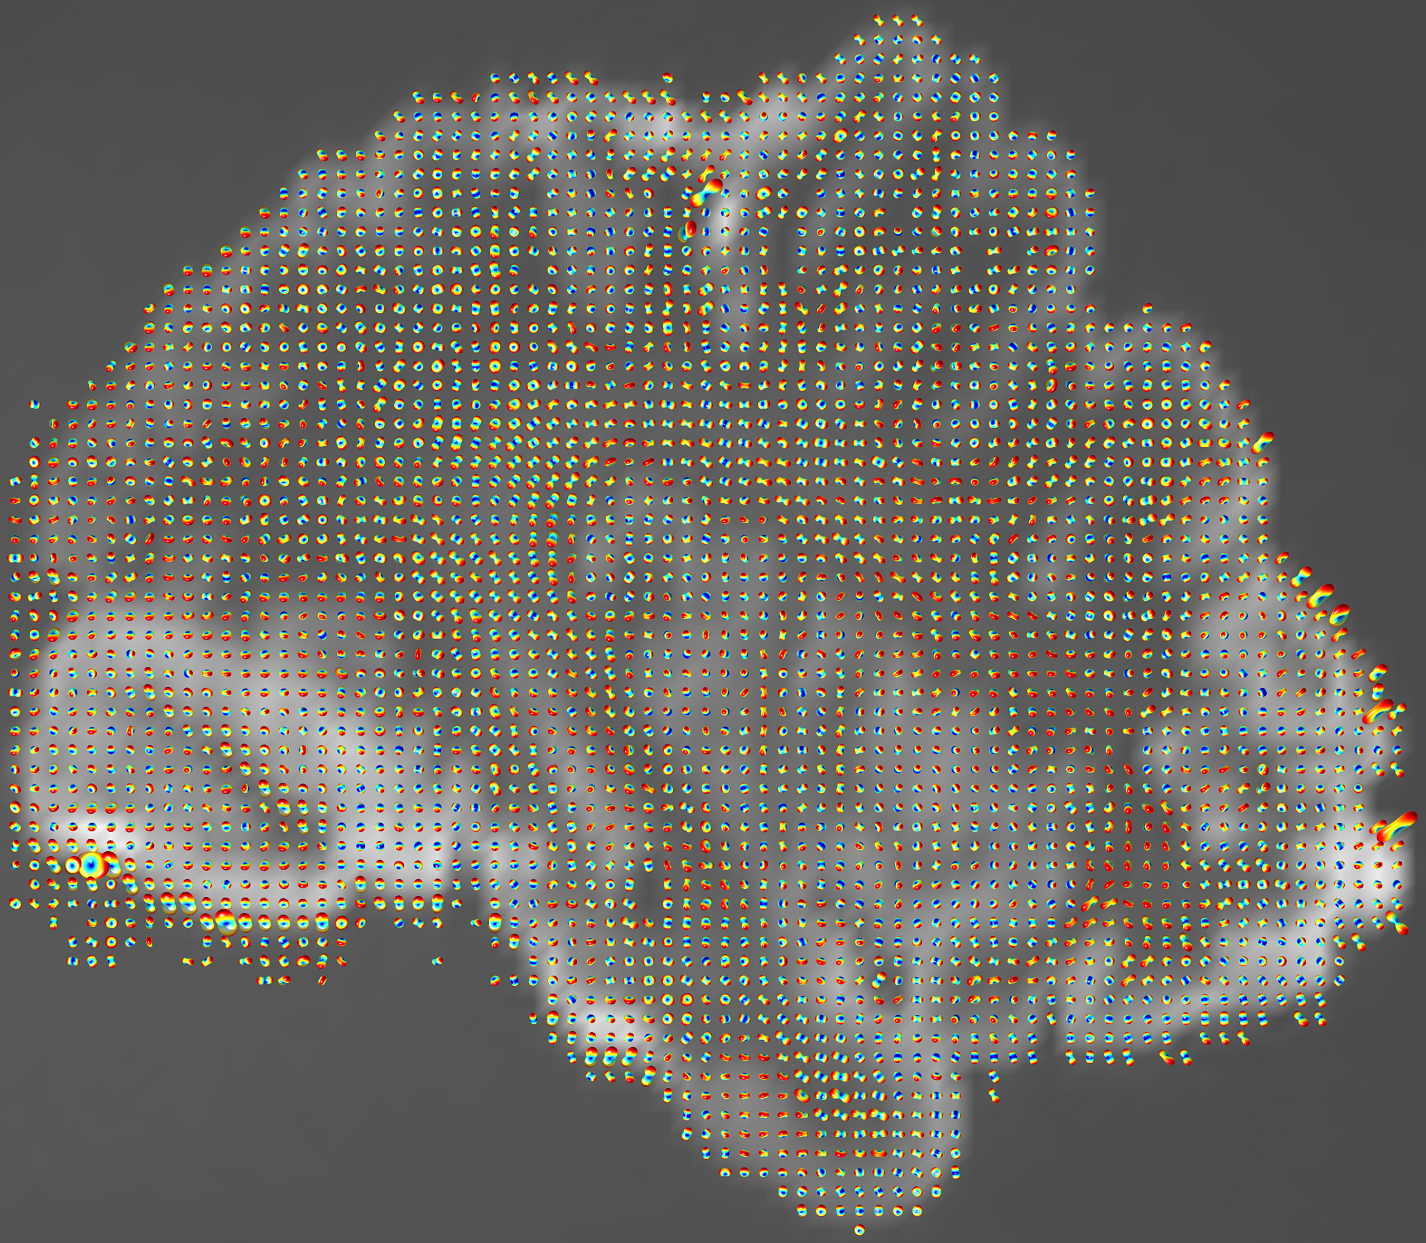
Figure 2. Color-coded orientation of the spatial gradient of the image for the HCP subject, estimated: from the diffusion signal using the proposed approach (left) and from the b=0 image via the finite-element approach (right). Consistent fiber orientations are observed mostly in single-fiber regions, which may be due to the limitations of the DTI model at regions with fiber crossing.