4588
Susceptibility-weighted imaging (SWI) of the kidney at 5T – initial results1Shanghai Institute of Medical Imaging, Shanghai, China, 2Department of Radiology, Zhongshan Hospital, Fudan University, Shanghai, China, 3Shenzhen United Imaging Research Institute of Innovative Medical Equipment, Shenzhen, China, 4MR Collaboration, Central Research Institute, United Imaging Healthcare, Shanghai, China
Synopsis
Keywords: High-Field MRI, Kidney
At high magnetic field strengths (B0 ≥ 3 T), susceptibility-weighted imaging (SWI) is an appealing approach for increased signal-to-noise ratio (SNR). To our knowledge, implementation of SWI on the kidney at higher field MRI (> 3T) has not been attempted yet. This initial study proved that it is possible to obtain SWI at 5T for renal with sufficient image quality. For 5T SWI, SNR of cortex and medulla and CNR of cortex/medulla were significantly higher than at 3T, leading to improved vessel conspicuity and corticomedullary discrimination.
Introduction
By selectively excreting or retaining various substances, the kidneys play a significant role in the regulation of blood pressure and in maintaining homeostasis [1]. T2* weighted magnetic resonance imaging (MRI) is a tool in the diagnosis process for renal diseases, which enables the evaluation of organ function [2]. The susceptibility weighted- imaging (SWI) principle is based on the weighting of T2* weighted magnitude images with a phase mask, boosting the overall image contrast of veins or nearby structures with varied susceptibility. SWI has shown to be a useful technique in visualizing venous vessels in the brain and gives diagnostic information in strokes, hemorrhages, and cerebral malignancies. The previous study suggested that SWI can better reveal hemorrhage and characterize the pattern more accurately in renal cell carcinoma than other non-contrast conventional MRI sequences [3].At high magnetic field strengths (B0 ≥ 3 T), SWI is an appealing approach for various reasons. High spatial resolution is enabled by the enhanced signal-to-noise ratio (SNR), which also minimizes signal loss due to intravoxel spin dephasing induced by background field inhomogeneities [4]. The low flip angles of approximately 10-20° that are commonly used in SWI result in specific absorption rates (SAR) that are considerably below the limitations. Because phase scales linearly with B0 clip_image002.png"> TE, adequate phase contrast may be produced at shorter echo times with rising field strengths, allowing for a reduction in repetition time and hence scan time. With partial parallel imaging methods, the high SNR allows for even more scan time reduction. Another benefit is that the phase is insensitive to B1-inhomogeneities, which increase as field strength increases [5]. According to prior research, the 7T SWI sequence, which had a spatially greater resolution than the 1.5T SWI sequence, was able to identify 20% more microhemorrhages in brain metastases [6]. To our knowledge, implementation of SWI on the kidney at higher field MRI (>3T) has not been attempted yet. The purpose of this study was to determine the feasibility of SWI at 5T.
Methods
A cohort of 10 healthy subjects was recruited for this prospective study. All protocols were approved by the local ethics committees and informed written consent was obtained from all subjects. MRI examinations were performed with a 3.0 Tesla MRI scanner (uMR 790, United Imaging Healthcare, Shanghai, China) and a 5.0 Tesla MRI scanner (uMR Jupiter, United Imaging Healthcare, Shanghai, China). The SWI were acquired by using the axial 2D breath-hold gradient-recalled echo sequence with the following parameters: For 3T, repetition time (TR)/echo time (TE), 100/6.90 ms; field-of-view (FOV), 300 mm × 380 mm; matrix size, 606 × 960; flip angle (FA), 20°; bandwidth, 400 Hz/pixel. For 5T, TR/TE, 100/6.85 ms; FOV, 300 mm × 380 mm; matrix size, 606 × 960; FA, 20°; bandwidth, 400 Hz/pixel.Qualitative and quantitative analyses were performed in consensus by two experienced radiologists. The image quality for each sequence type was evaluated by using a three-point scale (score 1 = poor quality, score 2 = moderate quality, score 3 = good quality). The evaluation criteria were based on: 1) the cortico-medullary differentiation and 2) the delineation of renal vessels. Considering the chemical shift, B1 inhomogeneity, susceptibility, motion artifacts, and the overall image impairment, the presence of artifacts was assessed by using a three-point scale (score 1 = strong impairment, score 2 = moderate impairment, score 3 = no artifact present or insignificant). For the quantitative analysis, SNR (cortex) = Signal (cortex)/noise, SNR (medulla) = Signal (medulla)/noise, and CNR = [Signal(cortex)-Signal(medulla)]/noise were measured for images of all the sequences. The noise was defined as the standard deviation of signal intensity within air outside of the body. Wilcoxon signed rank-sum test was used to compare the visual evaluation scores and quantitative measurements between 3T and 5T images. P-value < 0.05 was considered to represent statistically significant differences.
Results
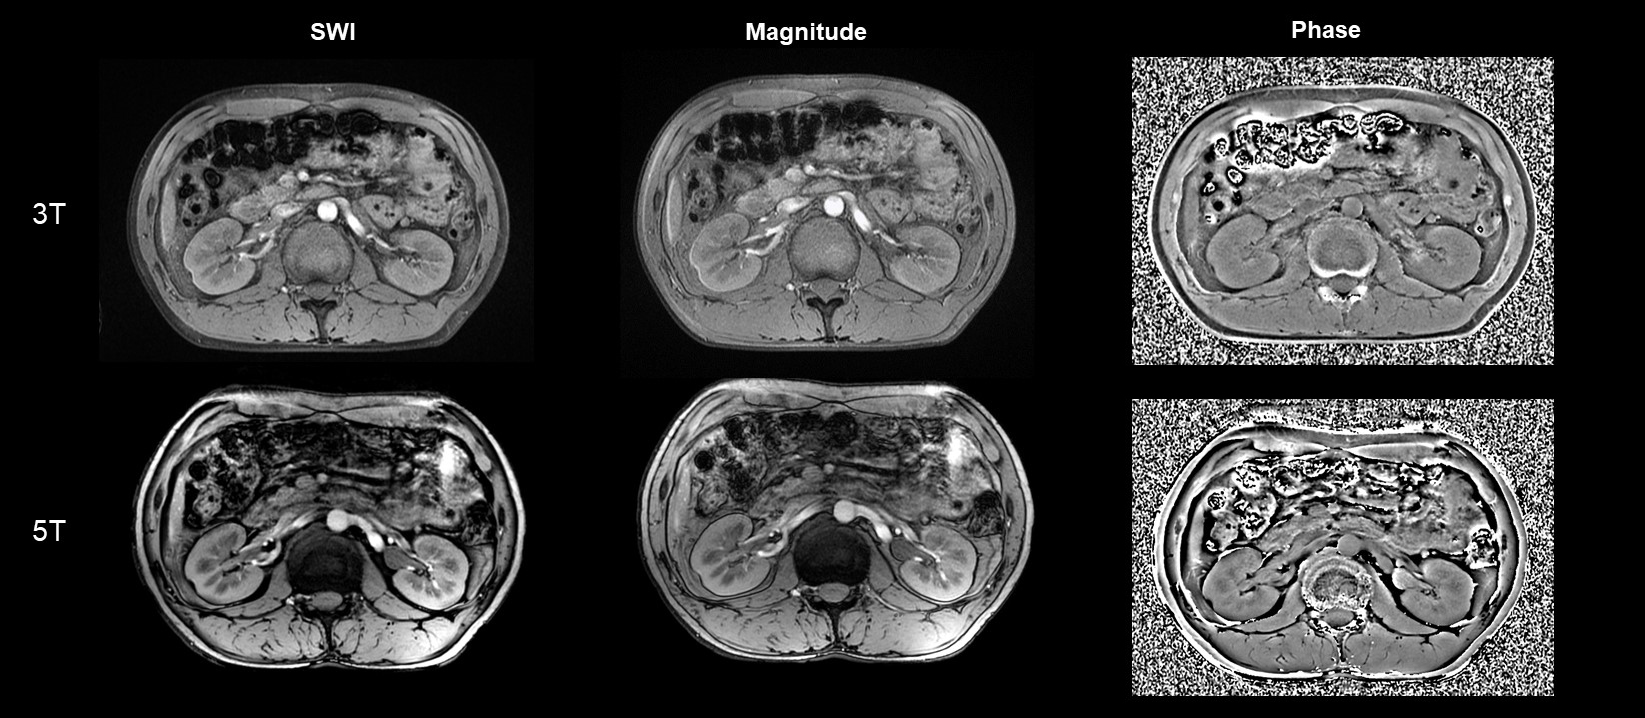
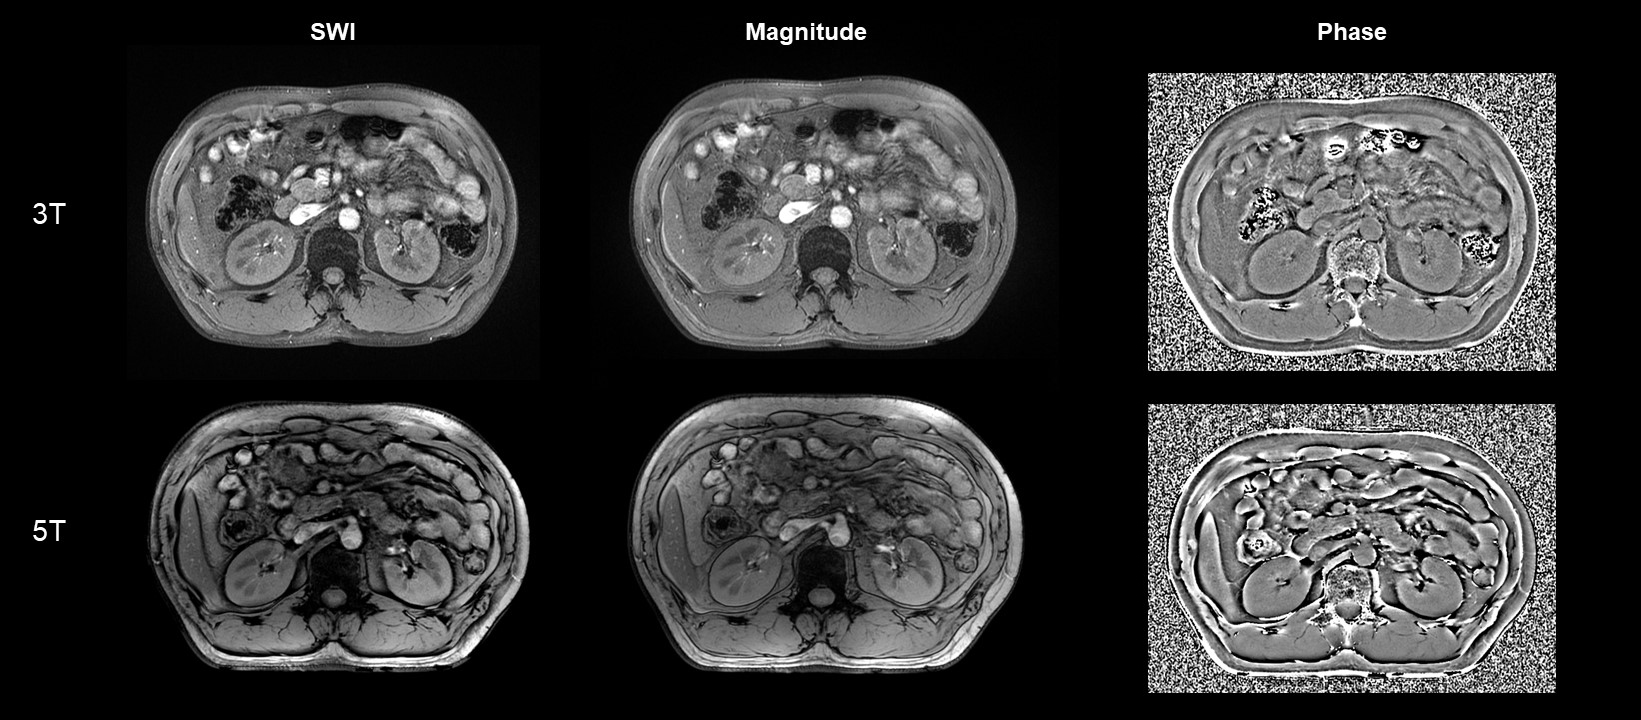
Figure 1-2 shows examples of 3T and 5T SWI for two representative subjects. The overall image quality at 5T was significantly better than at 3T (mean score 2.2 for 3T, mean score 2.7 for 5T, P = 0.034) with significantly higher conspicuity of the renal vessels (mean score 2.2 for 3T, mean score 2.6 for 5T, P = 0.046) and better cortico-medullary differentiation (mean score 2.2 for 3T, mean score 2.7 for 5T, P = 0.025). The presence of artifacts for the 5T SWI was not statistically significantly different from the 3T SWI (mean score 2.6 for 3T, mean score 2.4 for 5T, P = 0.157). Compared to 3T images, 5T images showed significantly higher SNR and CNR for all analyzed tissues (P < 0.05 for all the comparisons).Discussion/Conclusion
In summary, this initial study proved that it is possible to obtain SWI at 5T for renal with sufficient image quality. For 5T SWI, SNR of cortex and medulla and CNR of cortex/medulla were significantly higher than at 3T, leading to improved vessel conspicuity and corticomedullary discrimination. Further research with optimized protocols at 5T is needed to develop the advantages of high-field MRI.Acknowledgements
No acknowledgement found.References
1. Michaely, H. J., et al. "Vascular and parenchymal diseases of the kidney." Der Radiologe 48.2 (2008): 185-200.
2. Mendichovszky, Iosif, et al. "How accurate is dynamic contrast‐enhanced MRI in the assessment of renal glomerular filtration rate? A critical appraisal." Journal of Magnetic Resonance Imaging: An Official Journal of the International Society for Magnetic Resonance in Medicine 27.4 (2008): 925-931.
3. Xing, Wei, et al. "Evaluating hemorrhage in renal cell carcinoma using susceptibility weighted imaging." PLoS One 8.2 (2013): e57691.
4. Reichenbach, Jürgen R., et al. "Theory and application of static field inhomogeneity effects in gradient‐echo imaging." Journal of Magnetic Resonance Imaging 7.2 (1997): 266-279.
5. Abduljalil, Amir M., et al. "Enhanced gray and white matter contrast of phase susceptibility‐weighted images in ultra‐high‐field magnetic resonance imaging." Journal of Magnetic Resonance Imaging: An Official Journal of the International Society for Magnetic Resonance in Medicine 18.3 (2003): 284-290.
6. Mönninghoff, C., et al. "Imaging of brain metastases of bronchial carcinomas with 7 T MRI–initial results." RöFo-Fortschritte auf dem Gebiet der Röntgenstrahlen und der bildgebenden Verfahren. Vol. 182. No. 09. © Georg Thieme Verlag KG Stuttgart· New York, 2010.
Figures