4541
Linearity and Bias of Bone Marrow Relative Fat-fraction Compared to Proton Density Fat-Fraction1Radiology, University of Wisconsin-Madison, Madison, WI, United States, 2Radiology and Medical Physics, University of Wisconsin-Madison, Madison, WI, United States, 3Radiology, Medical Physics, Biomedical Engineering, Medicine, Emergency Medicine, University of Wisconsin-Madison, Madison, WI, United States
Synopsis
Keywords: Bone, Fat, Fat fraction
Bone marrow relative fat-fraction (rFF) measured using dual-echo gradient echo (GRE) in- and opposed phase imaging, has been proposed as an early predictor of treatment response in multiple myeloma. In this work we demonstrate that in patients without known bone marrow pathology (referred for liver fat/iron quantification), bone marrow rFF is unreliable and suffers from large bias when compared with proton density fat-fraction (PDFF), acquired using quantitative chemical-shift encoded (CSE) MRI. Hence, PDFF should be considered for future approaches using bone marrow fat-fraction as a predictor of treatment response in multiple myeloma.
Introduction
MRI is the most sensitive imaging modality for the detection of multiple myeloma lesions and has been shown to impact treatment decisions.1-6 However, there is no widely-used MRI biomarker to assess treatment response. Diffusion-weighted imaging and the apparent diffusion coefficient (ADC) are unreliable due to long scan times and sensitivity to motion/magnetic field inhomogeneities.7-15 Recently, bone marrow fat-fraction has been studied as an early predictor of treatment response in multiple myeloma.16 However, this work utilized relative fat-fraction (rFF) measured through dual-echo gradient echo (GRE) in- and opposed-phase (IP and OP) imaging:rFF = (SIP – SOP)/(2xSIP)x100%,
where SIP and SOP are the respective signal intensities on IP and OP images. rFF has several limitations, including water-fat ambiguity (i.e., when FF>50%) and bias from multiple confounders (e.g., T1 bias, T2* decay, and the spectral complexity of fat).17 Currently, the most objective MRI metric of tissue fat content is proton density fat-fraction (PDFF), most commonly acquired using quantitative chemical-shift encoded (CSE) MRI.18 Hence, the purpose of this work was to determine the linearity and bias of bone marrow rFF compared to the reference PDFF in patients without known bone marrow pathology.
Methods
This IRB approved, retrospective study included 40 MRI exams from 40 patients referred for liver fat/iron quantification between August 2019 and June 2022. 20 exams were performed on a 1.5T scanner and 20 on a 3.0T scanner (respectively Signa Artist and Signa Architect, GE Healthcare). Per standard clinical MRI protocol, dual-echo GRE IOP and a commercial CSE-MRI (IDEAL IQ, GE Healthcare) sequences were acquired; Table 1 summarizes the acquisition parameters.IOP images and PDFF and R2* maps were exported and analyzed by an abdominal imaging fellow physician, supervised by a fellowship-trained abdominal radiologist, on an image processing software (Horos, v.4.0.0 RC3). For each patient, circular regions of interest (ROIs) were placed on the R2* map. Three 4.0 cm2 ROIs were placed in the liver (2 right lobe ROIs, 1 left lobe ROI), avoiding edges, focal lesions, large vessels, and artifacts. One 2.5 cm2 ROI was placed in each of the T12, L1, and L2 vertebral bodies, avoiding central vascular plexus and endplates; if arthrosis or lesion prohibited ROI placement in a vertebra, T11 or L3 were chosen instead. Co-localized ROIs were propagated to the corresponding IP/OP images and PDFF maps. ROI mean values were recorded; per-ROI rFF was calculated from IP/OP ROI mean values per above equation.
Per-ROI rFF was compared to PDFF using linear regression. Bland-Altman analysis evaluated rFF mean bias and 95% limits of agreement (LOA) across the observed R2* and PDFF range. Simulations were also performed to predict rFF performance, using the IOP acquisition parameters in Table 1, rFF calculation described above, a multi-peak fat spectrum,19 and relaxation parameters T1water, T1fat, and R2*,20 similar to those previously reported for each organ.
Results
From 40 patients, 120 liver ROI data points and 120 bone marrow ROI data points were collected.Liver rFF demonstrated good linearity against PDFF (Fig 1a), with a strong linear fit (R²=0.82), slope of near-unity (0.97), and a small intercept (-2.18). Liver rFF demonstrated moderate bias with respect to the reference PDFF; mean bias was -2.48% (LOA -12.80, 7.84), without a recognizable trend in bias across the observed range of PDFF (Fig 1b). A similar extent and pattern of bias is observed for liver rFF across the observed liver R2* at both field strengths (Figs 1c, 1d).
Conversely, bone marrow rFF demonstrated no discernible linearity against PDFF (Fig 2a) with a poor linear fit (R²=0.12). Most notably, bone marrow rFF demonstrated large bias with respect to PDFF and a clear trend of increasing bias with increasing PDFF (Fig 2b); mean bias was -18.48% (LOA -51.86, 15.05). There was no clear trend for change of bias as a function of R2* at either field strength (Figs 2c, 2d). These findings were concordant with simulations, which also predicted a large bias of rFF in bone marrow, particularly for PDFF>40% (Fig 3).
Discussion/Conclusion
Bone marrow rFF demonstrates no discernible linearity compared to PDFF and suffers from large bias across the observed range of bone marrow PDFF values. This observation is likely multifactorial. First, rFF does not account for water-fat ambiguity. This may not be clinically relevant in the liver where PDFF rarely exceeds 50%. However, in the bone marrow, PDFF commonly exceeds 50%, limiting the utility of IOP-based rFF. Furthermore, rFF does not account for T1 bias, T2* decay, or the spectral complexity of fat, introducing further bias that is supported by the presented data and simulations. For these reasons, bone marrow rFF measured using a dual-echo GRE IOP technique is highly unreliable and should not be used as an imaging biomarker of bone marrow fat content.Limitations of this study include its retrospective design, relatively small sample size, and absence of correlation with histology. Furthermore, although no documented history of bone-marrow related pathology was found in this population, this was not histologically confirmed.
In conclusion, dual-echo GRE IOP imaging is not a reliable technique to measure bone marrow fat-fraction, and PDFF measured using CSE-MRI should be used for future approaches that require bone marrow fat fraction measurement.
Acknowledgements
The authors wish to acknowledge support from GE Healthcare and Bracco Diagnostics who provides research support to the department of Radiology of the University of Wisconsin-Madison.
Research reported in this publication was also supported by the National Institute of Biomedical Imaging and Bioengineering of the National Institutes of Health under award number R01EB031886.
References
1. Cascini GL, Falcone C, Console D, et al. Whole-body MRI and PET/CT in multiple myeloma patients during staging and after treatment: personal experience in a longitudinal study. Radiol Med. 2013;118(6):930-948.
2. Shortt CP, Gleeson TG, Breen KA, et al. Whole-Body MRI Versus PET in Assessment of Multiple Myeloma Disease Activity. American Journal of Roentgenology. 2009;192(4):980-986.
3. Pawlyn C, Fowkes L, Otero S, et al. Whole-body diffusion-weighted MRI: a new gold standard for assessing disease burden in patients with multiple myeloma? Leukemia. 2016;30(6):1446-1448.
4. Zamagni E, Nanni C, Patriarca F, et al. A prospective comparison of 18F-fluorodeoxyglucose positron emission tomography-computed tomography, magnetic resonance imaging and whole-body planar radiographs in the assessment of bone disease in newly diagnosed multiple myeloma. Haematologica. 2007;92(1):50-55.
5. Dimopoulos MA, Hillengass J, Usmani S, et al. Role of magnetic resonance imaging in the management of patients with multiple myeloma: a consensus statement. J Clin Oncol. 2015;33(6):657-664.
6. Cavo M, Terpos E, Nanni C, et al. Role of (18)F-FDG PET/CT in the diagnosis and management of multiple myeloma and other plasma cell disorders: a consensus statement by the International Myeloma Working Group. Lancet Oncol. 2017;18(4):e206-e217.
7. Murphy P, Wolfson T, Gamst A, Sirlin C, Bydder M. Error model for reduction of cardiac and respiratory motion effects in quantitative liver DW-MRI. Magn Reson Med. 2013;70(5):1460-1469.
8. Benner T, van der Kouwe AJ, Sorensen AG. Diffusion imaging with prospective motion correction and reacquisition. Magn Reson Med. 2011;66(1):154-167.
9. Gumus K, Keating B, Poser BA, et al. Prevention of motion-induced signal loss in diffusion-weighted echo-planar imaging by dynamic restoration of gradient moments. Magn Reson Med. 2014;71(6):2006-2013.
10. Lewis S, Dyvorne H, Cui Y, Taouli B. Diffusion-weighted imaging of the liver: techniques and applications. Magn Reson Imaging Clin N Am. 2014;22(3):373-395.
11. Miquel ME, Scott AD, Macdougall ND, Boubertakh R, Bharwani N, Rockall AG. In vitro and in vivo repeatability of abdominal diffusion-weighted MRI. Br J Radiol. 2012;85(1019):1507-1512.
12. Chen X, Qin L, Pan D, et al. Liver diffusion-weighted MR imaging: reproducibility comparison of ADC measurements obtained with multiple breath-hold, free-breathing, respiratory-triggered, and navigator-triggered techniques. Radiology. 2014;271(1):113-125.
13. Michoux NF, Ceranka JW, Vandemeulebroucke J, et al. Repeatability and reproducibility of ADC measurements: a prospective multicenter whole-body-MRI study. Eur Radiol. 2021.
14. Liau J, Lee J, Schroeder ME, Sirlin CB, Bydder M. Cardiac motion in diffusion-weighted MRI of the liver: artifact and a method of correction. J Magn Reson Imaging. 2012;35(2):318-327.
15. Nasu K, Kuroki Y, Sekiguchi R, Nawano S. The effect of simultaneous use of respiratory triggering in diffusion-weighted imaging of the liver. Magn Reson Med Sci. 2006;5(3):129-136.
16. Koutoulidis V, Terpos E, Papanikolaou N, et al. Comparison of MRI Features of Fat Fraction and ADC for Early Treatment Response Assessment in Participants with Multiple Myeloma. Radiology. 2022;304(1):137-144.
17. Reeder SB, Hu HH, Sirlin CB. Proton density fat-fraction: a standardized MR-based biomarker of tissue fat concentration. J Magn Reson Imaging. 2012;36(5):1011-1014.
18. Yokoo T, Serai SD, Pirasteh A, et al. Linearity, bias, and precision of hepatic proton density fat fraction measurements by using MR imaging: a meta-analysis. Radiology. 2018;286(2):486-498.
19. Hamilton G, Yokoo T, Bydder M, et al. In vivo characterization of the liver fat ¹H MR spectrum. NMR Biomed. 2011;24(7):784-790.
20. de Bazelaire CM, Duhamel GD, Rofsky NM, Alsop DC. MR imaging relaxation times of abdominal and pelvic tissues measured in vivo at 3.0 T: preliminary results. Radiology. 2004;230(3):652-659.
Figures
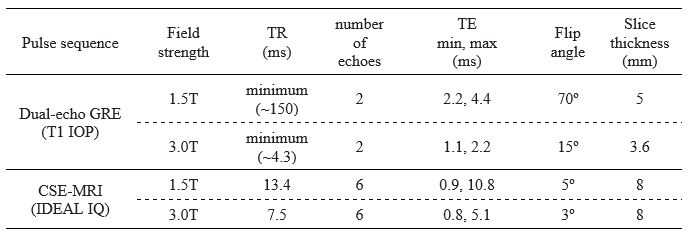
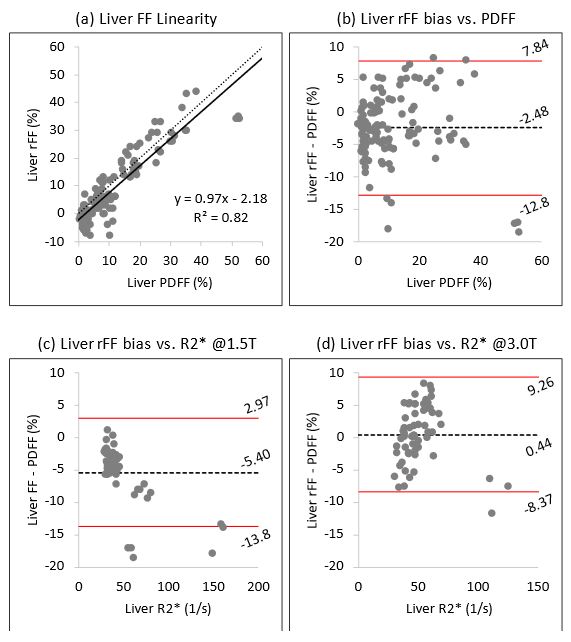
Figure 1: (a) In the liver, rFF demonstrated good linearity against PDFF with a strong linear fit, a near-unity slope, and a small intercept. (b) Liver rFF demonstrates moderate bias with respect to the reference PDFF with a wide range for limits of agreement (-12.8, 7.84); no clear trend in bias is recognized across the observed PDFF range. (c & d) No clear trend in bias is observed for liver rFF across the range of R2* values at either field strength.
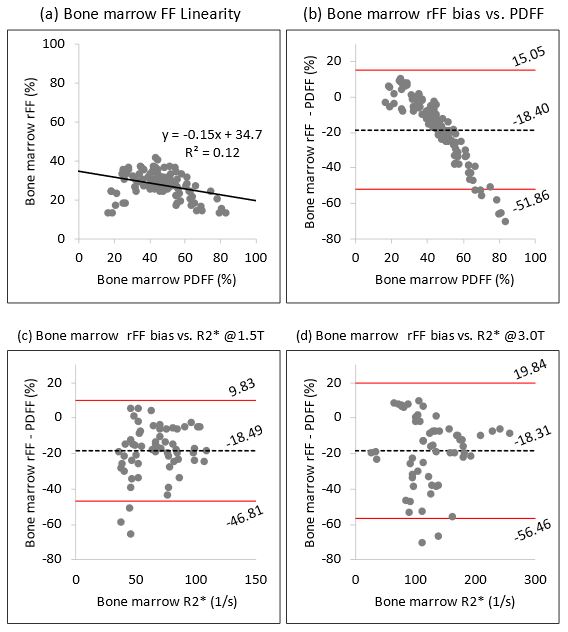
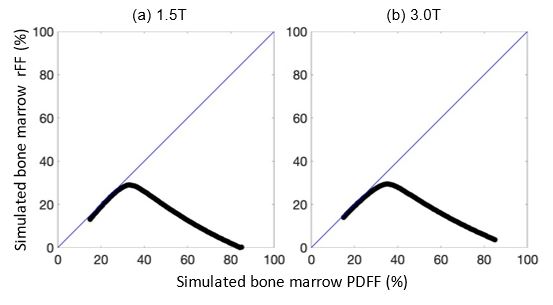
Figure 3. Predicted rFF generated using computer simulations using typical IOP acquisition parameters (Table 1), a multi-peak fat spectrum,19 and relaxation parameters T1water, T1fat, and R2* at 1.5T and 3.0T (a & b, respectively), predict a large bias of rFF in bone marrow, particularly for PDFF>40%, concordant with the observed findings in Fig 2a.