4539
Investigation of the fat-bone-muscle connection in osteoporosis and osteoarthritis by 1H MRS1Physics, CNR Institute for Complex Systems (ISC), Rome, Italy, 2Physics, Sapienza University of Rome, Rome, Italy, 3Diagnostic and Interventional Radiology, Molecular Imaging and Radiotherapy, Policlinico Tor Vergata Foundation, Tor Vergata University of Rome, Rome, Italy, 4Orthopedics and Traumatology, Policlinico Tor Vergata Foundation, Tor Vergata University of Rome, Rome, Italy
Synopsis
Keywords: Bone, Spectroscopy, Osteoporosis, Fatty acids, Osteoarthritis, Muscle
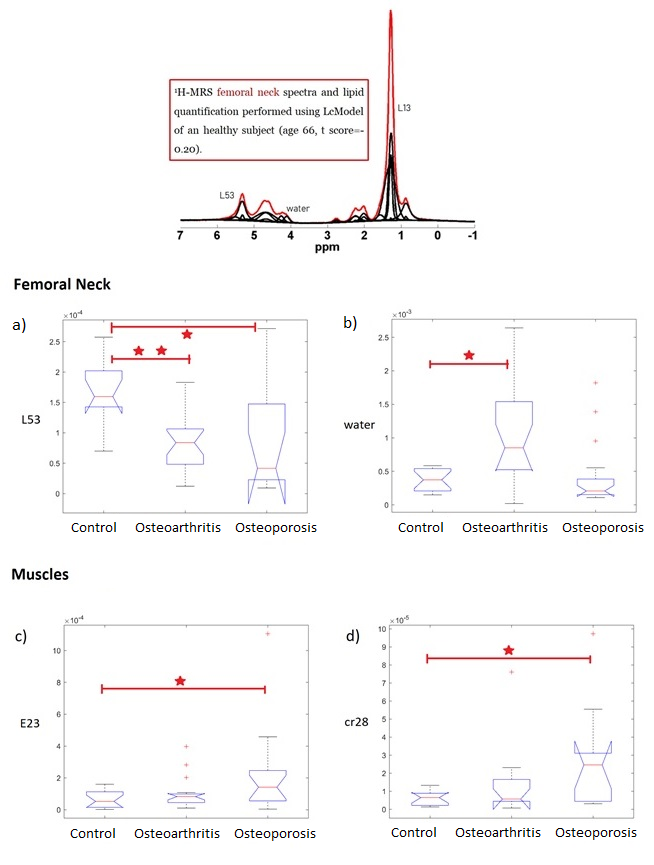
The metabolic pathways involved in the development of osteoporosis and osteoarthritis, was investigated by SVS1H MRS. Metabolites and fatty acids of the bone marrow and the adjacent muscle of healthy, osteoporotic and osteoarthritic woman were quantified using LCModel. The increase of E23 resonance in muscles is a potential marker of sarcopenia correlated to osteoporosis. The decrease of the L53 resonance in bone marrow highlights the presence of osteoporosis (together with total lipids increase) or osteoarthritis (together with bone marrow water increase).Introduction
Osteoporosis and osteoarthrosis are pathologies involving the entire musculoskeletal system. In fact, for example, sarcopenia which is a muscle disease (muscle failure) rooted in adverse muscle changes, is often diagnosed together with osteoporosis [1] and an increase in bone marrow fat occurs in non-peripheral skeletal sites with the development of osteoporosis [2]. Moreover, in in-vitro studies, we highlighted differences among fat quantity in muscles of osteoporotic subjects and patients with osteoarthrosis [3] and their cancellous bone density [4]. In general, before structural changes, such as the loss of bone mineral density (BMD), metabolic changes occur [5] [6]. Recently, we have quantified bone-marrow fatty-acids in the peripheral skeleton, which is almost saturated in fat, highlighting changes in the relative amount of fatty acids with the development of osteoporosis [7] [8] [9] [10]. In this work, to investigate the metabolic pathways involved in the development of osteoporosis and osteoarthritis, we quantified by localized 1H NMR Spectroscopy the metabolites and fatty acids of both the bone marrow (in femoral neck and head) and the adjacent muscle (vasto lateralis) of healthy, osteoporotic and osteoarthritis woman.Methods
A cohort of 19 osteoporotic patients (mean-age 76.0+/-3.1y), 21 osteoarthritic (66.1+/-2.9y) and 16 healthy subjects (68.2+/-3.8y) were enrolled in this study. Spectra were acquired at 3T in femoral neck and head and in Vastus Lateralis using SVS-STEAM (10x10x18 mm3 along muscle and 10x10x14mm3 in bone marrow) with TE/TM=10/40ms, TR=5s, ns=16. Data were elaborated using LCmodel to obtain the quantification of bone-marrow fatty-acids (resonances: L52, L53, L41, L43, L28, L23, L21, L16, L13, L09) and muscle metabolites (resonances: Creatine, Cr30 and Cr28, choline, tau, IMCL, EMCL, E23). A linear regression was performed between the patients’ ages and the fatty-acids levels. The mean and SD of all resonance were obtained, and the fat content (FC) and the Total Lipid content (TL) were also quantified. Any statistical difference between groups was evaluated by performing a Welch's t-test and a Kruskal-Wallis test with Dunn-Sidák post-hoc correction.Results
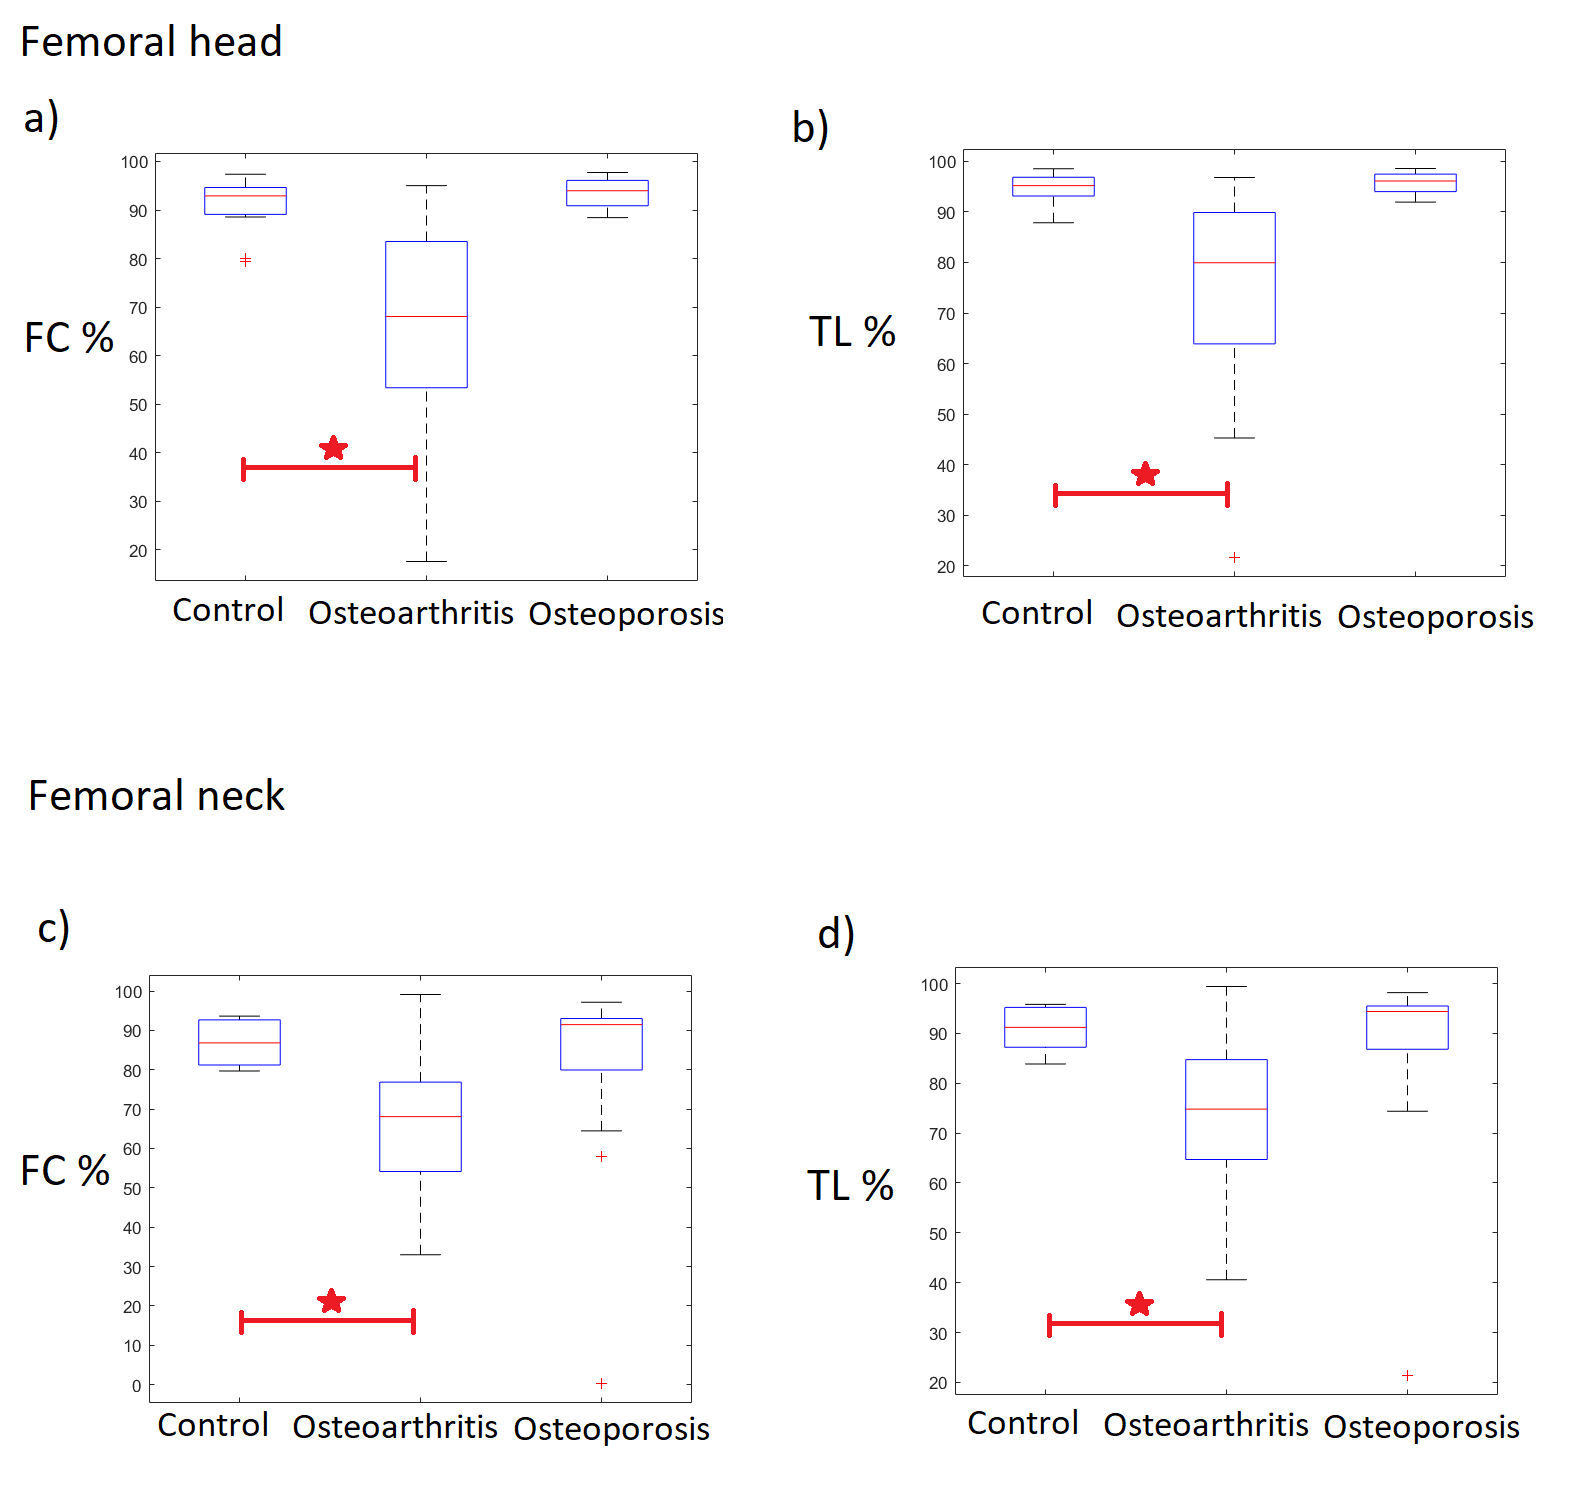
The linear regression between the patients’ ages and the fatty-acids levels resulting in no age dependencies. The quantification of water inside bones’ tissues (water in bone marrow) was found to be significantly higher in patients with osteoarthritis compared to that in healthy subjects, whereas water quantity is similar in healthy and osteoporotic groups. The quantification of the L53 in osteoporotic subjects and patients affected by osteoarthritis was found to be significantly lower compared to that of the control group both in the femoral neck and head (Figure 1) and the lowest value was found in the osteoporotic group. Lower values of both FC and TL were found in the femoral neck and head of the osteoarthritis group compared to the values in healthy and osteoporotic subjects (Figure 2). Finally, the resonances E23 and cr28 in muscles were found higher in the osteoporotic compared to the control group, whereas there were found no differences between the osteoarthrosis group and the control group (Figure 1).Discussion
Data suggests that the bone marrow changes differently in osteoarthrosis and osteoporosis. In the former case TL decreases and the water quantity increases. Conversely, the osteoporotic group is characterized by an increase in fatty acids level and a decrease of water content. Considering a trabecular bone, spongy bone pores contain water and fat molecules, where water wets the pore wall and fat is principally located in the central zone of each pore [11]. In this view, the osteoarthritis disease may change the shape of the pores increasing the surface/volume fraction. This is in accordance with previous observations conducted with micro-MRI on bones affected by osteoporosis and osteoarthritis [6]. As already reported in literature [4], high levels of unsaturated fatty acids (marked by L53 resonance) in bone marrow are a marker for bones’ healthiness. Our results suggest that osteoporotic subjects have the lowest levels of L53, whereas osteoarthritic subjects have intermediate levels between healthy and osteoporotic group. Furthermore, the osteoporotic muscles are characterized by some difference compared to the healthy control. The increase in creatine levels is often related to an increase in muscle mass and water levels inside muscles themselves. On the other hand, the increase of E23 can highlight a depletion of the muscle fibers that release collagen fibers and macromolecules in solution, increasing the E23 resonance.Conclusion
The increase of E23 resonance in muscles is a potential marker of sarcopenia correlated to osteoporosis. Moreover, the decrease of the unsaturated fat resonance L53 in bone marrow is a marker that highlights the presence of osteoporosis (together with total lipids increase) or osteoarthritis (together with bone marrow water increase).Acknowledgements
No acknowledgement found.References
[1] U. Tarantino, J. Baldi, M. Celi, C. Rao, F. M. Liuni, R. Iundusi and E. Gasbarra, "Osteoporosis and sarcopenia: the connections," Aging clinical and experimental research, vol. 25, pp. 93-95, 2013.
[2] M. L. B. Clifford J. Rosen, "Mechanisms of disease: is osteoporosis the obesity of bone?," Nat. Clin. Pract. Rheumatol., vol. 2, pp. 35-43, 006.
[3] M. Rebuzzi, V. Vinicola, F. Taggi, U. Sabatini, F. W. Wehrli and S. Capuani, "Potential diagnostic role of the MRI-derived internal magnetic field gradient in calcaneus cancellous bone for evaluating postmenopausal osteoporosis at 3 T," Bone, vol. 57, p. 155–163, 2013.
[4] D. Mattioli, V. Vinicola, M. Aragona, M. Montuori, U. Tarantino and S. Capuani, "Behavior during aging of bone-marrow fatty-acids profile in women's calcaneus to search for early potential osteoporotic biomarkers: a 1H-MR Spectroscopy study," Bone, vol. 164.
[5] G. D. Pietro, M. Scimeca, R. Iundusi, M. Celi, E. Gasbarra, U. Tarantino and S. Capuani, "Differences between muscle from osteoporotic and osteoarthritic subjects: in vitro study by diffusion-tensor MRI and histological findings," Aging Clinical and Experimental Research, vol. 32, p. 2489–2499, 2020.
[6] S. Capuani, E. Piccirilli, G. D. Pietro, M. Celi and U. Tarantino, "Microstructural differences between osteoporotic and osteoarthritic femoral cancellous bone: an in vitro magnetic resonance micro-imaging investigation," Aging Clinical and Experimental Research, vol. 25, no. 1, pp. 51-54, 2013.
[7] A. M. Pino and J. P. Rodríguez, "Is the fatty acid composition of human bone marrow significant to bone health?," Bone, vol. 118, pp. 53-61, 2019.
[8] J. F. Griffith and e. al., "A study of bone marrow and subcutaneous fatty acid composition in subjects of varying bone mineral density," Bone, vol. 44, no. 6, pp. 1092-1096, 2009.
[9] G. Di Pietro, S. Capuani, G. Manenti, V. Vinicola, A. Fusco, J. Baldi, M. Scimeca, G. Hagberg, M. Bozzali and G. Simonetti, "Bone marrow lipid profiles from peripheral skeleton as potential biomarkers for osteoporosis: a 1H-MR spectroscopy study," Academic radiology, vol. 23, no. 3, pp. 273-283, 2016.
[10] S. Capuani, "Water diffusion in cancellous bone," Microporous and Mesoporous Materials , vol. 178, pp. 34-38, 2013.
[11] S. D. Santis, M. Rebuzzi, G. D. Pietro, F. Fasano, B. Maraviglia and S. Capuani, "In vitro and in vivo MR evaluation of internal gradient to assess trabecular bone density," Physics in Medicine & Biology, vol. 55, no. 19, pp. 57-67, 2010.
Figures