4531
Toward an Imaging Biomarker for Proximal Femur Fracture Risk Using 3T Chemical Shift-Encoded MRI Radiomic Of Bone Marrow1Radiology, NYU Langone, New York, NY, United States, 2Université de Lyon; CREATIS CNRS UMR 5220, Inserm U1206, INSA-Lyon, Villeurbanne, France, 3Osteoporosis Center, Hospital for Joint Diseases, NYU Langone, New York, NY, United States
Synopsis
Keywords: Bone, Radiomics
Recent studies using Chemical Shift Encoded-MRI have used textural analysis to assess vertebral marrow heterogeneities in postmenopausal women and in paraspinal muscle to predict its strength. Radiomics provide another means to quantify bone marrow on MR images, specifically by analyzing texture, shape, and intensity distribution in the region of interest. Our aim was to investigate whether radiomic features in fatty acid composition maps of the proximal femur bone marrow improve the prediction of osteoporotic fracture.Introduction
Osteoporosis is a significant disease and affects 200 million people worldwide. Bone mineral density (BMD) calculated using dual-energy x-ray absorptiometry (DXA) is the standard-of-care method used to assess bone health and fracture risk (Fx), with the proximal femur being the most common fracture site. However, BMD has low sensitivity and cannot detect all patients with increased Fx risk for osteoporosis. Clinical data-based predictors like FRAX can be used in unison with BMD to improve Fx prediction. In addition, chemical Shift Encoded (CSE) MRI has been used to assess adipose tissue amount and fatty acids composition (FAC) and found that bone quality is also dependent on bone marrow adiposity(1,2). Recent studies using CSE-MRI have used textural analysis in vertebral bone marrow (3) to assess marrow heterogeneities in postmenopausal women and in paraspinal muscle to predict its strength. Radiomics (4) provide another means to quantify bone marrow on MR images, specifically by analyzing texture, shape, and intensity distribution in the region of interest (4,5). Radiomics has been used extensively in cancer research (6-12) and for pancreatitis detection (12). Our aim was to investigate whether radiomics features in FAC maps of the proximal femur improve the Prediction of osteoporotic fracture.Material/Method
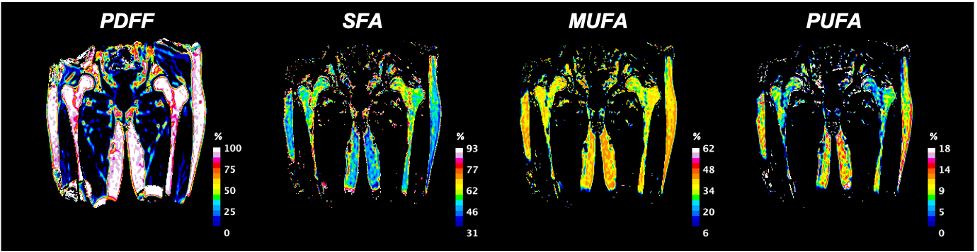
This study had institutional review board approval, and written informed consent was obtained from all subjects. The subject characteristics are provided in table 1. Acquisition: MRI acquisitions were performed on a clinical 3T MRI system (Skyra System, Siemens Healthineers, Erlangen, Germany) using an 18-channel flexible coil overlying the pelvis. A 3D spoiled-multiple echo gradient echo sequence with a flyback readout gradient was used. The repetition time (TR) and flip angle (FA) were chosen to avoid T1 weighting: TR: 16 msec; FA 5°; 12 echo times (TEs) giving an echo train length of n = (1:12) × 1.2 msec; receiver bandwidth = 2000 Hz.pixel-1; signal averages = 4; the field of view (FOV) was chosen to cover both hips from the level of the femoral head to the femoral shaft with an in-plane resolution of 1.5 × 1.5 mm2; matrix = 160 × 160 interpolated to 192 × 192; 52 coronal slices; slice thickness = 2.4 mm, scan time: 5:15 minutes. The magnitude and phase images were systematically saved. Processing: Using the method described in (13), fat content (i.e., Proton Density Fat Fraction (PDFF)) and fatty acid composition (i.e., saturated (SFA), monounsaturated (MUFA) and polyunsaturated (PUFA)) were computed as parametric maps (Fig.1). Femoral subregions were manually segmented for each subject in the femoral head (FHEAD), femoral neck (FNECK), trochanter (TROCH), and femoral shaft (SHAFT) using the MATLAB Image Processing Toolbox. For each subregion and parametric map, 322 radiomic features (1st order+2D+3D) were computed using the Standardized Environment for Radiomics Analysis (14). A support vector machine (SVM) model was built by using the most Fx status-related features, which were selected using univariate feature ranking for classification using chi-square tests. The discriminative capability was measured using the receiver operating characteristic (ROC) curve, the area under the curve (AUC), and prediction accuracy.Results
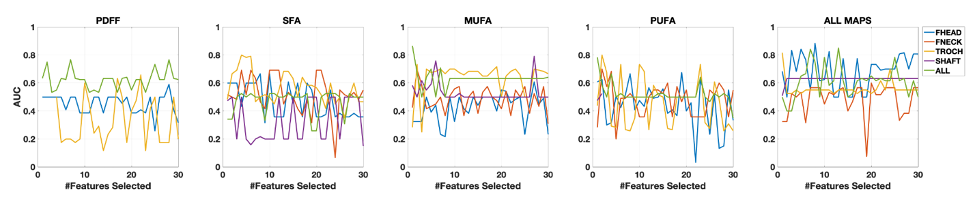
Typical parametric maps are shown in Figure 1. The AUC of DXA T-score-based Fx prediction was 0.72 and used as a threshold to choose feature-based models (Table 2). Model performance based on the number of features selected is shown in Figure 2. With more radiomics features incorporated into models, the AUC values decreased. For example, two features for PUFA in TROCH (AUC=0.80) allowed better Fx discrimination than six features (about local intensity, statistics, co-occurrence matrix, and run length matrix) of MUFA in all subregions (AUC=0.76). Overall, the best model combined all maps in the TROCH and used the co-occurrence matrix’s information correlation feature (AUC= 0.82)Conclusion
MRI-based radiomic features computed from parametric fat maps appear to predict Fx with a better AUC than DXA T-score alone. These results provide further evidence for the role of marrow fat composition in bone health. More patients with Fx are needed in the future to confirm these results.Acknowledgements
No acknowledgement found.References
1. Martel D, Honig S, Monga A, Chang G. Analysis of muscle, hip, and subcutaneous fat in osteoporosis patients with varying degrees of fracture risk using 3T Chemical Shift Encoded MRI. Bone Rep 2020;12:100259.
2. Patsch JM, Li X, Baum T, et al. Bone marrow fat composition as a novel imaging biomarker in postmenopausal women with prevalent fragility fractures. J Bone Miner Res 2013;28(8):1721-1728.
3. Burian E, Subburaj K, Mookiah MRK, et al. Texture analysis of vertebral bone marrow using chemical shift encoding–based water-fat MRI: a feasibility study. Osteoporosis Int 2019;30(6):1265-1274.
4. Rizzo S, Botta F, Raimondi S, et al. Radiomics: the facts and the challenges of image analysis. Eur Radiol Exp 2018;2(1):36.
5. Lambin P, Leijenaar RTH, Deist TM, et al. Radiomics: the bridge between medical imaging and personalized medicine. Nature reviews Clinical oncology 2017;14(12):749-762.
6. Algohary A, Viswanath S, Shiradkar R, et al. Radiomic features on MRI enable risk categorization of prostate cancer patients on active surveillance: Preliminary findings. Journal of magnetic resonance imaging : JMRI 2018.
7. Bickelhaupt S, Paech D, Kickingereder P, et al. Prediction of malignancy by a radiomic signature from contrast agent-free diffusion MRI in suspicious breast lesions found on screening mammography. Journal of magnetic resonance imaging : JMRI 2017;46(2):604-616.
8. Kan Y, Dong D, Zhang Y, et al. Radiomic signature as a predictive factor for lymph node metastasis in early-stage cervical cancer. Journal of magnetic resonance imaging : JMRI 2019;49(1):304-310.
9. Meng Y, Zhang Y, Dong D, et al. Novel radiomic signature as a prognostic biomarker for locally advanced rectal cancer. Journal of magnetic resonance imaging : JMRI 2018.
10. Sun Y, Hu P, Wang J, et al. Radiomic features of pretreatment MRI could identify T stage in patients with rectal cancer: Preliminary findings. Journal of magnetic resonance imaging : JMRI 2018.
11. Wilson R, Devaraj A. Radiomics of pulmonary nodules and lung cancer. Translational lung cancer research 2017;6(1):86-91.
12. Lin Q, Ji YF, Chen Y, et al. Radiomics model of contrast-enhanced MRI for early Prediction of acute pancreatitis severity. Journal of magnetic resonance imaging : JMRI 2020;51(2):397-406.
13. Martel D, Leporq B, Saxena A, et al. 3T chemical shift-encoded MRI: Detection of altered proximal femur marrow adipose tissue composition in glucocorticoid users and validation with magnetic resonance spectroscopy. J Magn Reson Imaging 2019;50(2):490-496.
14. Zwanenburg A, Vallières M, Abdalah MA, et al. The Image Biomarker Standardization Initiative: Standardized Quantitative Radiomics for High-Throughput Image-based Phenotyping. Radiology 2020;295(2):328-338.
Figures