4530
Q-Dixon and T2 Mapping for assessment of intervertebral disc degeneration in lower back pain1Department of Radiology, Zigong Fourth People's Hospital, Zigong, Sichuan, China, 2Department of MR Scientific Marketing,, Siemens Healthineers, Shanghai, China
Synopsis
Keywords: Bone, Degenerative
The diagnostic performance of MR T2w-based Pfirrmann classification decreases in early and severe stages in patients with lower back pain(LBP). The MR mapping technique, including q-Dixon and T2 mapping, allows for visualization and quantification of the discs and vertebrae in patients with LBP. The changes of bone marrow fat (BMF), T2 and T2* values can be seen in different pain levels and Pfirrmann classification, with great potential in quantifying biochemical degeneration of the lumbar spine.Introduction
Lower back pain(LBP) is the predominant manifestation of degenerative disc disease,even though the pathophysiological correlations between pain and disc degeneration are not fully understood as the problem of lower-back pain is multifactorial1.Magnetic resonance(MR) mapping techniques have been used to determine the structural integrity and degree of degeneration of the intervertebral discs( IVD ) and vertebrae. Vertebral bone marrow fat (BMF) deposition is negatively associated with bone density and closely related to osteoporosis2. T2 or T2* mapping is feasible to detectearly stages of degenerative disc disease3. Compared with traditional Pfirrmann classification, MR mapping is less affected by subjective factors, and the measurement of disc degeneration is more accurate, which helps to investigate the mechanisms of interaction between the vertebrae and the IVD. The purpose of our study was to demonstrate the potential benefits of BMF, T2, T2* mapping and biochemical IVDs regarding the detection and grading of lower back pain patients, and to correlate with already existing clinical scores to assess the diagnostic performance of MR mapping.Materials and Methods
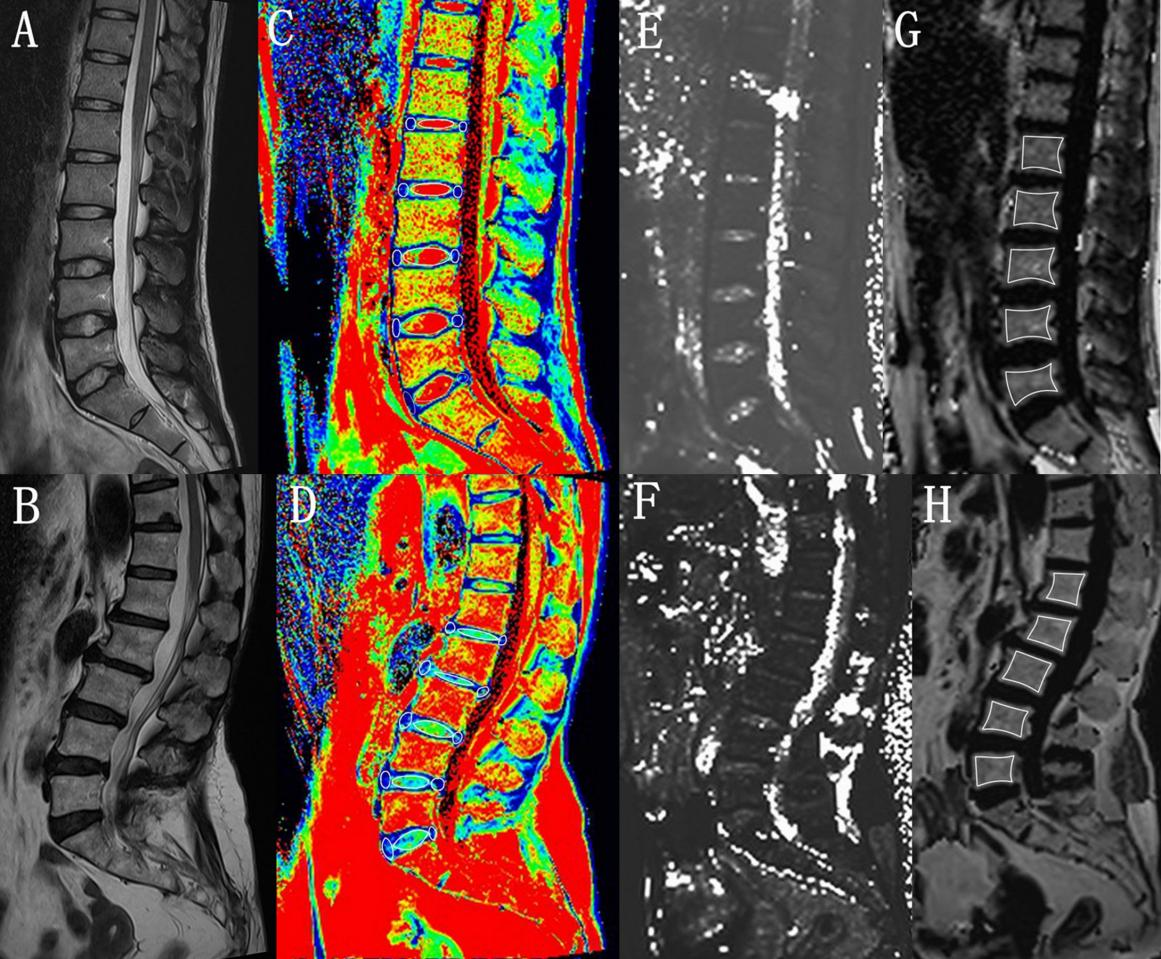
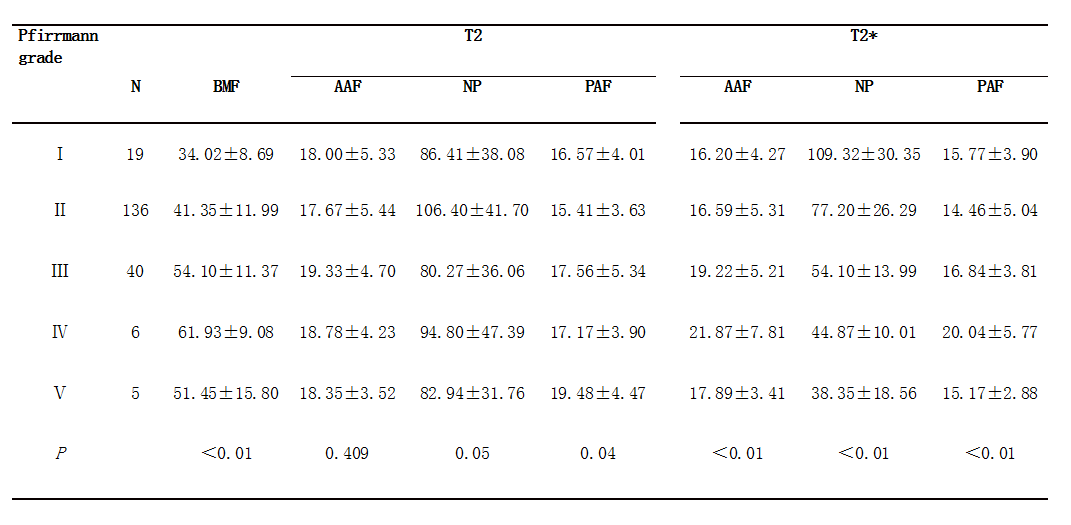
Between January 2021 and July 2022, 49 patients with LBP(23 males and 26 females, age range: 20-75 years, mean: 40.63±17.86 years) were selected and underwent MR imaging on a 1.5T MRI scanner (MAGNETOM Alea, Siemens Healthcare, Erlangen, Germany). All the patients were assessed with Chinese version of Oswestry Disability Index (CODI). The MRI mapping were collected as 6-echo qDixon, multiecho spin-echo T2 mapping imaging protocol covering sagittal lumbar spine with the following imaging parameters: a. qDixon,TR=10.2ms, TE1/ TE2/ TE3/ TE4/ TE5/ TE6 = 1.39ms/ 2.85ms/ 4.3ms/ 5.77ms / 7.23ms/ 8.69ms,FA=4°,3mm slice thickness with a total acquisition time = 34 seconds; b.T2mapping, TR=1200ms,TE1/ TE2/ TE3/ TE4/ TE5 =13.80ms/ 27.60ms/ 41.40ms/ 55.20ms/ 69.00ms, FA=180°,4mm slice thickness with a total acquisition time = 6 minutes 59 seconds. The Pfirrmann grade of each IVD was obtained based on T2WI. Region of interest (ROI) analysis was performed separately by two radiologists on qDxion map(BMF and T2* mapping) and T2 mapping to calculate the BMF from the L1 to L5 vertebrae, and the T2*and T2 values of each adjacent IVD separately. The IVD was divided equally into 5 areas to draw the region of interest (ROI): the anterior 1/5 area of each IVD represented the anterior annulus fibrosus (AAF) region, the 3/5 area represented the nucleus pulposus (NP), and the posterior 1/5 area represents the posterior annulus fibrosus (PAF) region. One-way analysis of variance, post-hoc comparisons, were performed to evaluate the differences in MR mapping between the groups. The relationships between BMF and the IVD features were analyzed using the Spearman correlation analysis. All analyses were done using SPSS22.0.Results
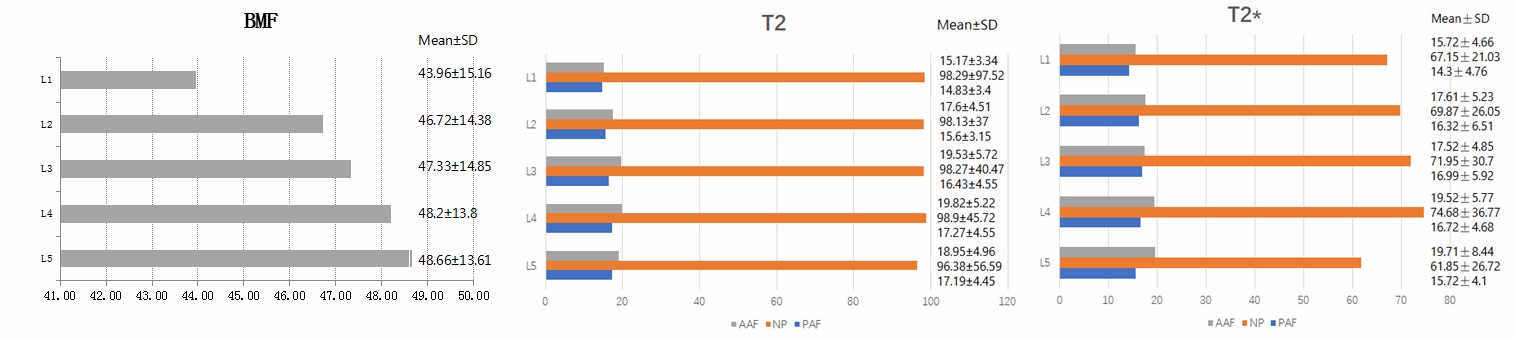
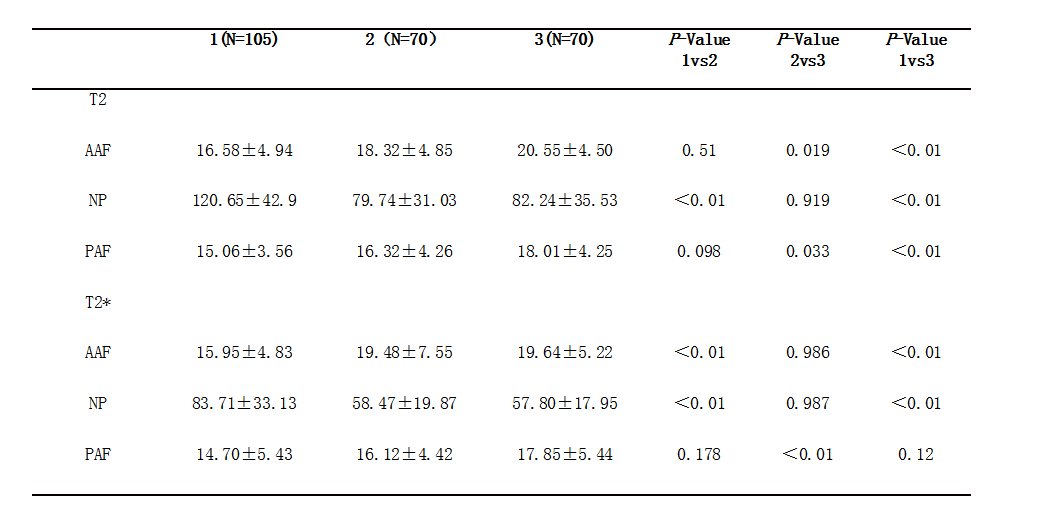
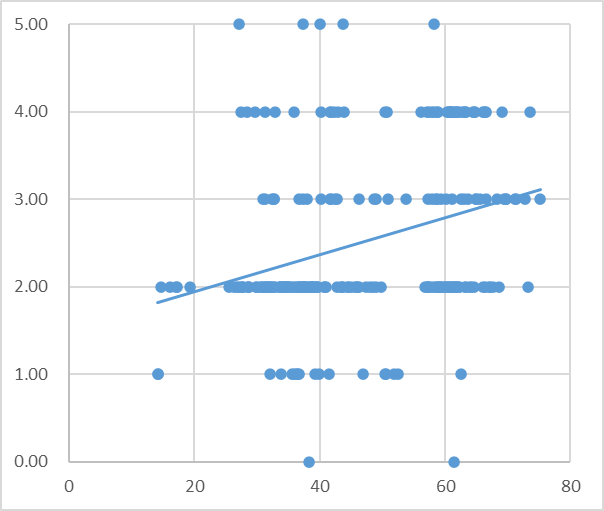
In total, 245 IVDs were analyzed from the 49 LBP patients,and there were 18 (7.34%), 136 (55.51%), 40(16.32%), 46 (18.78%), and 5(2.04%) IVDs from grade I to V in each of the Pfirrmann classification , respectively. According to CODI scores,all the LBP patients were divided into 3 groups(0- 10: slight pain, 11-20: moderate pain, 21 and higher: severe pain). The mean BMF values of L1 to L5 lumbar level for all subjects exhibited a gradual increasing trend(all p<0.05) (Figure1). The change in T2* and T2 does not have this regular. Table1 shows the T2* and T2 values for the AAF, NP and PAF in different CODI scores. The T2* value of AAP and T2 value of PAF significantly weakly correlated with BMF(r=0.163,p=0.011;r=0.166, p=0.009), the T2* and T2 values of the AAP, NP, FAP of grade II- III significantly correlated with the BMF value(p < 0.05), while the T2 values of the NP and AAP also significantly correlate with the BMF values in grade IV(p < 0.05). The Pfirrmann classification I-V correlated positively with the adjacent BMF (r =0.593, p < 0.01) ( Figure 2). Significant differences were observed in the BMF, T2* and T2 values in different Pfirrmann grades(Figure 3), except for T2 value in AAF(Table 2 ).Discussion
T2* and T2 values were sensitive and objective as MRI biomarkers for collagen integrity and water content of the intervertebral disc3, T2* and T2 values of NP were not significant difference in moderate and severe pain, whose values were significantly decreased from that in slight pain. Suggests that the production of significant pain is associated with a decrease in the water content of the intervertebral disc. The Pfirrmann classification grading was performed based on T2-weighted(T2W) images4. In degenerative IVD, the contrast ratio of T2W between NP and annulus fibrosus may be difficult to assess and may even disappear completely in serious degenerative disc disease, however, these can be well distinguished on T2* and T2 mapping, including in early and serious degeneration. Also, differences in BMF at different pain levels and Pfirrmann classification predict changes in the structure of lumbar spine.Conclusion
BMF, T2 and T2* values are closely related to Pfirrmann classification and CODI scores, and can quantitatively predict structural changes and the biochemical degeneration in the lumbar spine of patients with LBP.Acknowledgements
No acknowledgement found.References
1. Podichetty VK. The aging spine: the role of inflammatory mediators in intervertebral disc degeneration. Cell Mol Biol (Noisy-le-grand). 2007 May 30;53(5):4-18.
2. Ji Y, Hong W, Liu M, et al. Intervertebral disc degeneration associated with vertebral marrow fat, assessed using quantitative magnetic resonance imaging. Skeletal Radiol. 2020 Nov;49(11):1753-1763.
3. Hoppe S, Quirbach S, Mamisch TC, et al. Axial T2 mapping in intervertebral discs: a new technique for assessment of intervertebral disc degeneration. Eur Radiol. 2012 Sep;22(9):2013-9.
4. Bouhsina N, Decante C, Hardel JB, et al. Comparison of MRI T1, T2, and T2* mapping with histology for assessment of intervertebral disc degeneration in an ovine model. Sci Rep. 2022 Mar 30;12(1):5398.
Figures