4529
Quantification of the effects on proximal femur trabecular bone biometrics by parallel imaging and compressed sensing reconstruction1Department of Bioengineering, University of Pennsylvania, Philadelphia, PA, United States, 2Department of Radiology, University of Pennsylvania, Philadelphia, PA, United States, 3School of Electronics Engineering, Kyungpook National University, Daegu, Korea, Republic of, 4Department of Orthopaedic Surgery, University of Pennsylvania, Philadelphia, PA, United States
Synopsis
Keywords: Bone, Bone, Osteoporosis
The high resolution needed for quantification of trabecular bone biometrics in the proximal femur results in a prohibitively long scan time for clinical screening. Parallel imaging and compressed sensing (PICS) can reduce scan times by undersampling k-space while producing images comparable in quality to that of the Nyquist-sampled scan. Here, we show PICS recovers information on the trabecular microarchitecture at a quality comparable to that of Nyquist-sampled 3D balanced steady-state free precession. We quantify several parameters of trabecular bone for various acceleration factors to investigate the upper limit of PICS acceleration for femoral imaging.INTRODUCTION
Osteoporosis is a disease of increased fracture risk partially caused by microarchitectural deterioration of bone tissue1. Submillimeter-resolution MRI has the capability to image the trabecular microarchitecture of the proximal femur in vivo. Furthermore, these images can be analyzed to reproducibly quantify trabecular biometrics2. However, the depth of the proximal femur relative to the placement of the coil results in a clinically infeasible scan time to achieve reasonable SNR for quantification of these metrics3. We provide preliminary evidence to suggest that parallel imaging and compressed sensing techniques4, 5 can reduce the scan time while retaining the SNR and image detail necessary for trabecular quantification.METHODS
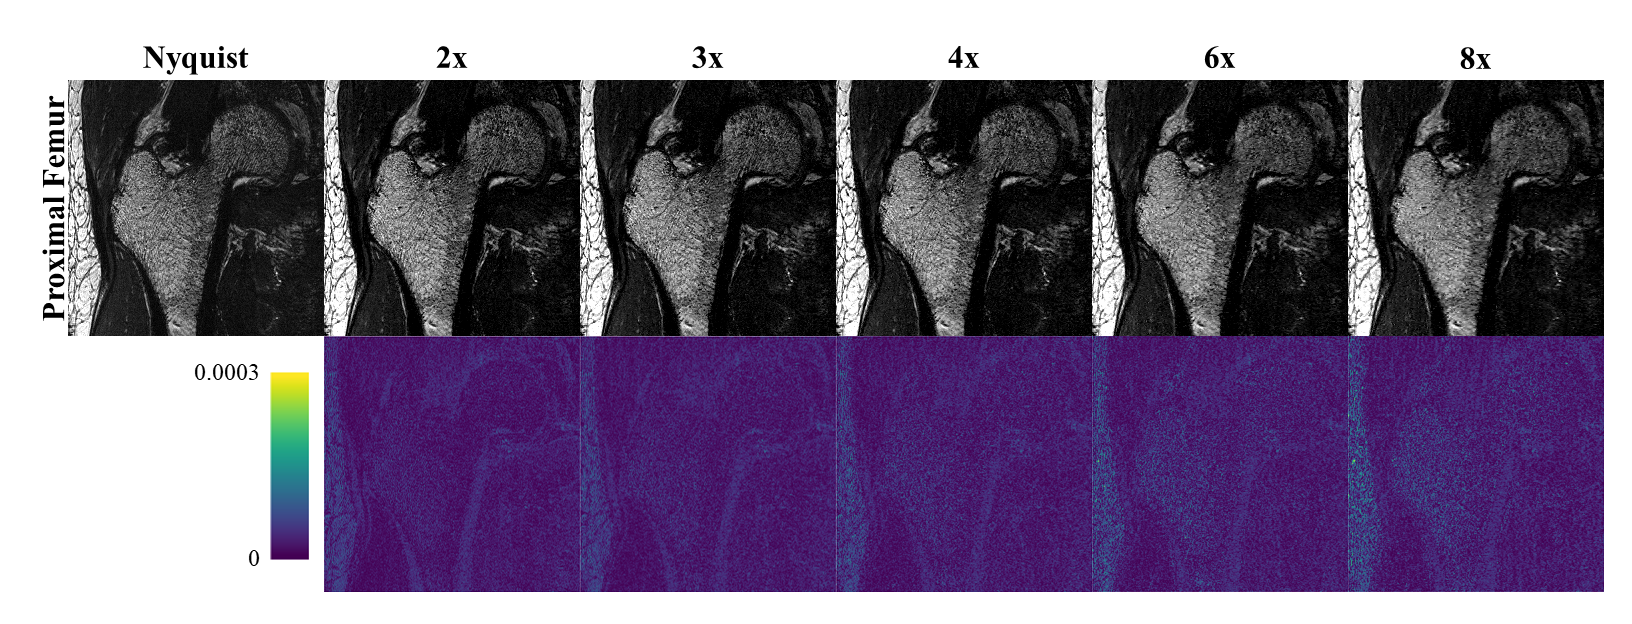
A balanced steady-state free precession (bSSFP) sequence with TR/TE of 9.4/4.7 ms was used to acquire images of the left proximal femur from 7 subjects (mean age: 24) using an 18-channel body matrix coil on a 3T Siemens Prisma scanner. The images have a field-of-view of 247.5x247.5x90 mm, matrix size of 550x550x200, and isotropic resolution of 450 µm. A flip angle of 50° and dwell time of 11 µs were selected to optimize for SNR in yellow bone marrow6. Without acceleration, the total scan time for the sequence was 17.2 minutes. Each subject was scanned twice for intersession reproducibility.The raw k-space data were reconstructed by root-sum-of-squares (RSS). Using a variable-density Poisson-disc sampling pattern7, the same k-space data were also retrospectively downsampled along the two phase-encode directions by factors of 2, 3, 4, 6, and 8, corresponding to theoretical scan times of 8.6, 5.7, 4.3, 2.9, and 2.2 minutes, respectively. The parallel imaging and compressed sensing (PICS) reconstruction used a calibration region width of 55 and kernel width of 10 to estimate a single set of sensitivity maps by ESPIRiT5. An inverse Fourier transform was taken along the readout direction8, and the 3D image $$$\hat{\boldsymbol{x}}$$$ was reconstructed slice-by-slice using SigPy9 according to the unconstrained objective,
$$\hat{\boldsymbol{x}}=\mathop{\mathrm{argmin}}_{\boldsymbol{x}} \frac{1}{2} \lVert\boldsymbol{y} - D F S \boldsymbol{x}\rVert_2^2 + \lambda \lVert\Psi \boldsymbol{x}\rVert_1.$$
$$$\boldsymbol{y}$$$ are the k-space measurements, $$$D$$$ is the downsampling operator given by Poisson-disc sampling, $$$F$$$ is the discrete Fourier transform, $$$S$$$ are the coil sensitivities, $$$\lambda$$$ is a regularization parameter, and $$$\Psi$$$ is the discrete wavelet transform.
For the trabecular bone analysis, pixel intensities were linearly mapped to a value from 0 to 100, with 0 corresponding to the average signal intensity of in a measured region of bone marrow and 100 corresponding to that of cortical bone10. All remaining values above 100 and below 0 were set to 100 and 0, respectively. A cubic volume-of-interest (VOI) of side length 14.85 mm was selected from the intertrochanteric region of each processed image and upscaled by bilinear interpolation to a voxel size of 50 µm. The same VOI was selected across the various reconstructions for a single scan. No image registration was performed across separate scans. The resulting VOIs were thresholded and binarized so that the average bone volume fraction measured across all RSS images was 0.311. Bone volume fraction (BV/TV), average trabecular thickness (TbTh), and average trabecular spacing (TbSp) were computed using BoneJ12 for each VOI. Correlation and Bland-Altman analyses were performed for each metric between the RSS and PICS image reconstructions using MATLAB and SPSS. Single-measures two-way mixed ICC (intraclass correlation coefficient) was used to assess intersession reproducibility of the RSS reconstruction and to assess agreement among the RSS and PICS reconstructions13, 14.
RESULTS
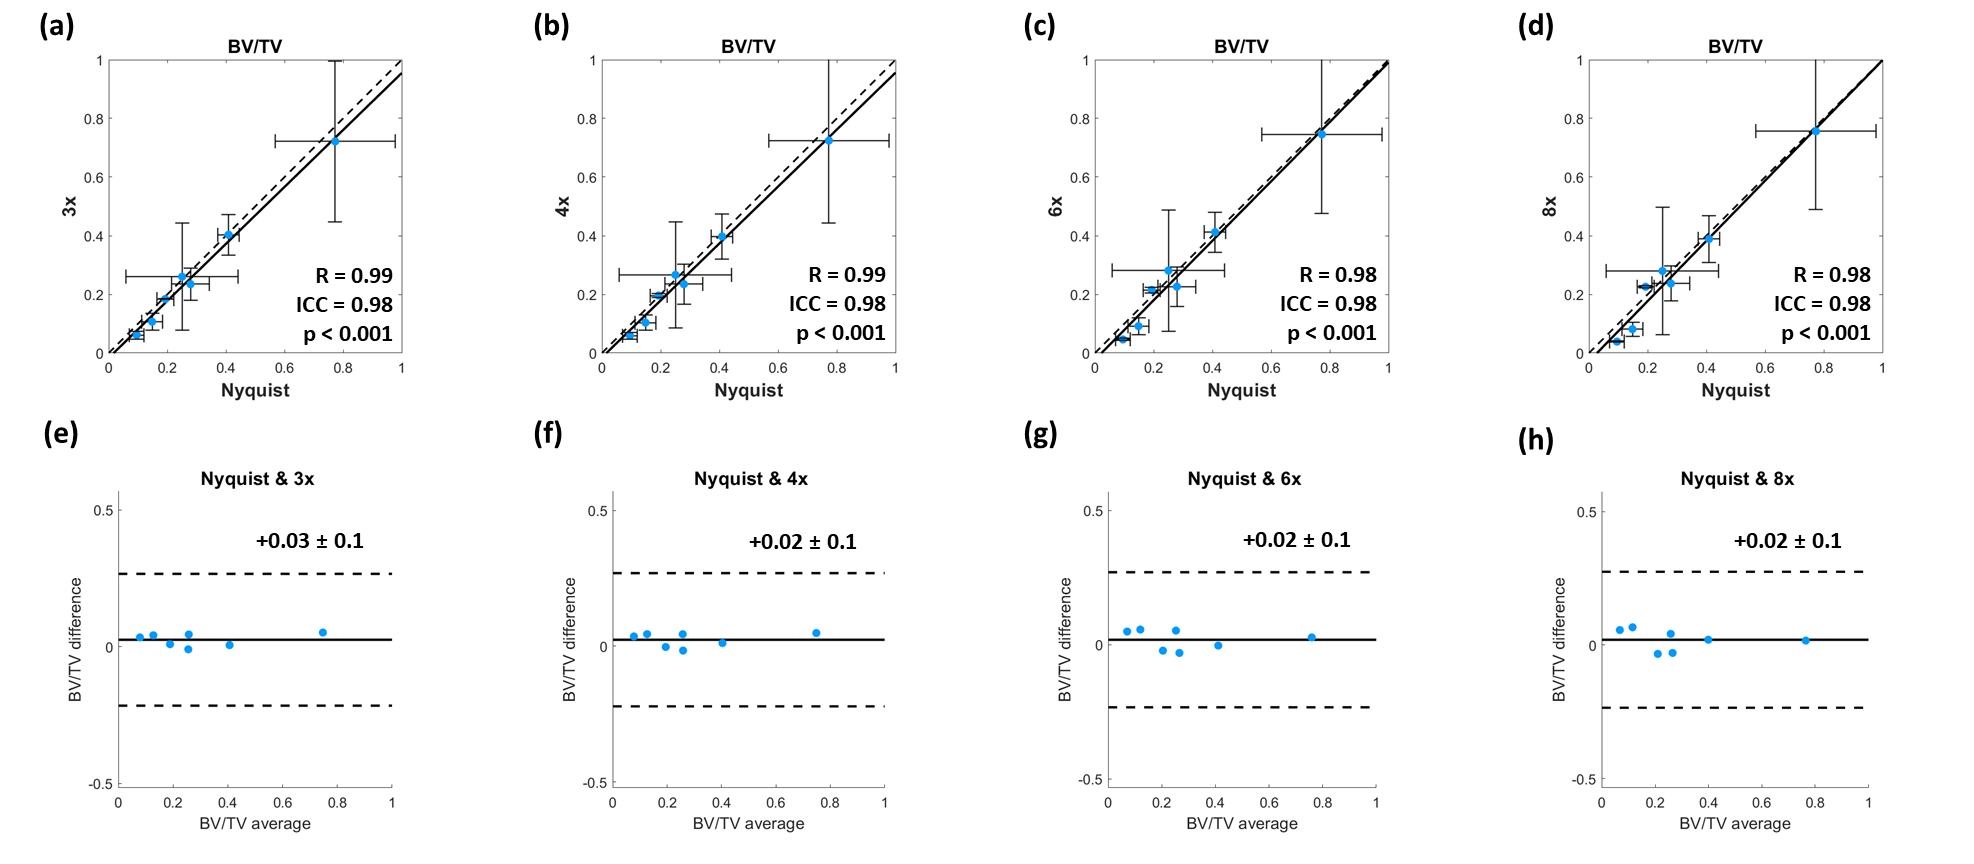
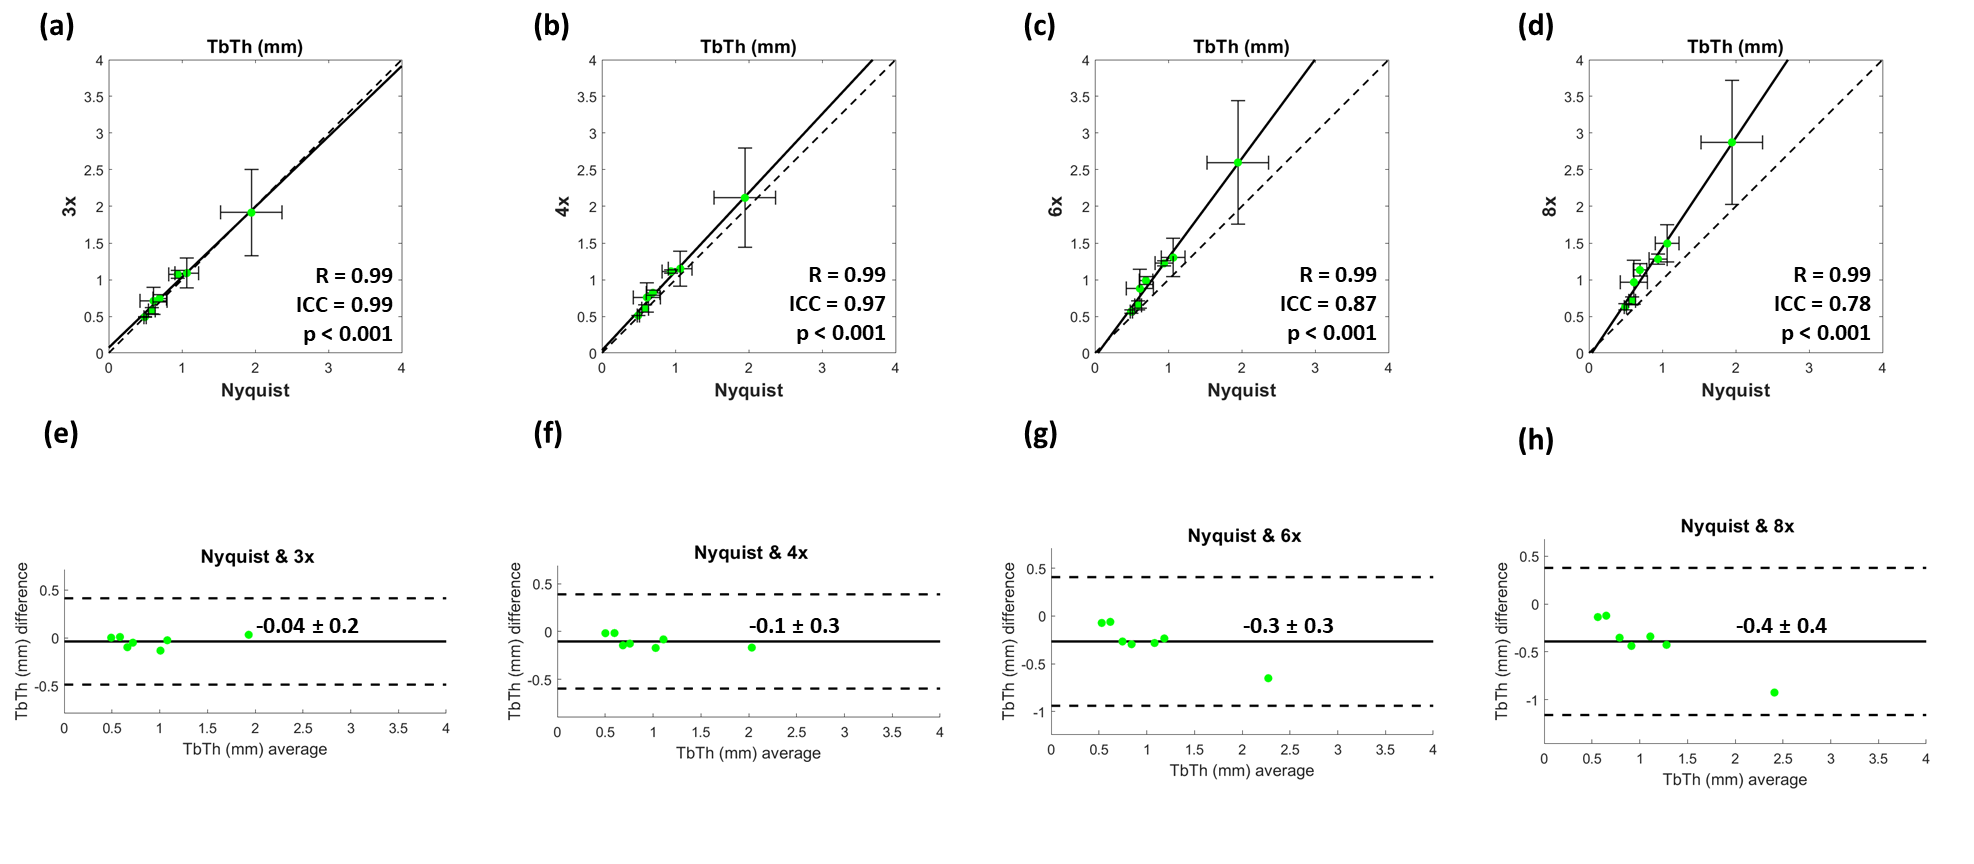
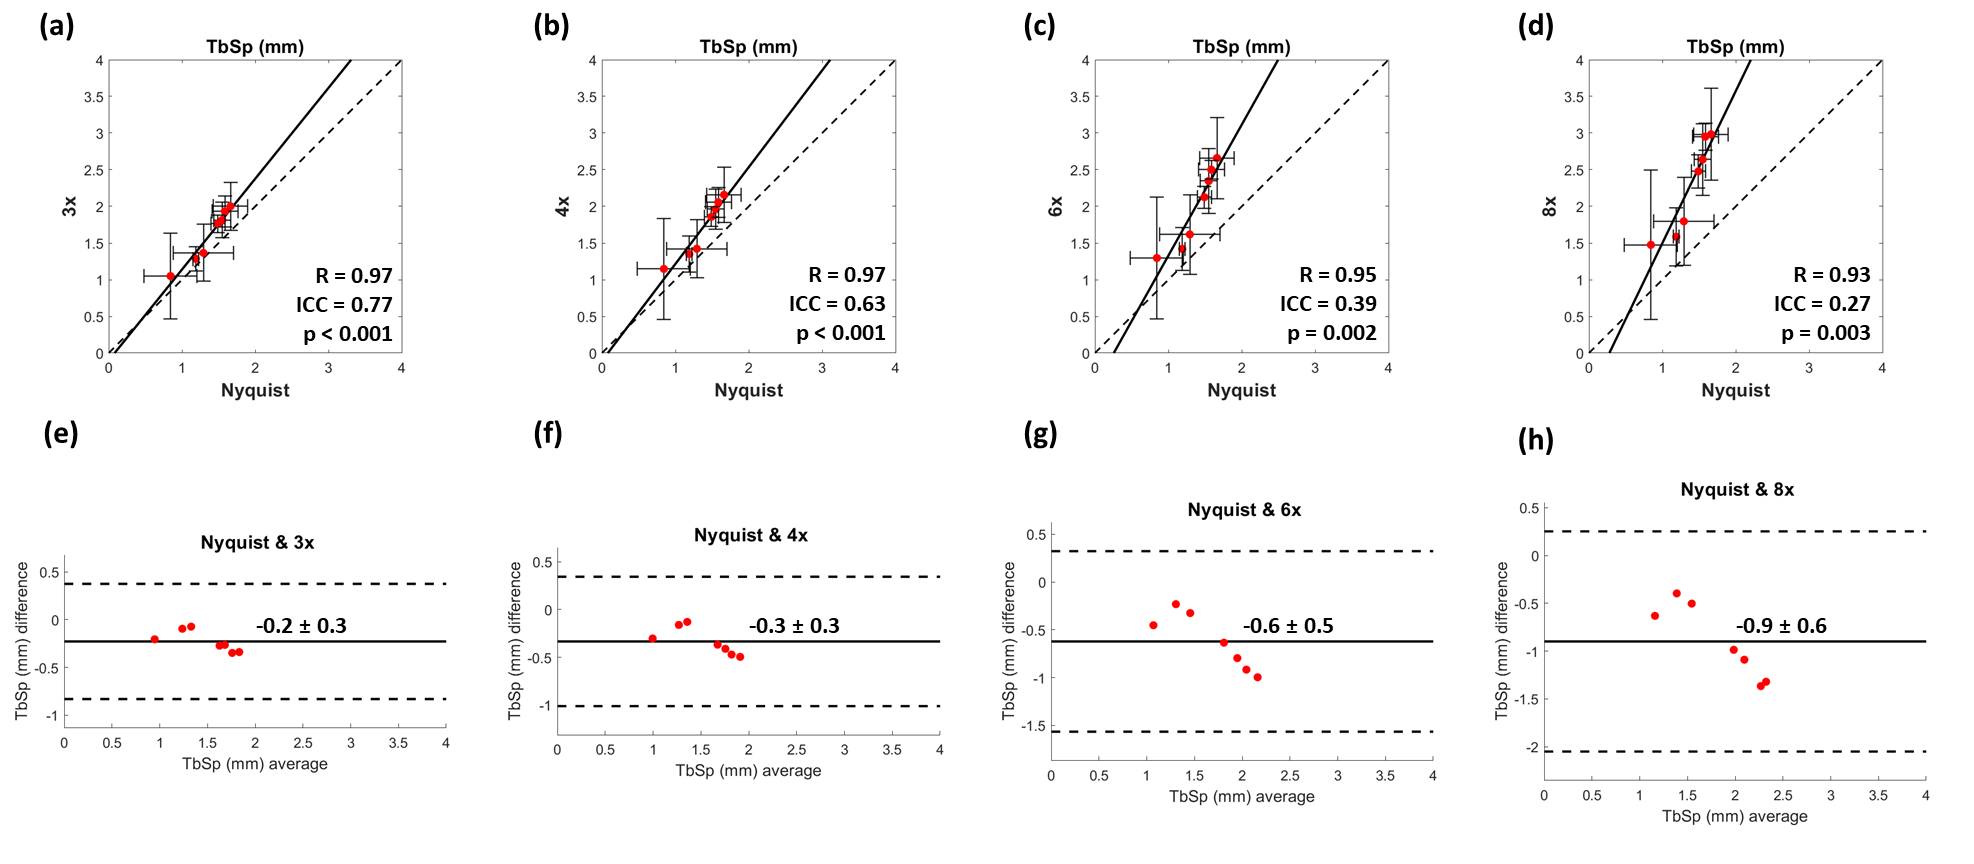
The ICC for intersession reproducibility of trabecular metrics was found to be 0.79, 0.86, and 0.45 for BV/TV, TbTh, and TbSp, respectively, in the RSS images. The PICS image reconstructions show little visual deviation from the RSS reconstruction in the trabecular microarchitecture up to an acceleration factor of about 6 (Figure 1). At higher accelerations, the loss of trabecular detail is seen when comparing reconstructions of the same VOI. For accelerations less than 4, the morphology and connectivity of the trabeculae appear qualitatively like that of the RSS reconstruction. As the acceleration factor increases, the average trabecular thickness increases, and small spaces between trabeculae are obliterated (Figure 2). Correlation and Bland-Altman analyses suggest that for the range of acceleration factors studied, the quantification of BV/TV in the intertrochanteric region remains consistent to that of the Nyquist-sampled image (Figure 3). However, quantification of average TbTh and TbSp is more severely biased and variant as the acceleration factor increases (Figures 4-5).DISCUSSION
The preliminary data suggest that to consistently quantify parameters of trabecular bone from images reconstructed by PICS, a more conservative acceleration factor should be selected. Quantification of BV/TV remained consistent even when increasing the acceleration factor to 8. The loss of structural detail in images with higher acceleration factors is quantified in the bias and variance incurred by the metrics of TbTh and TbSp.This study is limited by its lack of analysis on the absolute accuracy of the measured parameters of trabecular bone. Further investigation is needed to determine the appropriate threshold for binarization of trabecular VOIs. Future work would evaluate the agreement and reproducibility of PICS for prospective acquisitions.
CONCLUSION
The results suggest that PICS reconstruction may be a suitable technique for quantifying parameters of trabecular bone in the proximal femur in a clinically feasible scan time.Acknowledgements
NIH R01 AR068382, R01 AR076392, T32 EB009384. This material is based upon work supported by the National Science Foundation Graduate Research Fellowship under Grant No. 1845298.References
1. Consensus development conference: diagnosis, prophylaxis, and treatment of osteoporosis. Am J Med. 1993;94(6):646-50. doi: 10.1016/0002-9343(93)90218-e. PubMed PMID: 8506892.
2. Chang G, Rajapakse CS, Chen C, Welbeck A, Egol K, Regatte RR, Saha PK, Honig S. 3-T MR Imaging of Proximal Femur Microarchitecture in Subjects with and without Fragility Fracture and Nonosteoporotic Proximal Femur Bone Mineral Density. Radiology. 2018;287(2):608-19. Epub 20180219. doi: 10.1148/radiol.2017170138. PubMed PMID: 29457963; PMCID: PMC5929368.
3. Vu BD, Jones BC, Xu W, Chang G, Rajapakse CS. Acceleration of high-resolution proximal femur MRI using compressive sensing and sparsity in a retrospective study. ISMRM & SMRT Annual Meeting and Exhibition - An Online Experience; Virtual2021.
4. Lustig M, Donoho D, Pauly JM. Sparse MRI: The application of compressed sensing for rapid MR imaging. Magn Reson Med. 2007;58(6):1182-95. doi: 10.1002/mrm.21391. PubMed PMID: 17969013.
5. Uecker M, Lai P, Murphy MJ, Virtue P, Elad M, Pauly JM, Vasanawala SS, Lustig M. ESPIRiT--an eigenvalue approach to autocalibrating parallel MRI: where SENSE meets GRAPPA. Magn Reson Med. 2014;71(3):990-1001. doi: 10.1002/mrm.24751. PubMed PMID: 23649942; PMCID: PMC4142121.
6. Han M, Chiba K, Banerjee S, Carballido-Gamio J, Krug R. Variable flip angle three-dimensional fast spin-echo sequence combined with outer volume suppression for imaging trabecular bone structure of the proximal femur. J Magn Reson Imaging. 2015;41(5):1300-10. Epub 20140623. doi: 10.1002/jmri.24673. PubMed PMID: 24956149; PMCID: PMC4275424.
7. Bridson R. Fast Poisson disk sampling in arbitrary dimensions. SIGGRAPH sketches. 2007;10(1):1.
8. Murphy M, Alley M, Demmel J, Keutzer K, Vasanawala S, Lustig M. Fast l(1)-SPIRiT compressed sensing parallel imaging MRI: scalable parallel implementation and clinically feasible runtime. IEEE Trans Med Imaging. 2012;31(6):1250-62. Epub 20120215. doi: 10.1109/TMI.2012.2188039. PubMed PMID: 22345529; PMCID: PMC3522122.
9. Ong F, Lustig M. SigPy: A Python Package for High Performance Iterative Reconstruction. ISMRM 27th Annual Meeting & Exhibition; Montréal, QC, Canada2019.
10. Rajapakse CS, Hotca A, Newman BT, Ramme A, Vira S, Kobe EA, Miller R, Honig S, Chang G. Patient-specific Hip Fracture Strength Assessment with Microstructural MR Imaging-based Finite Element Modeling. Radiology. 2017;283(3):854-61. Epub 20161202. doi: 10.1148/radiol.2016160874. PubMed PMID: 27918708; PMCID: PMC5452878.
11. Bauer JS, Kohlmann S, Eckstein F, Mueller D, Lochmuller EM, Link TM. Structural analysis of trabecular bone of the proximal femur using multislice computed tomography: a comparison with dual X-ray absorptiometry for predicting biomechanical strength in vitro. Calcif Tissue Int. 2006;78(2):78-89. Epub 20060206. doi: 10.1007/s00223-005-0070-3. PubMed PMID: 16467973.
12. Doube M, Klosowski MM, Arganda-Carreras I, Cordelieres FP, Dougherty RP, Jackson JS, Schmid B, Hutchinson JR, Shefelbine SJ. BoneJ: Free and extensible bone image analysis in ImageJ. Bone. 2010;47(6):1076-9. Epub 20100915. doi: 10.1016/j.bone.2010.08.023. PubMed PMID: 20817052; PMCID: PMC3193171.
13. Koo TK, Li MY. A Guideline of Selecting and Reporting Intraclass Correlation Coefficients for Reliability Research. J Chiropr Med. 2016;15(2):155-63. Epub 20160331. doi: 10.1016/j.jcm.2016.02.012. PubMed PMID: 27330520; PMCID: PMC4913118. 14. Shrout PE, Fleiss JL. Intraclass correlations: uses in assessing rater reliability. Psychol Bull. 1979;86(2):420-8. doi: 10.1037//0033-2909.86.2.420. PubMed PMID: 18839484.
Figures