4524
Correlation of R2* with fat fraction and bone mineral density and its role in quantitative assessment of osteoporosis1Radiology, Honghui Hospital Affiliated Xi’an Jiaotong University, xi an, China
Synopsis
Keywords: Bone, Quantitative Imaging, Osteoporosis; Bone density
In this study, we investigated the relationship between vertebral R2* and FF based on IDEAL-IQ sequences and BMD based on QCT, and then performed diagnostic experiments. The results revealed a definite but weak linear relationship between R2* with FF and BMD, which has limited value as a diagnostic indicator for OP and osteopenia, but has some potential as a complement to FF and BMD for fine quantification of bone marrow conversion and bone mineral loss.Summary of Main Findings:
R2* based on IDEAL-IQ sequences have a definite but weak linear relationship with FF and BMD, and can be used as a complement to FF and BMD for fine quantification of bone mineral loss and bone marrow fat conversionAbstract:
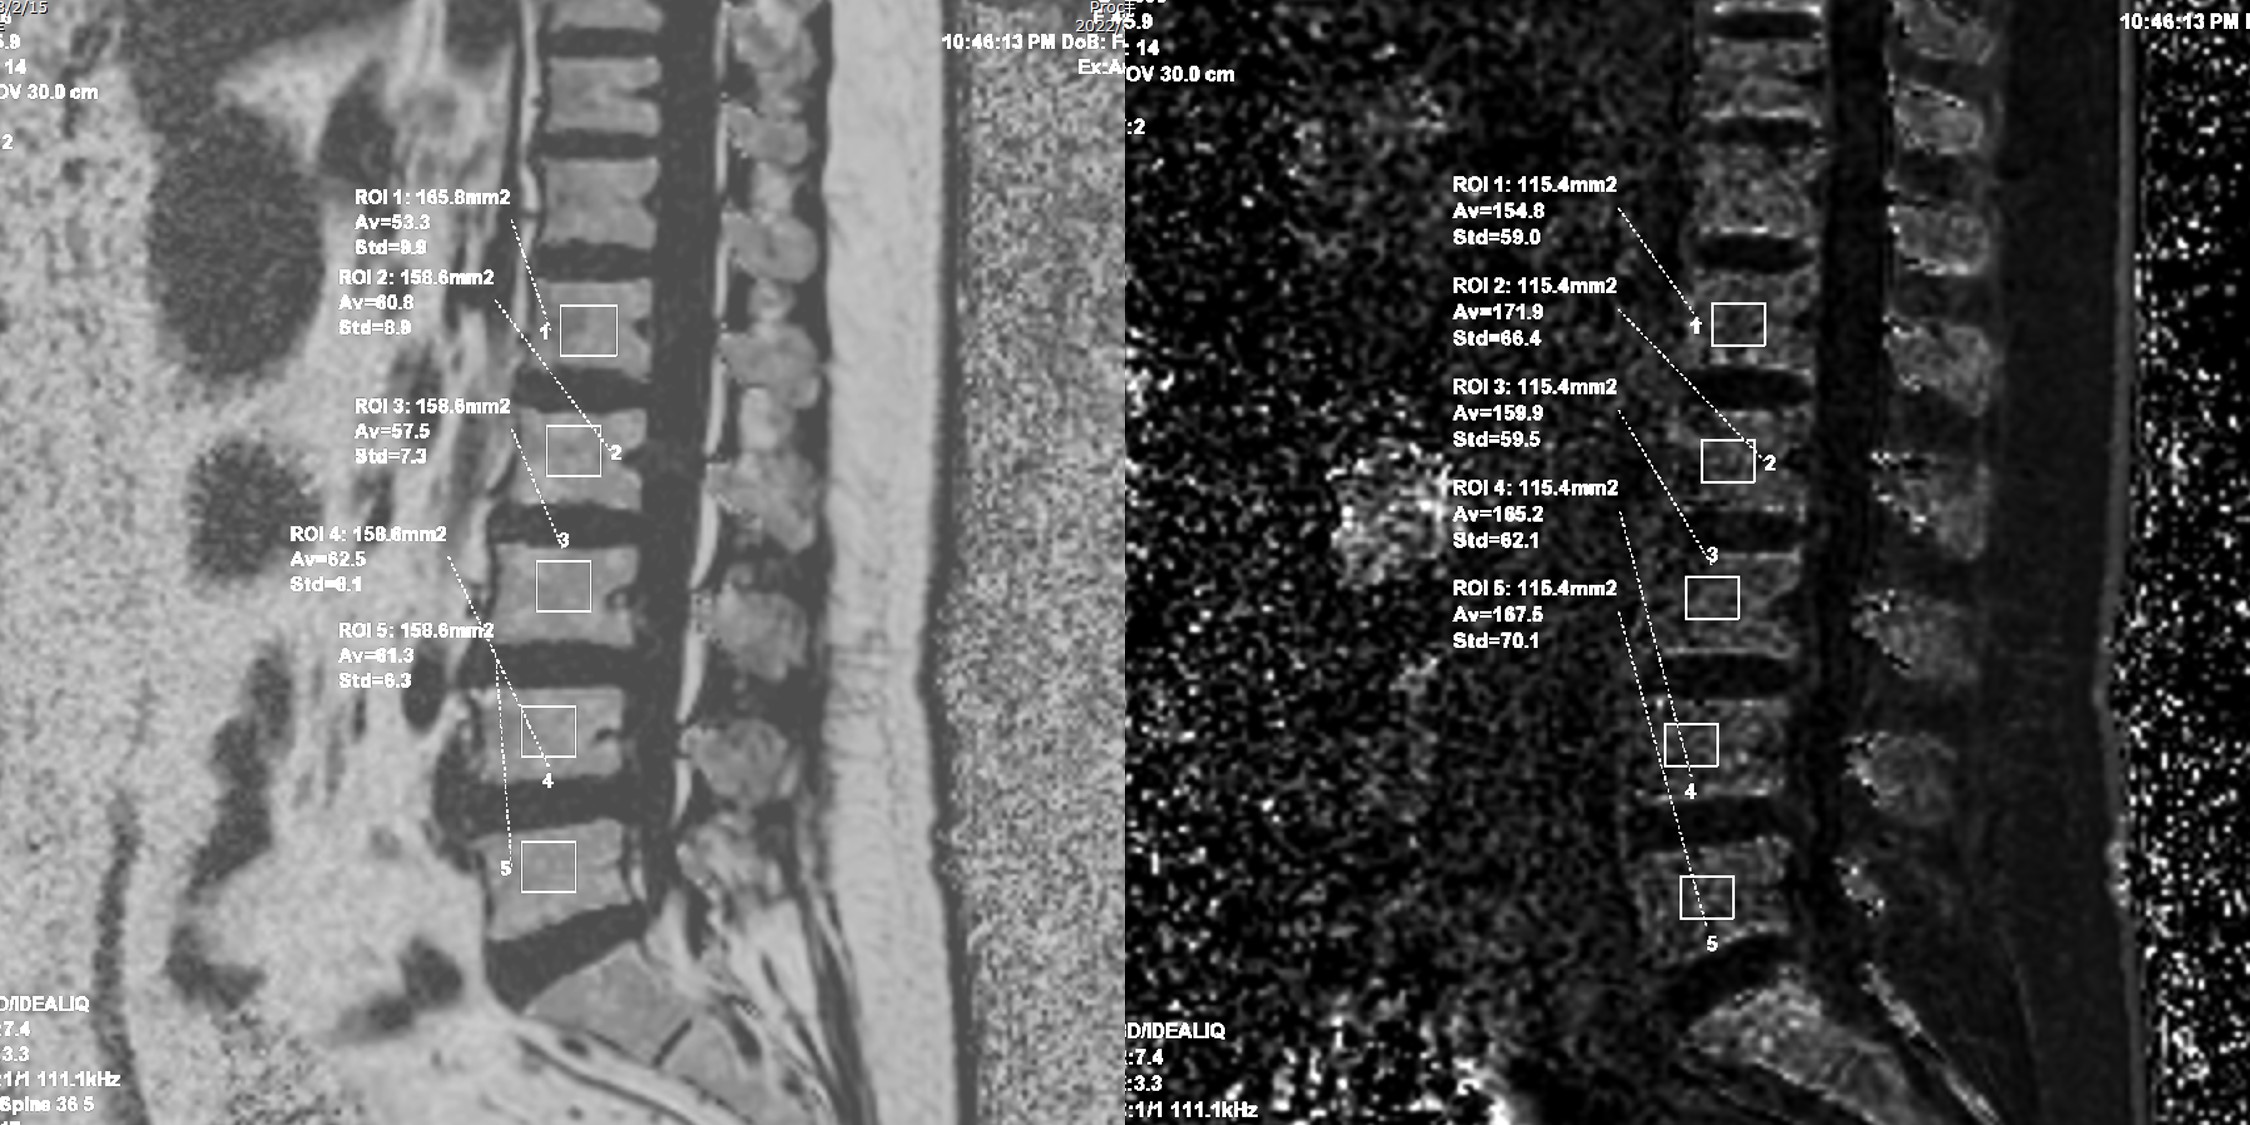
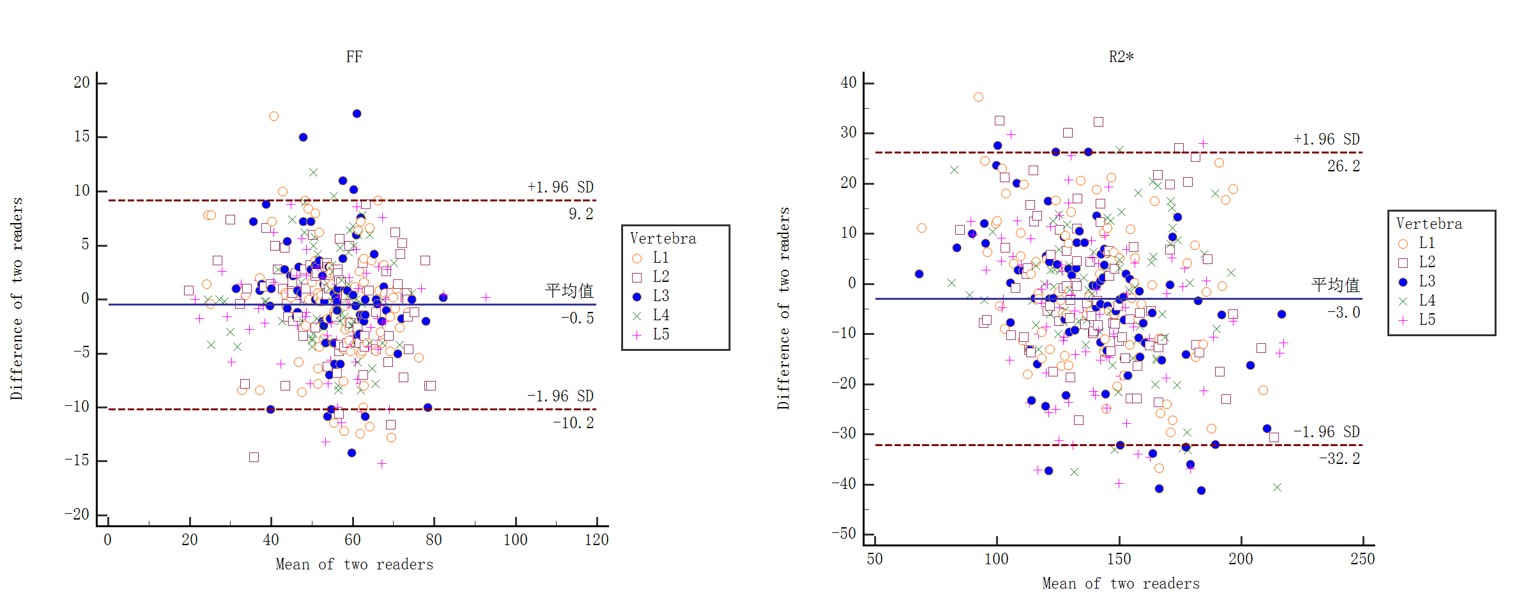
Introduction: R2*, the inverse of the effective transverse relaxation time [T2*], is a derived research product that has received increasing attention in recent studies. In the spine, R2* has been tried for the differentiation of osteoporotic, traumatic and malignant vertebral fractures 1-3 and also to distinguish aplastic anemia from myelodysplastic syndromes 4. Some other studies have pointed out that R2* (T2*) of the vertebral bone marrow correlates with the ferritin content of the red bone marrow as well as the density and orientation of the trabeculae 5, 6. We were interested in the correlation between R2* and BMAT content of the vertebral body as well as BMD. However, the relationship between R2* with FF and BMD has been rarely reported and remains controversial 5, 7, 8, and its role in the quantitative assessment of OP still needs further validation. In this study, we enrolled a group of patients with chronic low back pain who underwent IDEAL-IQ sequences scan of the lumbar spine as well as QCT scan, and we aimed to investigate the correlation between R2* with FF and BMD, and to explore its role in the quantitative assessment of OP.Methods: Total of 83 patients with low back pain (59.77±7.46 years, 30 males) were enrolled, which underwent lumbar IDEAL-IQ sequences and quantitative computed tomography (QCT) scanning within 48h. The vertebral FF, R2* and BMD were respectively measured by 2 readers, and Intraclass correlation coefficient (ICC) and Bland-Altman plot were engaged to evaluate the agreement. According to BMD, all patients were divided into BMD normal, osteopenia, and OP groups 9, and the difference of FF and R2* among groups were analyzed by one-way ANOVA. The correlation between R2*, FF, and BMD were analyzed by Pearson test. Taking BMD as the gold standard, the efficacies of FF and R2* for the diagnosis of OP and osteopenia were assessed by receiver operating characteristic (ROC) curve, and the area under the curve (AUC) of them were compared with DeLong test.
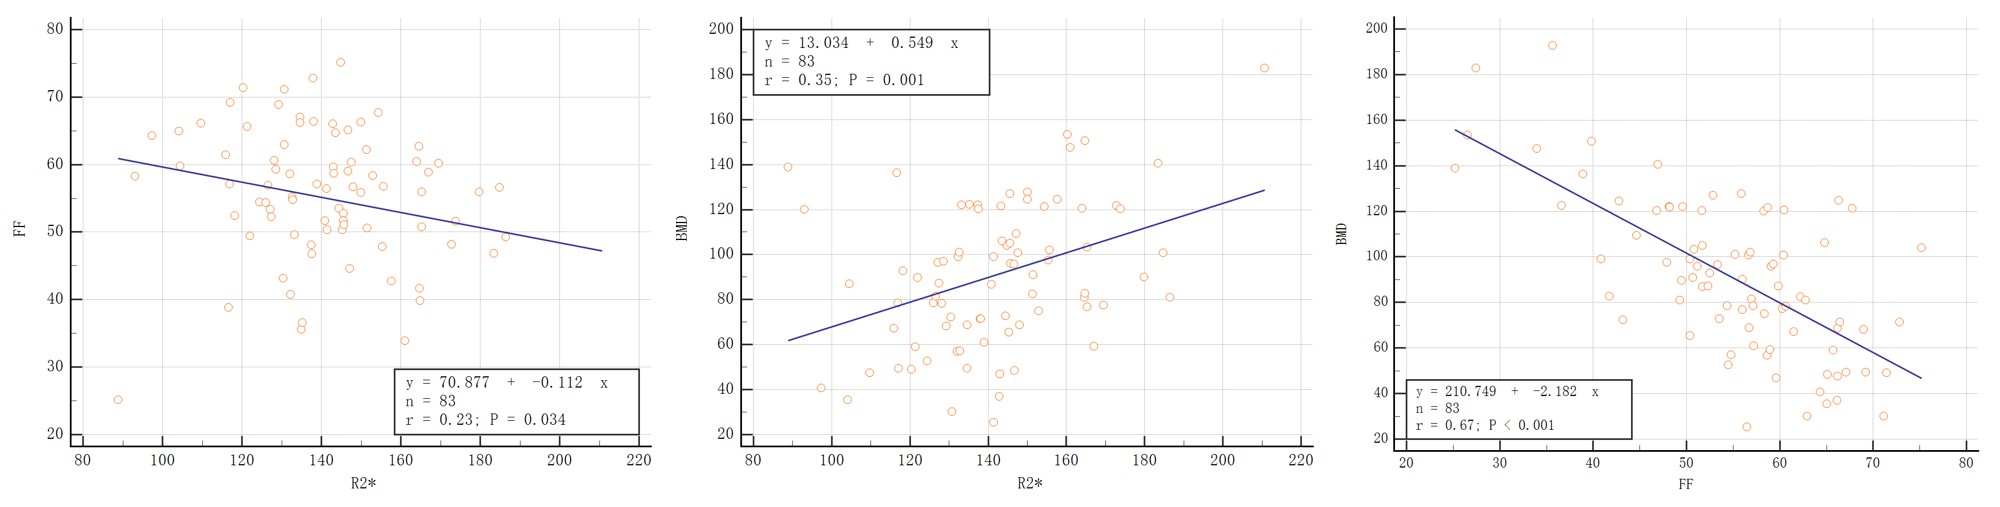
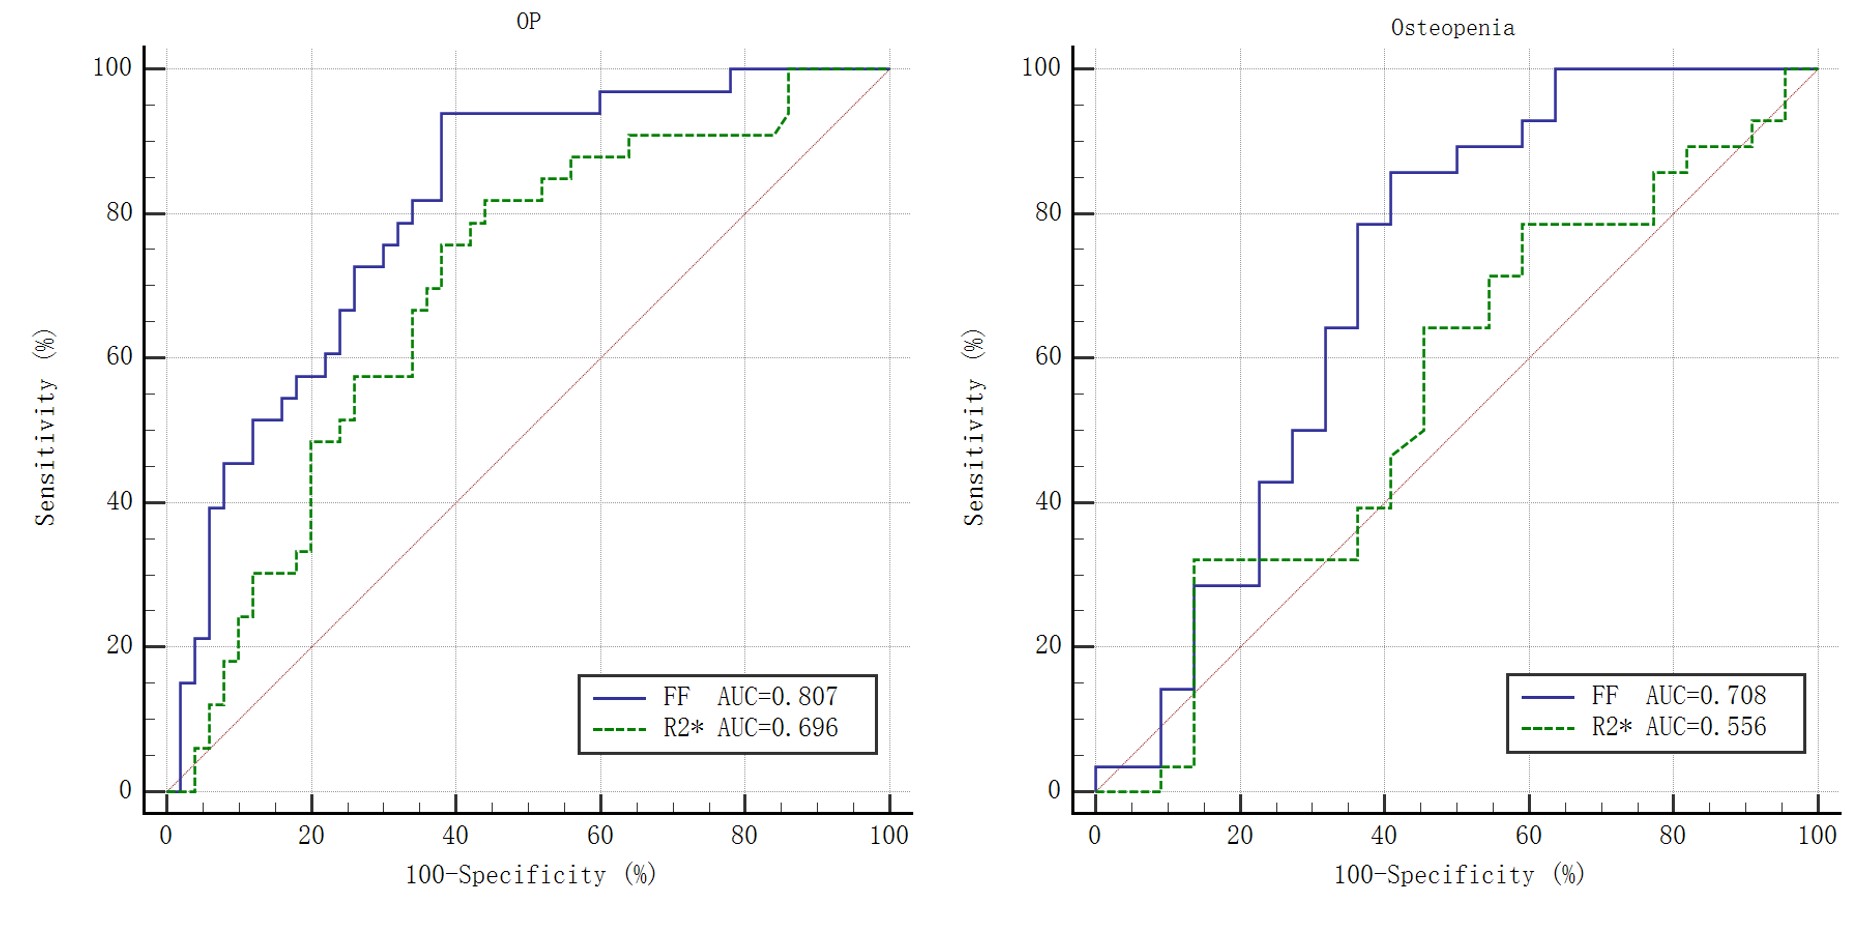
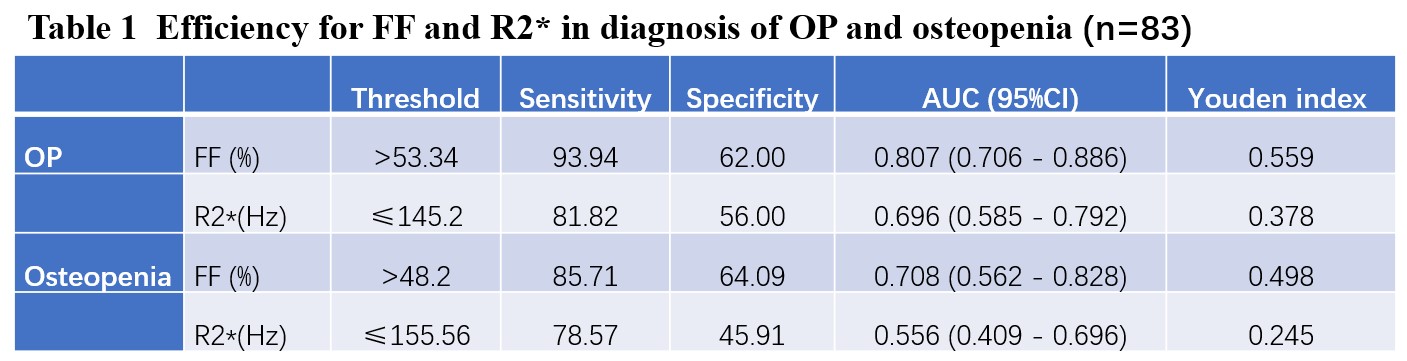
Results: The FF, R2*, and BMD agreed well in 2 readers (ICC values of 0.917, 0.886, and 0.938, respectively). The FF and R2* were statistically different among groups (F values of 19.611 and 4.015, both P < 0.05), and R2* were significantly correlated with FF and BMD, respectively (r values of 0.233 and 0.349, both P < 0.05). In the diagnosis of OP and osteopenia, the AUCs were 0.807 and 0.708 for FF and 0.696 and 0.556 for R2*, respectively. The AUC of R2* was lower than FF in the diagnosis of OP (Z=7.503, P=0.033).
Discussion: R2* is associated with the deposition of ferritin in the bone marrow, which is located mainly in the red bone marrow 4, 5. In patients with osteoporosis, the bone mineral content is reduced, the bone trabeculae are thinner, the trabecular space is enlarged, its residual space is filled by a large amount of adipose tissue, and the red bone marrow content is relatively reduced, so R2* correlates with both FF as well as BMD. In addition, it has been shown that bone is more paramagnetic than bone marrow and that the trabecular-bone marrow interface causes local magnetic field inhomogeneity, which can be measured as T2* (R2*) 6. In the present study, R2* values of vertebrae were positively correlated with BMD and negatively correlated with FF, which we suggest is related to the widening of the trabecular gap, the reduction of the trabecular-marrow interface and the fatty conversion of red bone marrow when osteoporosis occurs.
Notably, R2* was weakly correlated with FF and BMD and FF and BMD were significantly correlated in our study, unlike Watanabe's study 8, where R2* was correlated with BMD (r=0.602), but FF was not. We believe that the susceptibility of bone mineral loss and bone marrow fat conversion to other factors (e.g., nutritional fluctuations, hormonal changes, and metabolic disorders) 10 contribute to the different findings. The exclusion of metabolic and hematopoietic system diseases other than osteoporosis in our study and the absence of differences in BMI between BMD groups reduced the influence of the above-mentioned factors on our findings. In the diagnostic test, the AUC of R2* for both diagnosing OP and osteopenia was not high and lower than that of FF in diagnosing OP, which hardly allowed us to use it as an independent diagnostic indicator for OP. However, it has some advantages in reflecting bone marrow conversion as well as microstructural changes in bone trabeculae, during the development of OP, and can be used as a complement to FF and BMD for fine quantitative assessment of OP.
Conclusion: R2* based on IDEAL-IQ sequences have a definite linear relationship with FF and BMD, but it is not yet sufficient as a separate clinical diagnostic indicator and can be used as a complement to FF and BMD for quantitative assessment of OP.
Acknowledgements
At the point of finishing this paper, I’d like to express my sincere thanks to all my colleagues who have lent me hands in the course of my writing this paper. At the same time, I'd like to take this opportunity to show my sincere gratitude to my supervisor, Prof. Ma Xiaowen and Jiang Yonghong, who has given me so much useful advices on my writing, and has best to improve my paper.References
1. Sollmann N, Becherucci EA, Boehm C, et al. Texture Analysis Using CT and Chemical Shift Encoding-Based Water-Fat MRI Can Improve Differentiation Between Patients With and Without Osteoporotic Vertebral Fractures. Front Endocrinol. 2021;12:778537.
2. Leonhardt Y, Gassert FT, Feuerriegel G, et al. Vertebral bone marrow T2* mapping using chemical shift encoding-based water-fat separation in the quantitative analysis of lumbar osteoporosis and osteoporotic fractures. Quant Imaging Med Surg. 2021;11(8):3715-25.
3. Schmeel FC, Luetkens JA, Feisst A, et al. Quantitative evaluation of T2* relaxation times for the differentiation of acute benign and malignant vertebral body fractures. Eur J Radiol. 2018;108:59-65.
4. Zeng Z, Ma X, Guo Y, Ye B, Xu M, Wang W. Quantifying Bone Marrow Fat Fraction and Iron by MRI for Distinguishing Aplastic Anemia from Myelodysplastic Syndromes. J Magn Reson Imaging. 2021,54(6):1754-1760.
5. Shan B, Ding H, Lin Q, et al. Repeatability and Image Quality of IDEAL-IQ in Human Lumbar Vertebrae for Fat and Iron Quantification across Acquisition Parameters. Comput Math Methods Med. DOI: 10.1155/2022/2229160.
6. Wehrli FW, Song HK, Saha PK, Wright AC. Quantitative MRI for the assessment of bone structure and function. NMR Biomed. 2006;19(7):731-64.
7. Liau J, Shiehmorteza M, Girard OM, Sirlin CB, Bydder M. Evaluation of MRI fat fraction in the liver and spine pre and post SPIO infusion. Magn Reson Imaging. 2013;31(6):1012-6.
8. Watanabe D, Kimura T, Yanagida K, et al. Feasibility of assessing male osteoporosis using MRI IDEAL-IQ sequence of proximal femur in prostate cancer patients. Aging Male. 2022;25(1):228-33.
9. Ward RJ, Roberts CC, Bencardino JT, et al. ACR Appropriateness Criteria Osteoporosis and Bone Mineral Density. J Am Coll Radiol. 2017;14(5S):S189-S202.
10. Tratwal J, Labella R, Bravenboer N, et al. Reporting Guidelines, Review of Methodological Standards, and Challenges Toward Harmonization in Bone Marrow Adiposity Research. Report of the Methodologies Working Group of the International Bone Marrow Adiposity Society. Front Endocrinol. 2020;11:65.
Figures