4516
Improved segmentation of neuromelanin region for low SNR short scan sandwichNM imaging1Department of Electrical and Computer Engineering, Seoul National University, Seoul, Korea, Republic of, 2Department of Biomedical Engineering, Hankuk University of Foreign Studies, Gyeonggi-do, Korea, Republic of, 3Institute of Radiation Medicine, Seoul National University Medical Research Center, Seoul, Korea, Republic of, 4Department of Radiology, Seoul National University Hospital, Seoul, Korea, Republic of
Synopsis
Keywords: Machine Learning/Artificial Intelligence, Parkinson's Disease, Neuromelanin, Denoising
Neuromelanin (NM) has been considered an associated biomarker of Parkinson’s disease (PD). Conventional NM visualizeing techniques requires about 5~10min which is sub-optimal for scanning PD patient with movement disorders. Recently, SandwichNM is reduced scan time to 5m 30s, but it is still may not enough.
In this research, we approach this issue in the viewpoint of image post processing with denoising techniques to reduce scan time. After 162 NM MRI data acquisition with short scan time, we demonstrated that using denoising technique can improve the distinguishability for NM segmentation.
INTRODUCTION
Neuromelanin (NM) is a dark brown intracellular pigment found abundantly in substantia nigra (SN).1,2 NM has been considered one of the biomarkers associated to Parkinson’s disease (PD), where visible loss of NM pigments occur due to selective death of NM containing cells.3,4 A few MRI protocols have been developed for visualizing NM, referred as NM-sensitive MRI or NM-MRI5,6,7 providing valuable information to discriminate between healthy control and PD patients. However, majority of NM-MRI approaches require 5~10min of scan time which is sub-optimal for scanning PD patient with movement disorders. Recently, SandwichNM8 was proposed which reduced scan time to total 5m 30s by averaging two low SNR scanning of 2m45s but it is still may not enough.In this research, we approach this issue in the viewpoint of image post processing with denoising techniques to shorten scan time. We acquired NM-MRI images with half of the scan time to that of original protocol, and applied denoising techniques to increase SNR. Also, we demonstrated that using denoising technique can also improve NM segmentation using deep learning.
METHOD
[NM-MRI Dataset]For implementation of deep learning-based denoising techniques, the NM-MRI dataset consisting of pairs of low SNR image and high SNR images were utilized. The dataset contains 3D gradient-recalled echo (GRE) data acquired form 81 subjects in the 3T Siemens skyra scanner with following scan parameters: TR=30ms, TE=3.2ms, FA=14°, resolution=0.8×0.8×1.2 mm3, FOV=176×256×38 mm3, TA=2m 44s.
For each subject, scan was performed twice without position movement. High SNR SandwichNM images were generated by averaging the two acquired images (low SNR images). These pairs of low SNR image and high SNR averaged image were used for training and evaluation of deep learning. Out of 162 pairs, images with misalignment or severe artifacts were filtered out, leaving 150 pairs. Then, the dataset was divided into 132, 14, and 14 for train, validation, and test dataset, respectively.
For training the denoising network, 3D-images in the training and validation dataset were divided into each 2D-slices and each slice was cropped into patches with size 32×32. Also, the training dataset was augmented with flipping and rotation, 67,800 patches that didn’t or scarcely contain information were eliminated, finally generating a total of 83,400 patches.
[Denoising]
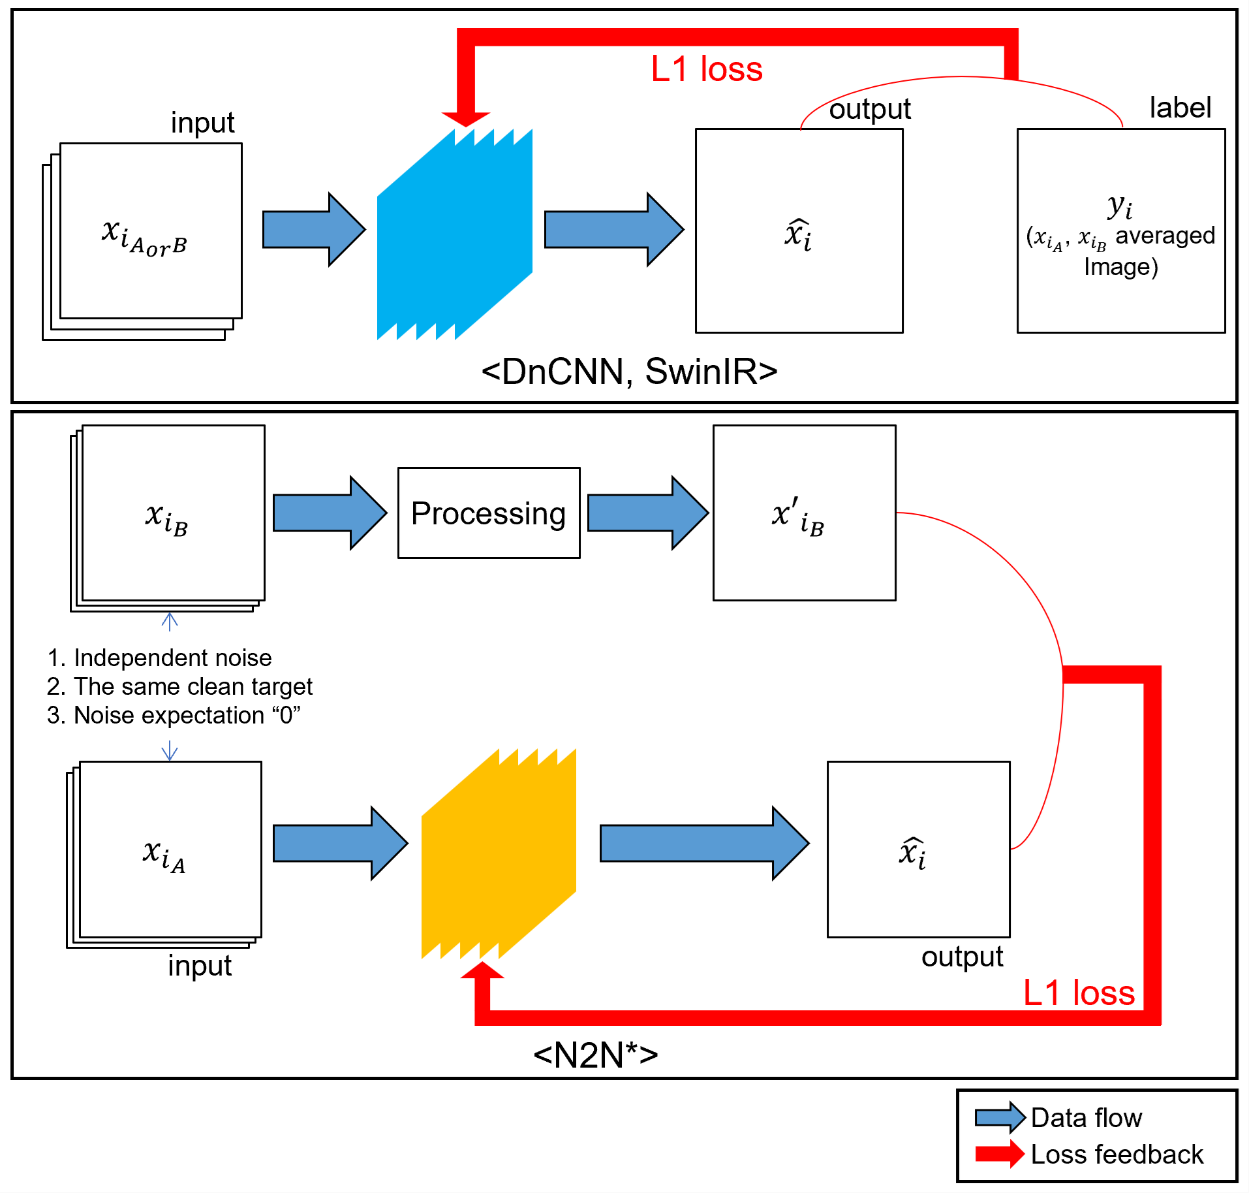
As deep learning-based denoising techniques, we applied DnCNN9, SwinIR10 and Noise2Noise (N2N)11 approaches. For training of DnCNN and SwinIR, pairs of low SNR image and high SNR image were used as input and label pair. On the other hand, the training of N2N requires two low SNR image as input and label pair while meeting following conditions. The paired images have (1) the same clean target, (2) each image contains independent noise, and this (3) noise has zero mean. In our dataset, two images were obtained using the same sequence without position movement, hence the paired data have the same clean target, (2) and (3) are supposed to be satisfied from independent scanning. Motivated by Coil2Coil12, we modified N2N network to our data which is described in Figure 1, which is referred to as N2N* hereafter. After 30 epochs of training, we took the best results based on SSIM and PSNR.
[Segmentation]
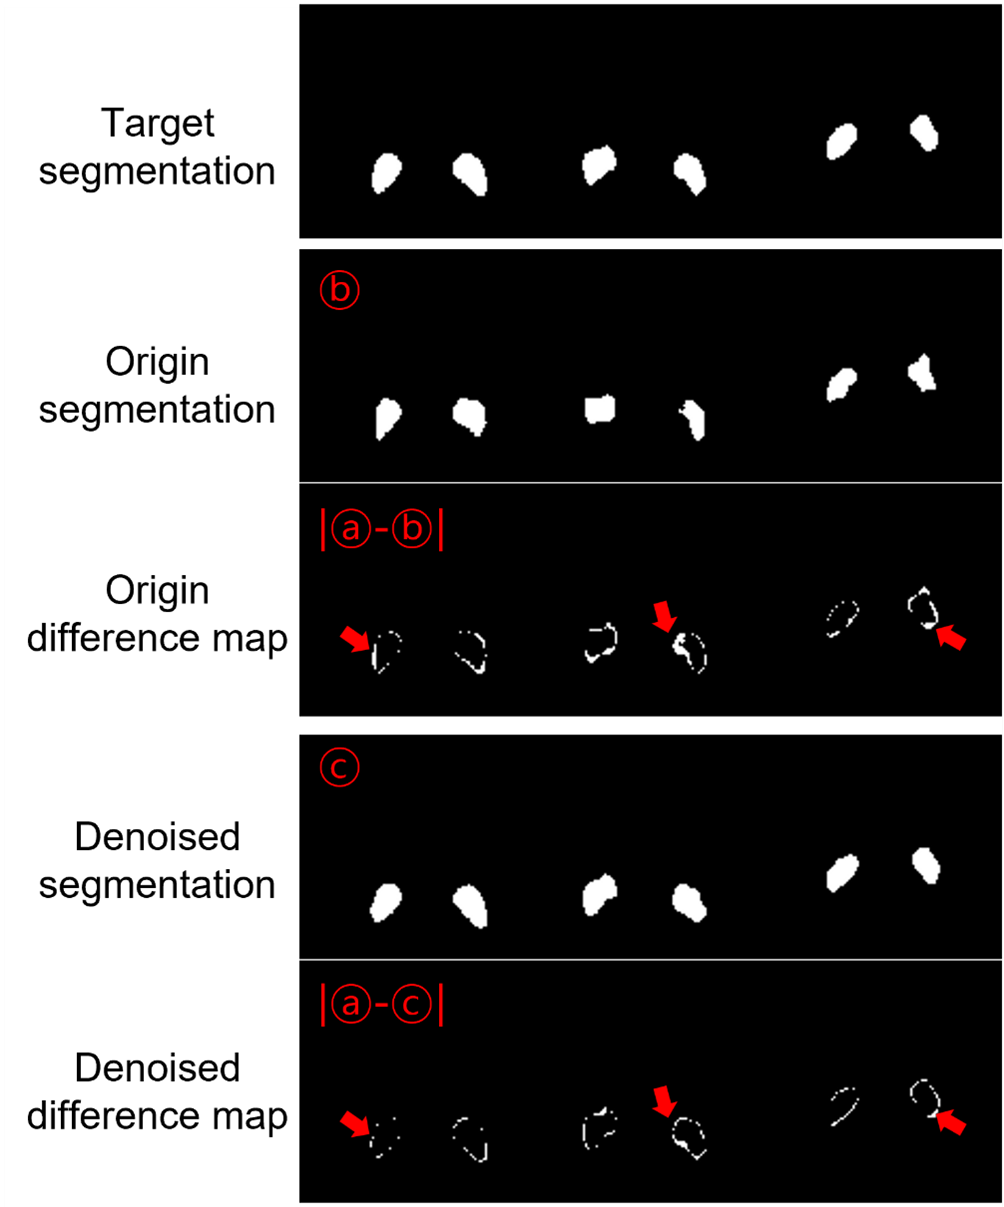
For segmentation, we applied SwinUNETR13 which had been trained with 196 NM-MRI data with semi-automatic labeling. In the test dataset, NM segmentation was performed in 3 slices for each subject that contained the most of NM area. Finally, a total of 42 slices were chosen for evaluating segmentation performance. Also, each slice was cropped to have 110×110 so that the network can attention on NM existing region. For quantitative analysis of segmentation performance, the images were tightly cropped around NM, resulting in two patches of size 15×15. Intersection over union, pixel accuracy and the number of different pixels from target mask were analyzed. For qualitative analysis, we visualized the shape of NM mask and difference map from target mask.
RESULTS
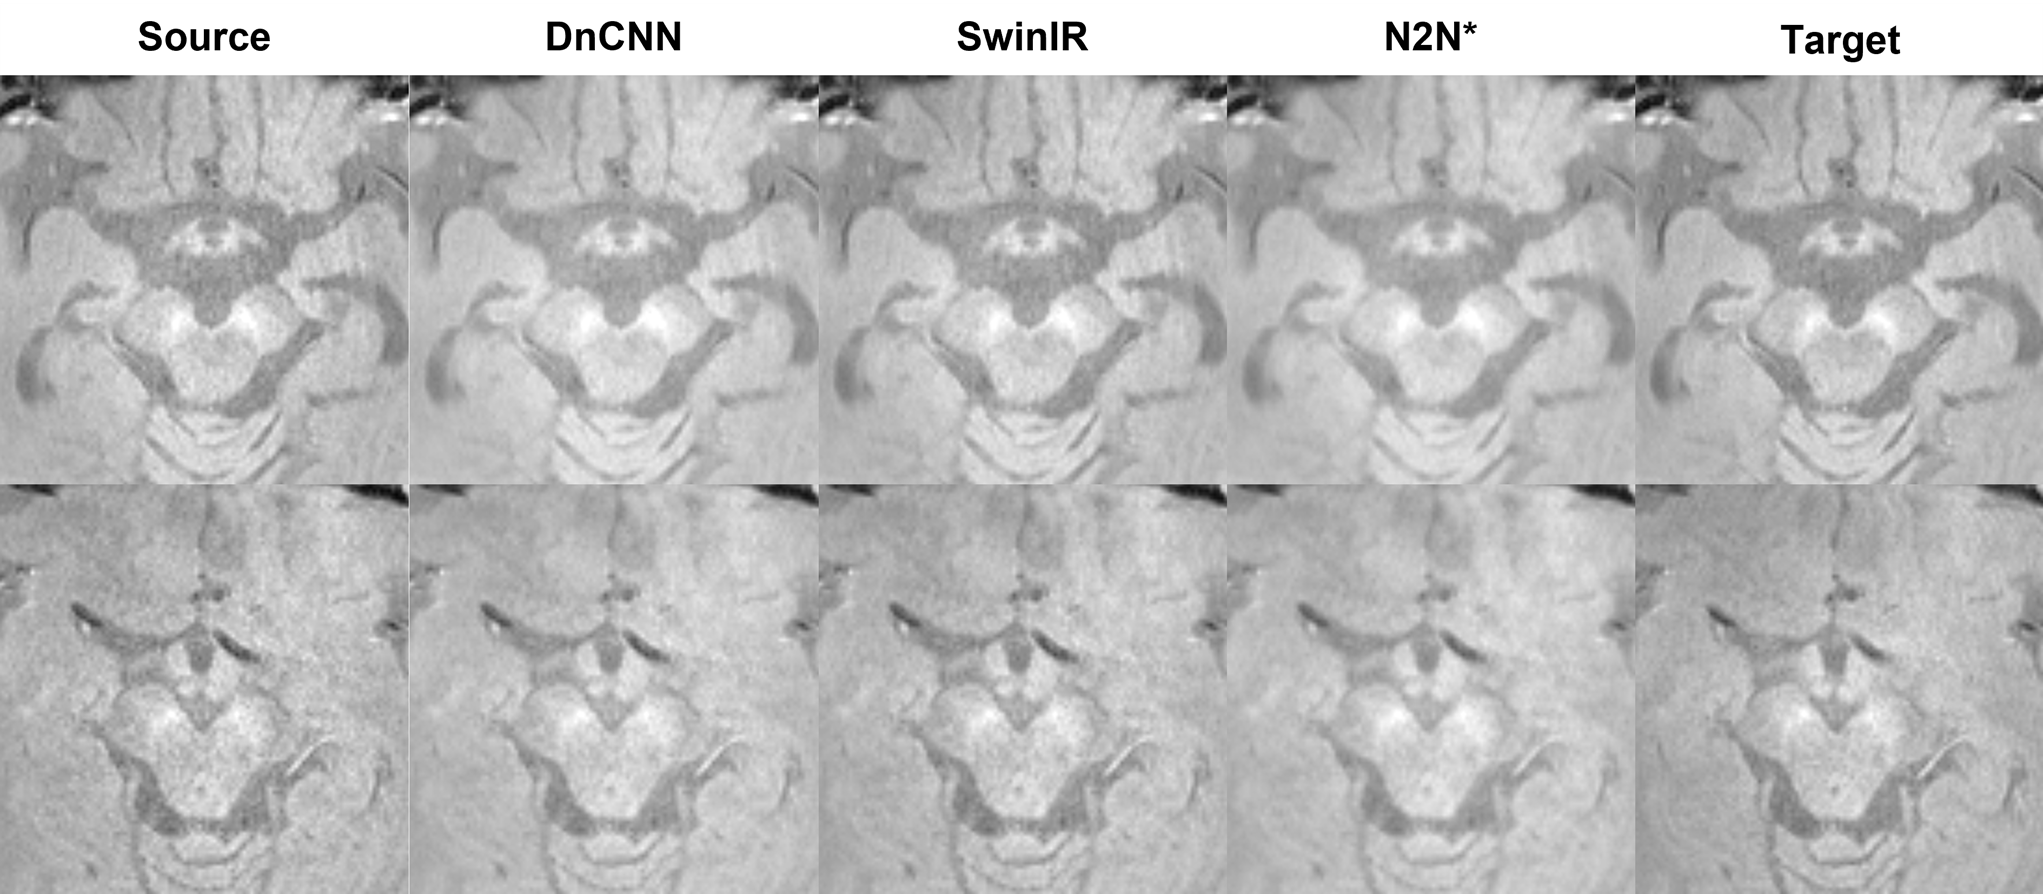
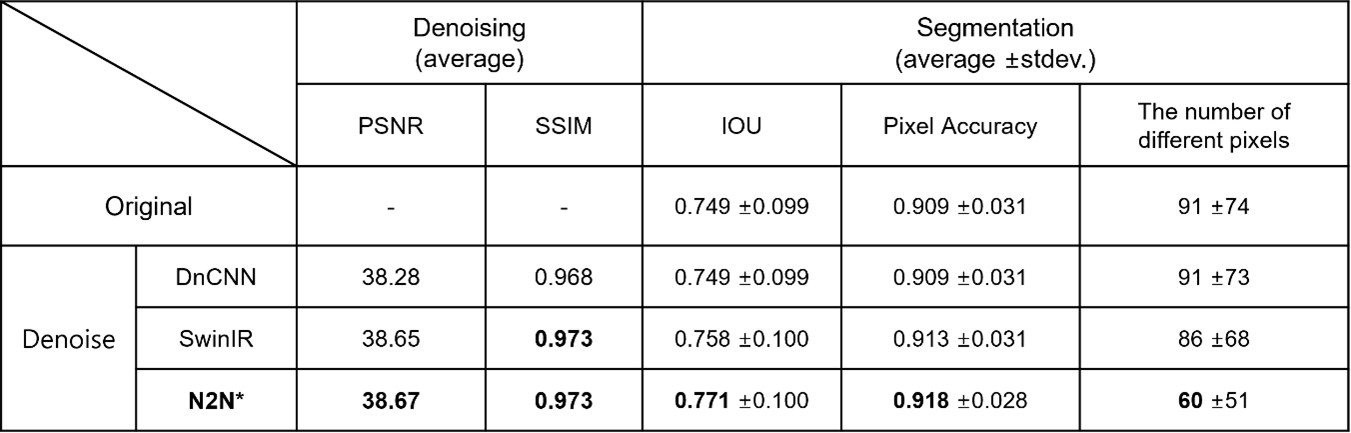
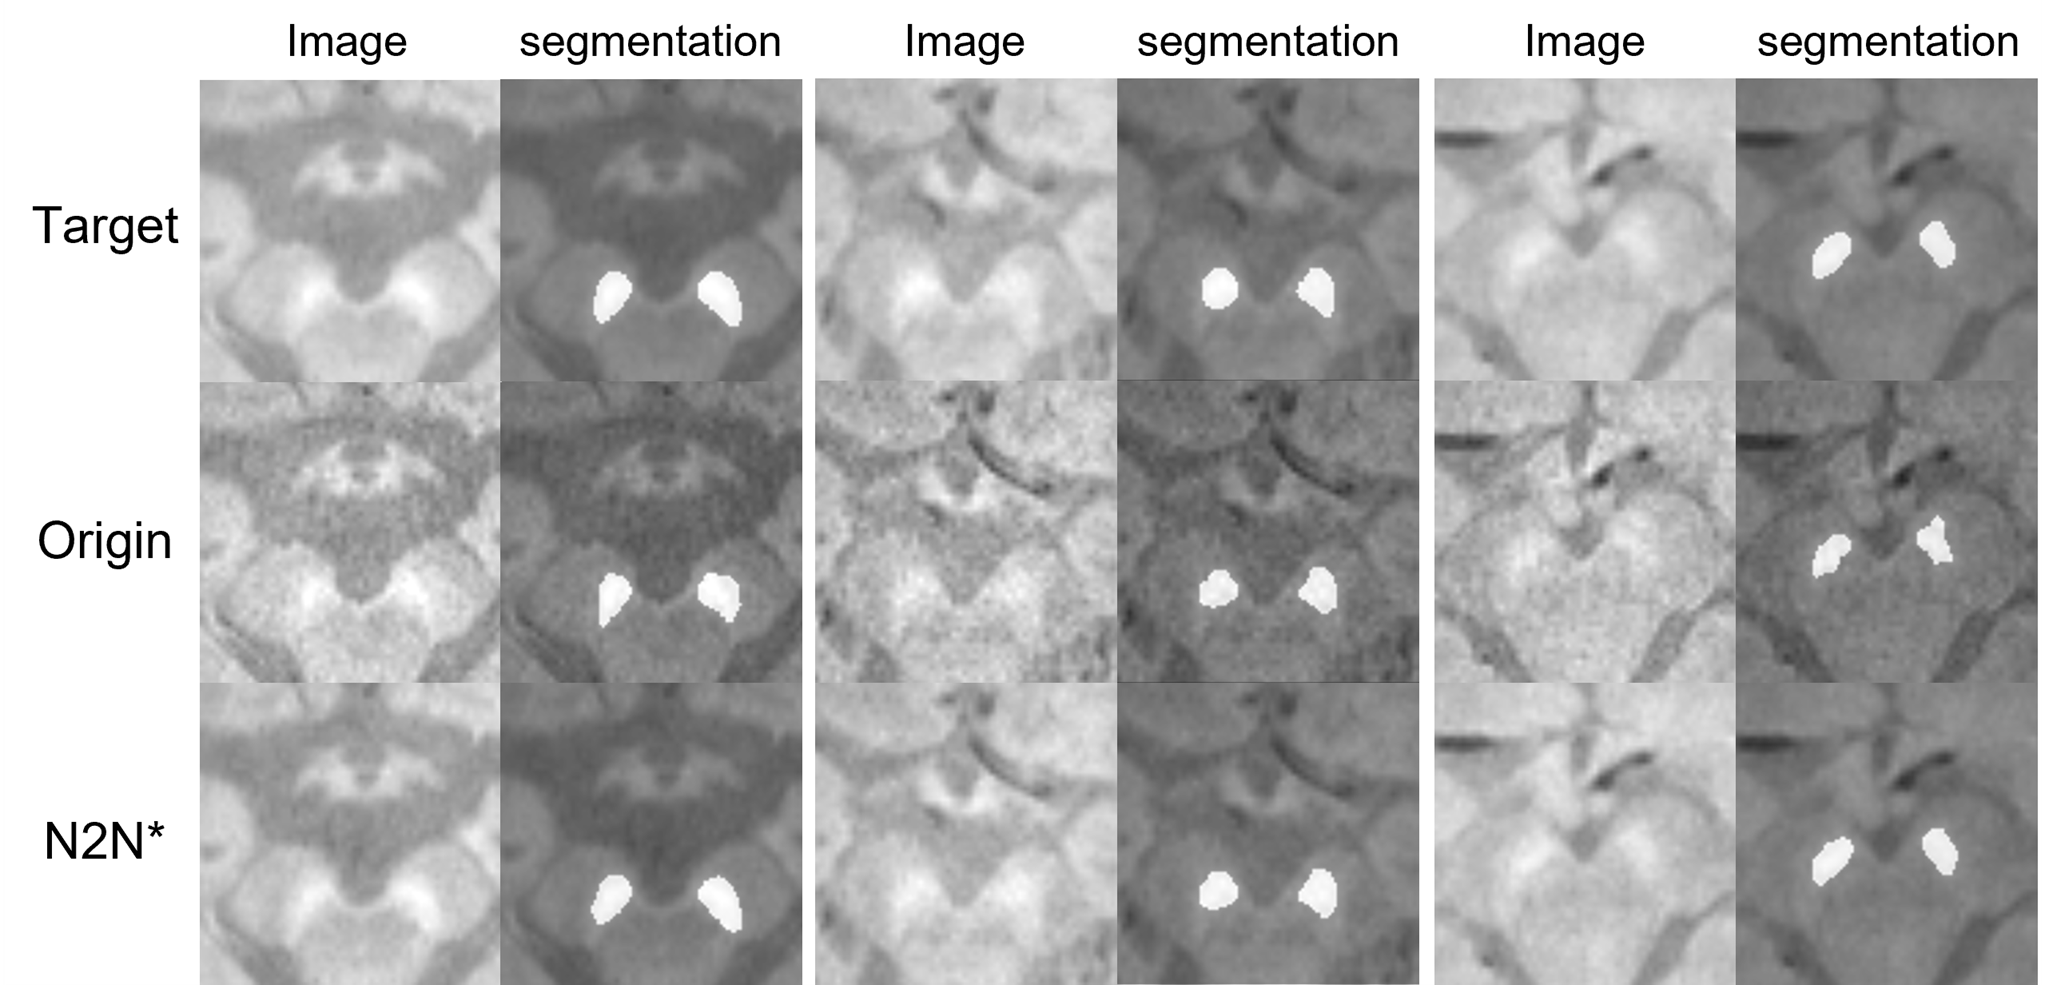
A total of 162 NM-MRI images are acquired and denoising algorithms are tested for NM segmentation. After testing 3 different algorithms (Figure 2), we got the best as 0.9728 SSIM with N2N*. With the denoised images, we got better quantitative results in segmentation with IOU and pixel accuracy comparison. Especially, the results showed up to about 34% reduction in terms of the number of different pixels. (Figure 3). In qualitative comparisons (Figure 4 and 5), difference maps of segmentation masks show that the denoised results have less differences in not only the number of different pixels and but also in the shape of segmentation mask.DISCUSSION & CONCLUSION
In this study, we applied denoising techniques to reduce scan time for NM diagnosis. We trained and tested with 3 different denoising algorithms and we got the best results with N2N*. Furthermore, N2N* approach shows the best segmentation performance with both quantitative and qualitative comparisons. These results shows that denoising techniques can improve quality of short scan time MRI images and can be utilized as a promising tool for reducing scan time for PD patient NM diagnosis.Acknowledgements
This work was supported by Creative-Pioneering Researchers Program through Seoul National University(SNU) and Heuron. Co. Ltd.References
1. G. Aston-Jones, J.D. Cohen, Adaptive gain and the role of the locus coeruleus-norepinephrine system in optimal performance, J Comp Neurol, 493 (2005), pp. 99-110
2. M. Jahanshahi, C.R. Jones, G. Dirnberger, C.D. Frith, The substantia nigra pars compacta and temporal processing, J Neurosci, 26 (2006), pp. 12266-12273
3. J.G. Greenfield, F.D. Bosanquet, The brain-stem lesions in parkinsonism, J. Neurol. Neurosurg. Psychiatry, 16 (1953), pp. 213-226, 10.1136/jnnp.16.4.213
4. G.M. Halliday, J.B. Leverenz, J.S. Schneider, C.H. Adler, The neurobiological basis of cognitive impairment in Parkinson's disease, Mov. Disord., 29 (2014), pp. 634-650, 10.1002/mds.25857
5. M. Sasaki, E. Shibata, K. Tohyama, J. Takahashi, K. Otsuka, K. Tsuchiya, S. Takahashi, S. Ehara, Y. Terayama, A. Sakai, Neuromelanin magnetic resonance imaging of locus ceruleus and substantia nigra in Parkinson's disease, Neuroreport, 17 (2006), pp. 1215-1218, 10.1097/01.wnr.0000227984.84927.a7
6. X. Chen, D.E. Huddleston, J. Langley, S. Ahn, C.J. Barnum, S.A. Factor, A.I. Levey, X. Hu, Simultaneous imaging of locus coeruleus and substantia nigra with a quantitative neuromelanin MRI approach, Magn. Reson. Imaging, 32 (2014), pp. 1301-1306, 10.1016/j.mri.2014.07.003
7. C.M. Cassidy, F.A. Zucca, R.R. Girgis, S.C. Baker, J.J. Weinstein, M.E. Sharp, C. Bellei, A. Valmadre, N. Vanegas, L.S. Kegeles, G. Brucato, U.J. Kang, D. Sulzer, L. Zecca, A. Abi-Dargham, G. Horga, Neuromelanin-sensitive MRI as a noninvasive proxy measure of dopamine function in the human brain, Proc. Natl. Acad. Sci., 116 (2019), Article 201807983, 10.1073/pnas.1807983116
8. Ji, Sooyeon, et al. "Sandwich spatial saturation for neuromelanin-sensitive MRI: development and multi-center trial." NeuroImage (2022): 119706.
9. Zhang, Kai, et al. "Beyond a gaussian denoiser: Residual learning of deep cnn for image denoising." IEEE transactions on image processing 26.7 (2017): 3142-3155.
10. Liang, Jingyun, et al. "Swinir: Image restoration using swin transformer." Proceedings of the IEEE/CVF International Conference on Computer Vision. 2021.
11. Lehtinen, Jaakko, et al. "Noise2Noise: Learning image restoration without clean data." arXiv preprint arXiv:1803.04189 (2018).
12. Park, Juhyung, et al. "Coil2Coil: Self-supervised MR image denoising using phased-array coil images." arXiv preprint arXiv:2208.07552 (2022).
13. Hatamizadeh,
Ali, et al. "Swin unetr: Swin transformers for semantic segmentation of
brain tumors in mri images." International MICCAI Brainlesion Workshop.
Springer, Cham, 2022.
Figures