4513
Impact of Label-Set on the Performance of Deep Learning-Based Segmentation of the Prostate Gland and Zones on T2-Weighted MR Images
Jakob Meglič1,2, Mohammed R. S. Sunoqrot1,3, Tone F. Bathen1,3, and Mattijs Elschot1,3
1Department of Circulation and Medical Imaging, Norwegian University of Science and Technology (NTNU), Trondheim, Norway, 2Faculty of Medicine, University of Ljubljana, Ljubljana, Slovenia, 3Department of Radiology and Nuclear Medicine, St. Olavs Hospital, Trondheim University Hospital, Trondheim, Norway
1Department of Circulation and Medical Imaging, Norwegian University of Science and Technology (NTNU), Trondheim, Norway, 2Faculty of Medicine, University of Ljubljana, Ljubljana, Slovenia, 3Department of Radiology and Nuclear Medicine, St. Olavs Hospital, Trondheim University Hospital, Trondheim, Norway
Synopsis
Keywords: Machine Learning/Artificial Intelligence, Prostate
Prostate segmentation is an essential step in computer-aided diagnosis systems for prostate cancer. Deep learning (DL)-based methods provide good performance for prostate segmentation, but little is known about the impact of ground truth (manual segmentation) selection. In this work, we investigated these effects and concluded that selecting different segmentation labels for the prostate gland and zones has a measurable impact on the segmentation model performance.INTRODUCTION
Region-of-interest segmentation is a crucial step in computer-aided detection and diagnosis systems (CAD) for prostate cancer (PCa)1. Deep learning (DL)-based methods have shown good performance for prostate segmentation on MRI2. Recently, several CAD systems have been developed for PCa and promising results are reported in literature3,4. In addition, several commercial prostate gland and zone segmentation products are currently available5. However, most of these models have been trained with low variability in datasets (images and manual - ground truth - segmentations mainly from a single institution).It is known that manual segmentation of the prostate gland suffers from inter-reader variability6. Nevertheless, many of the published segmentation methods refer to the need for a larger, multi-institutional image dataset and rarely refer to the impact of manual segmentation (i.e., label) selection on the performance of their models3,4. Therefore, in this study, we aimed to investigate the impact of label selection on the performance of DL-based prostate segmentation models.
METHODS
DatasetsIn this study we used T2-weighted (T2W) MR images from two datasets: the publicly available PROSTATEx I training dataset7 (n=204; 6 cases were excluded due to segmentations mismatching), and an In-house collected multiparametric 3T MRI dataset (n=233), reported in 8.
Segmentations
Manual segmentation of the in-house collected dataset was performed using ITK-SNAP9 by a radiology resident at St. Olavs Hospital, Trondheim, Norway. For the PROSTATEx dataset, there were two sets of manual segmentation:
- Set A: which was performed by imaging experts with a combined experience of more than 25 years in prostate imaging and reviewed by radiation oncologists at Miller School of Medicine, Miami, USA.
- Set B: which was made publicly available by 10.
Automatic segmentation of the whole prostate gland (WP) and zones (peripheral [PZ] and transition [TZ]) was performed using a full-resolution 3D nnU-Net model with a 5-fold averaging strategy11. nnU-Net (v. 1.7.0) was implemented with PyTorch (v. 1.11.0) using Python(v. 3.9.12) on a single NVIDIA GeForce RTX 2070 Super GPU with 8 GB VRAM. In this study, 3 models were developed:
- Model A: Trained with PROSTATEx images and Set A labels and tested on the in-house dataset.
- Model B: Trained with PROSTATEx images and Set B labels and tested on the in-house dataset.
- Model C: Trained with the in-house images and labels and tested on PROSTATEx images.
Experiment
The study aimed to investigate the impact of label selection on the performance of DL-based prostate segmentation models. Therefore, we performed three comparisons: The first was to measure the similarity between the manual segmentations of Set A and Set B; the second was to compare the derived masks when testing Model A and Model B with the labels of the In-house dataset; and the third was to measure the similarity of the derived masks when testing Model C with the labels of Set A and Set B, separately.
Statistical analysis
The Dice similarity coefficient (DSC)12 and the 95th percentile of the Hausdorff Distance (HD95)13 between manual and DL-based segmentations were calculated as metrics for segmentation performance. The Wilcoxon signed rank test, followed by the Bonferroni correction for multiple testing, was used to assess differences.
RESULTS
Comparison of the similarity of the manually segmented Set A and Set B yields a DSC of 0.891, 0.703, and 0.847, and an HD95 of 7.41, 10.55, and 9.00 mm for WP, PZ, and TZ, respectively. The results of the comparison of the derived masks of Model A and Model B are shown in Figure 1, while the results of the comparison of the derived masks of Model C with Set A and Set B are shown in Figure 2.DISCUSSION
The similarity between the manual segmentations is comparable to the performance reported by several DL-based prostate gland and zones segmentation methods2. Our experiments show that the selection of both training and test labels has a significant impact on model performance. This implies that model performance should always be evaluated in the context of the ground truth for training and testing, and that models trained and/or tested with different label sets cannot be directly compared.One of our study limitations is that it uses a single DL-based segmentation model architecture. Therefore, our conclusions cannot yet be generalized to DL-based segmentation models other than the nnU-Net model.
CONCLUSION
We investigated the impact of label selection on the performance of a DL-based prostate segmentation model. Results show that the use of different sets of manual prostate gland and zones segmentation has a measurable impact on model performance. More thought should be given to the label-set, with a focus on multi-centre manual segmentation and agreement on common procedures.Acknowledgements
We would like to thank Prof. Radka Stoyanova from University of Miami for providing us with the manual segmentation masks of PROSTATEx. In addition we would like to thank Dr. Renato Cuocolo and his colleagues for making their segmentations for PROSTATEx publicly available.References
- Litjens, G., Debats, O., Barentsz, J., Karssemeijer, N. & Huisman, H. Computer-Aided Detection of Prostate Cancer inMRI. Ieee T Med Imaging 33, 1083-1092, doi:10.1109/Tmi.2014.2303821 (2014).
- Khan, Z., Yahya, N., Alsaih, K., Al-Hiyali, M. I. & Meriaudeau, F. Recent Automatic Segmentation Algorithms of MRI Prostate Regions: A Review. Ieee Access 9, 97878-97905, doi:10.1109/Access.2021.3090825 (2021).
- Li, H. Y. et al. Machine Learning in Prostate MRI for Prostate Cancer: Current Status and Future Opportunities. Diagnostics 12, doi:ARTN 289 10.3390/diagnostics12020289 (2022).
- Twilt, J. J., van Leeuwen, K. G., Huisman, H. J., Futterer, J. J. & de Rooij, M. Artificial Intelligence Based Algorithms for Prostate Cancer Classification and Detection on Magnetic Resonance Imaging: A Narrative Review. Diagnostics (Basel) 11, doi:10.3390/diagnostics11060959 (2021).
- Sunoqrot, M. R. S., Saha, A., Hosseinzadeh, M., Elschot, M. & Huisman, H. Artificial intelligence for prostate MRI: open datasets, available applications, and grand challenges. Eur Radiol Exp 6, 35, doi:10.1186/s41747-022-00288-8 (2022).
- Becker, A.S. et al. Variability of manual segmentation of the prostate in axial T2-weighted MRI: A multi-reader study. Eur J Radiol 121, 108716, doi:10.1016/j.ejrad.2019.108716 (2019).
- Armato, S. G., 3rd et al. PROSTATEx Challenges for computerized classification of prostate lesions from multiparametric magnetic resonance images. J Med Imaging (Bellingham) 5, 044501, doi:10.1117/1.JMI.5.4.044501 (2018).
- Sunoqrot, M. R. S. et al. The Reproducibility of Deep Learning-Based Segmentation of the Prostate Gland and Zones on T2-Weighted MR Images. Diagnostics (Basel) 11, doi:10.3390/diagnostics11091690 (2021).
- Yushkevich, P. A. et al. User-guided 3D active contour segmentation of anatomical structures: Significantly improved efficiency and reliability. Neuroimage 31, 1116-1128, doi:10.1016/j.neuroimage.2006.01.015 (2006).
- Cuocolo, R., Stanzione, A., Castaldo, A., De Lucia, D. R. & Imbriaco, M. Quality control and whole-gland, zonal and lesion annotations for the PROSTATEx challenge public dataset. Eur J Radiol 138, 109647, doi:10.1016/j.ejrad.2021.109647 (2021).
- Isensee, F., Jaeger, P. F., Kohl, S. A. A., Petersen, J. & Maier-Hein, K. H. nnU-Net: a self-configuring method for deep learning-based biomedical image segmentation. Nat Methods 18, 203-211, doi:10.1038/s41592-020-01008-z (2021).
- Klein, S. et al. Automatic segmentation of the prostate in 3D MR images by atlas matching using localized mutual information. Med Phys 35, 1407-1417, doi:10.1118/1.2842076 (2008).
- Chandra, S. S. et al. Patient specific prostate segmentation in 3-d magnetic resonance images. IEEE Trans Med Imaging 31, 1955-1964, doi:10.1109/TMI.2012.2211377 (2012).
Figures
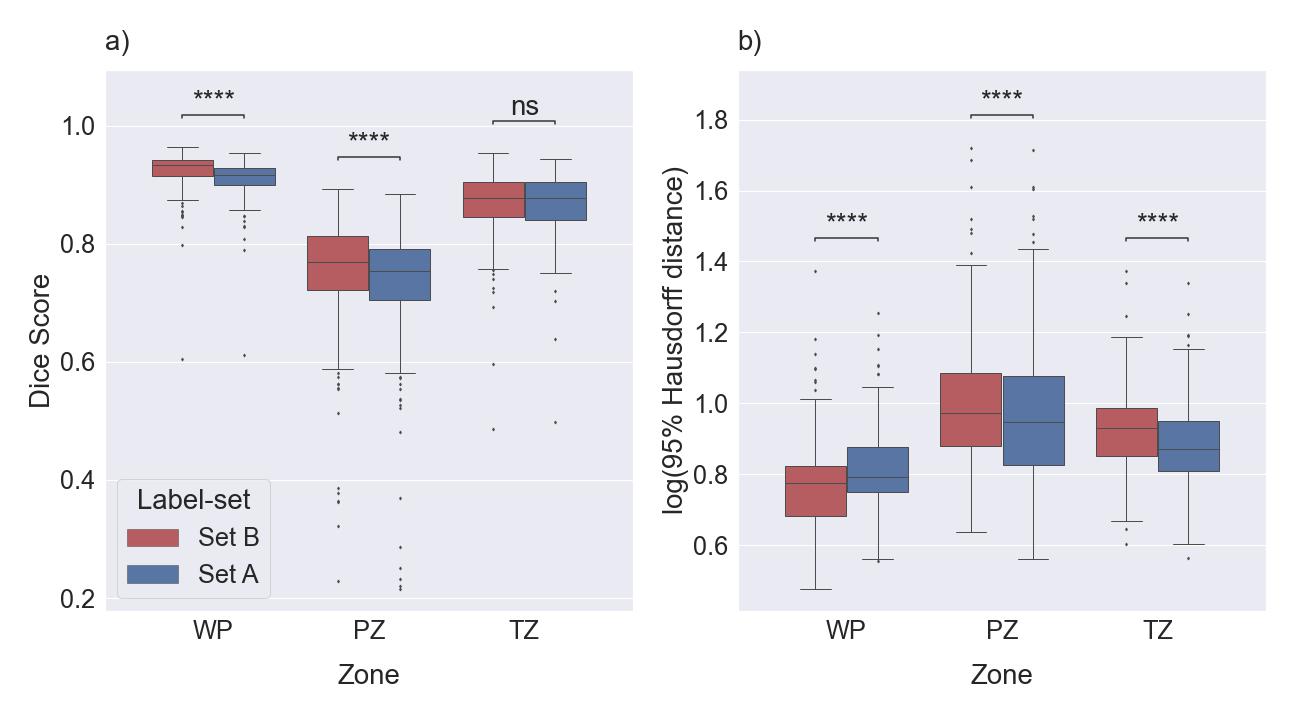
Figure 1: Boxplots for
DSC (a) and HD95 (b) comparing the performance of Model A and Model B on a test
set (the in-house dataset). The medians of DSC and HD95 for whole prostate [WP],
peripheral zone [PZ], and transition zone [TZ] were 0.916, 0.754, and 0.878,
and 6.18, 8.88, and 7.44 mm for Set A, respectively. The median of DSC and HD95
for WP, PZ, and TZ were 0.933, 0.769, and 0.877 and 5.97, 9.41, and 9.50 mm,
respectively, for Set B. ns: p≥0.05, ****p<0.0001.
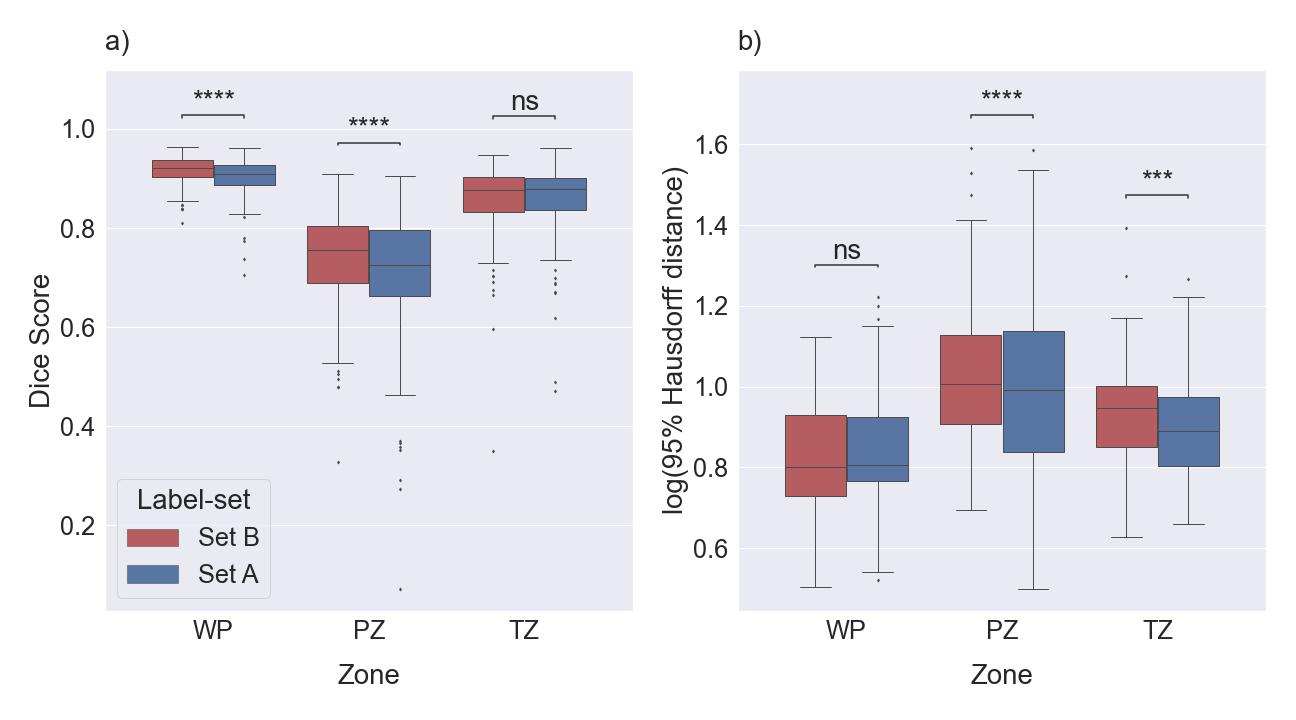
Figure 2: Boxplots for
DSC (a) and HD95 (b) comparing similarity between the masks of the PROSTATEx
dataset derived with Model C with Set A and Set B, separately. The median of
DSC and HD95 for whole prostate [WP], peripheral zone [PZ], and transition zone
[TZ] were 0.908, 0.726, and 0.879, and 6.40, 9.80, and 7.78 mm, respectively, compared
with Set A. The medians of DSC and HD95 for WP, PZ, and TZ were 0.922, 0.755,
and 0.878, and 6.34, 10.16, and 8.86 mm, respectively, compared with Set B. ns:
p≥0.05, ***p<0.001, ****p<0.0001.
DOI: https://doi.org/10.58530/2023/4513