4507
Repeatability of pulmonary 129Xe static spectroscopy and dynamic spectroscopy fit methods: a reader study1Radiology, Duke University, Durham, NC, United States, 2Medical Physics, Duke University, Durham, NC, United States, 3Biomedical Engineering, Duke University, Durham, NC, United States
Synopsis
Keywords: Hyperpolarized MR (Gas), Heart, Lung
129Xe MRS measures static and dynamic spectral parameters from 129Xe signal in airspaces, membrane tissues, and red blood cells (RBC) and has the potential to characterize cardiopulmonary diseases. However, a better understanding of measurement repeatability is needed, and different approaches to quantifying cardiogenic oscillations have been proposed. Here, we compare quantification of oscillations using sine-fitting and a peak-finding algorithm and use reader ratings to identify acceptable study quality. Across a range of cardiopulmonary disease groups, measurements of static parameters showed good intra-session repeatability while the peak-finding algorithm generally yielded higher repeatability than sine fits for most dynamic parameters.Introduction
Static 129Xe MR spectroscopy provides a means to quantify spectral parameters of signals from hyperpolarized 129Xe in airspaces, membrane tissues (M), and red blood cells (RBCs). The resulting RBC/M ratio and RBC chemical shift represent markers of gas exchange efficiency and blood oxygenation, respectively1,2. Dynamic 129Xe MRS can be used to quantify cardiogenic oscillations in RBC spectral parameters and has the potential to detect and characterize cardiopulmonary diseases. RBC signal amplitude oscillations have been used to differentiate pre- and post-capillary pulmonary hypertension3. To date, dynamic oscillations have been quantified by peak-to-peak amplitudes as determined by sine fits2,3. However, in cases with asymmetric oscillation peaks, the sine function may underestimate oscillation amplitudes. Here, we present an alternative peak-finding algorithm and use reader ratings to identify acceptable data quality. We then compare the methods to assess repeatability of both static and dynamic parameters.Methods
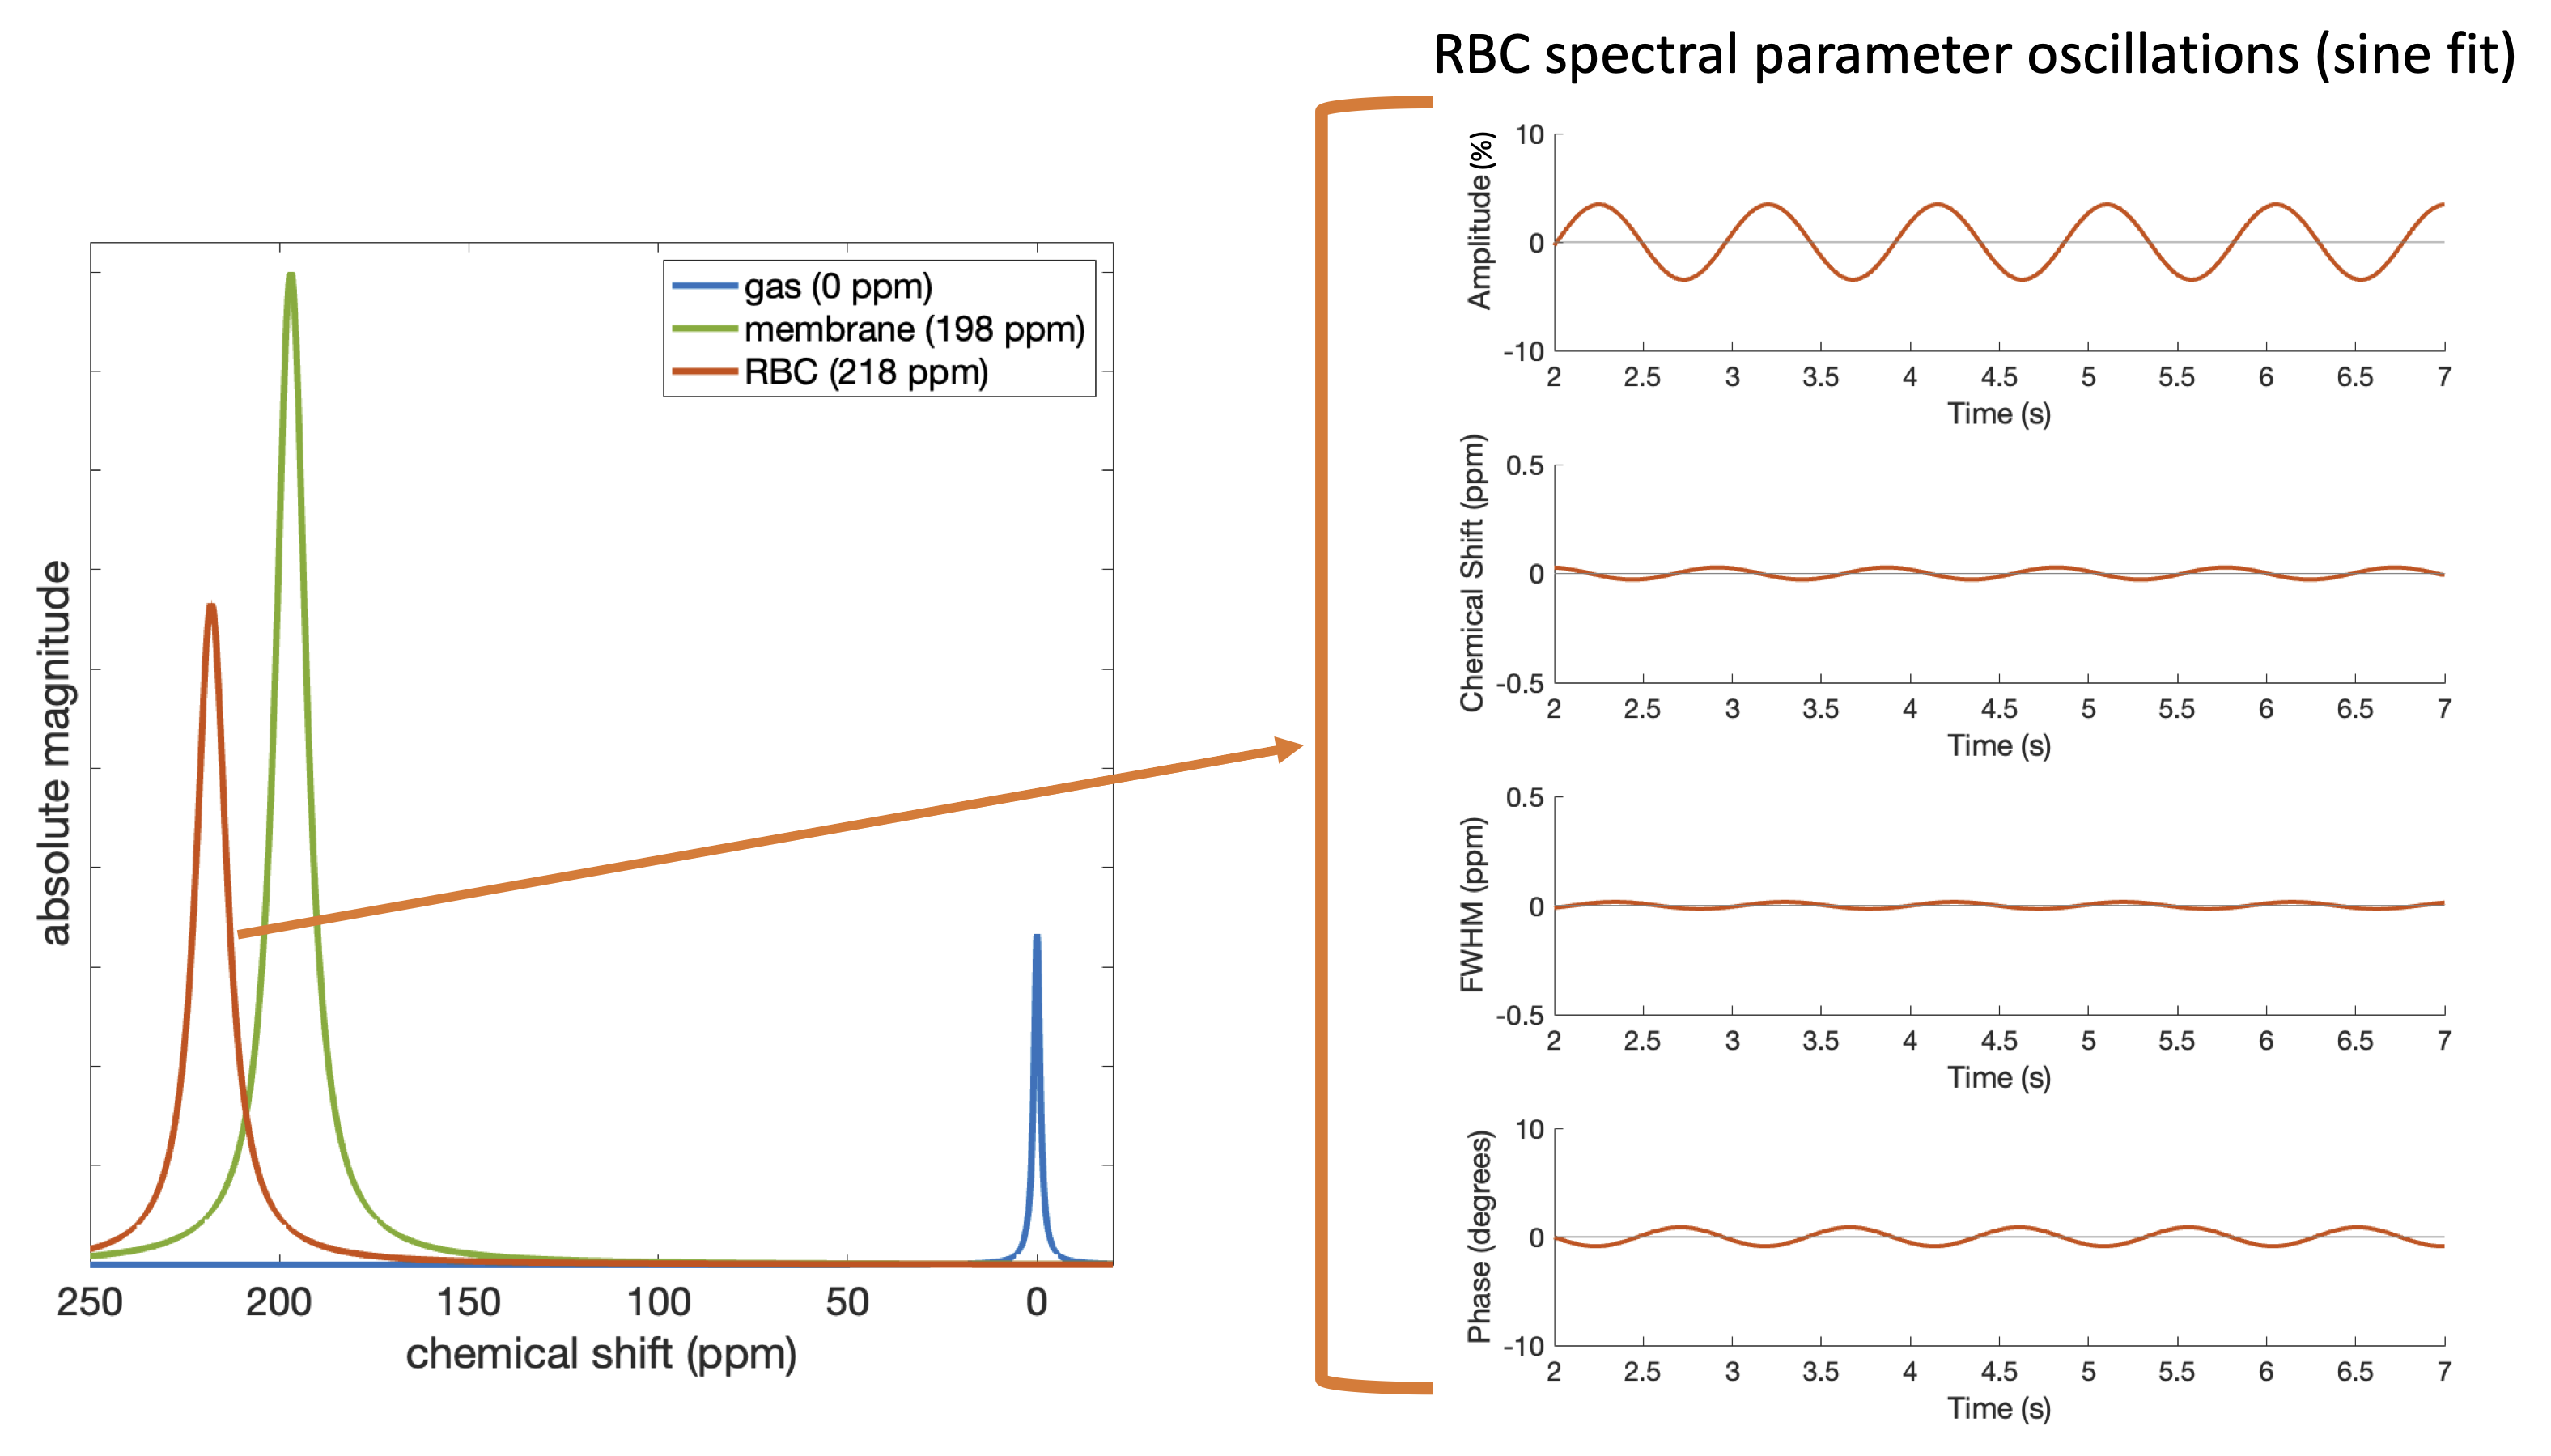
176 129Xe spectroscopy studies were conducted on 155 subjects with a range of cardiopulmonary disorders. Each study consisted of two dynamic MRS scans to assess intra-session repeatability acquired according to previously described protocols (500 spectra, TR=15ms, α=20˚)2,4. These were used to calculate the static parameters (RBC/M and chemical shift, width, and phase of the RBC and membrane peaks) over a 1-sec average and the peak-to-peak amplitudes of dynamic oscillations in RBC signal amplitude, chemical shift, spectral width (FWHM), and phase over a 5-sec period. Dynamic parameters were calculated using both sine fitting and a peak-finding algorithm. The latter determined one peak and trough per period of the cardiac cycle, as determined by the prior sine fits. Figure 1 illustrates typical static spectral fits to the gas, membrane, and RBC peaks as well as sinusoidal fits to oscillation parameters.The character of signal and fits can vary for different parameters within a single dynamic MRS scan, making it difficult to quantify overall quality. This was addressed by expert readers, who evaluated each of the 352 scans and provided separate scores for the static and dynamic aspects of the study. Scoring used a scale of 1-5 (1=unusable, 5=perfect) and dynamic MRS were scored for both the sine fitting and peak-finding methods. Three readers scored the static and sine methods and four scored the peak-finding method. Readers were asked to base their dynamic ratings on a combination of the quality of static spectral fits, dynamic and static SNR, reasonability of the heart rate, and quality of the dynamic oscillation fits. The order of scans was randomized for all readers. Scan pairs were excluded if one of the two scans had an average rating less than three, leaving 168 static pairs, 133 sine pairs, and 123 peak-finding pairs remaining. Repeated measurements were visualized using Bland-Altman plots and repeatability was quantified using the coefficient of variation (CV), coefficient of repeatability (CR), and intraclass correlation coefficient (ICC), defined as: $$CV=\frac{SD(scan_1 - scan_2)}{mean(scan_1 - scan_2)}$$ $$CR=1.96 \times SD(scan_1 - scan_2)$$ $$ICC=\frac{MSBS - MSWS}{MSBS + (k - 1)MSWS}$$ where $$$MSBS$$$ is the mean-square between subjects, $$$MSWS$$$ is the mean-square within subjects, and $$$k$$$ is the number of repeated scans per subject.
Results
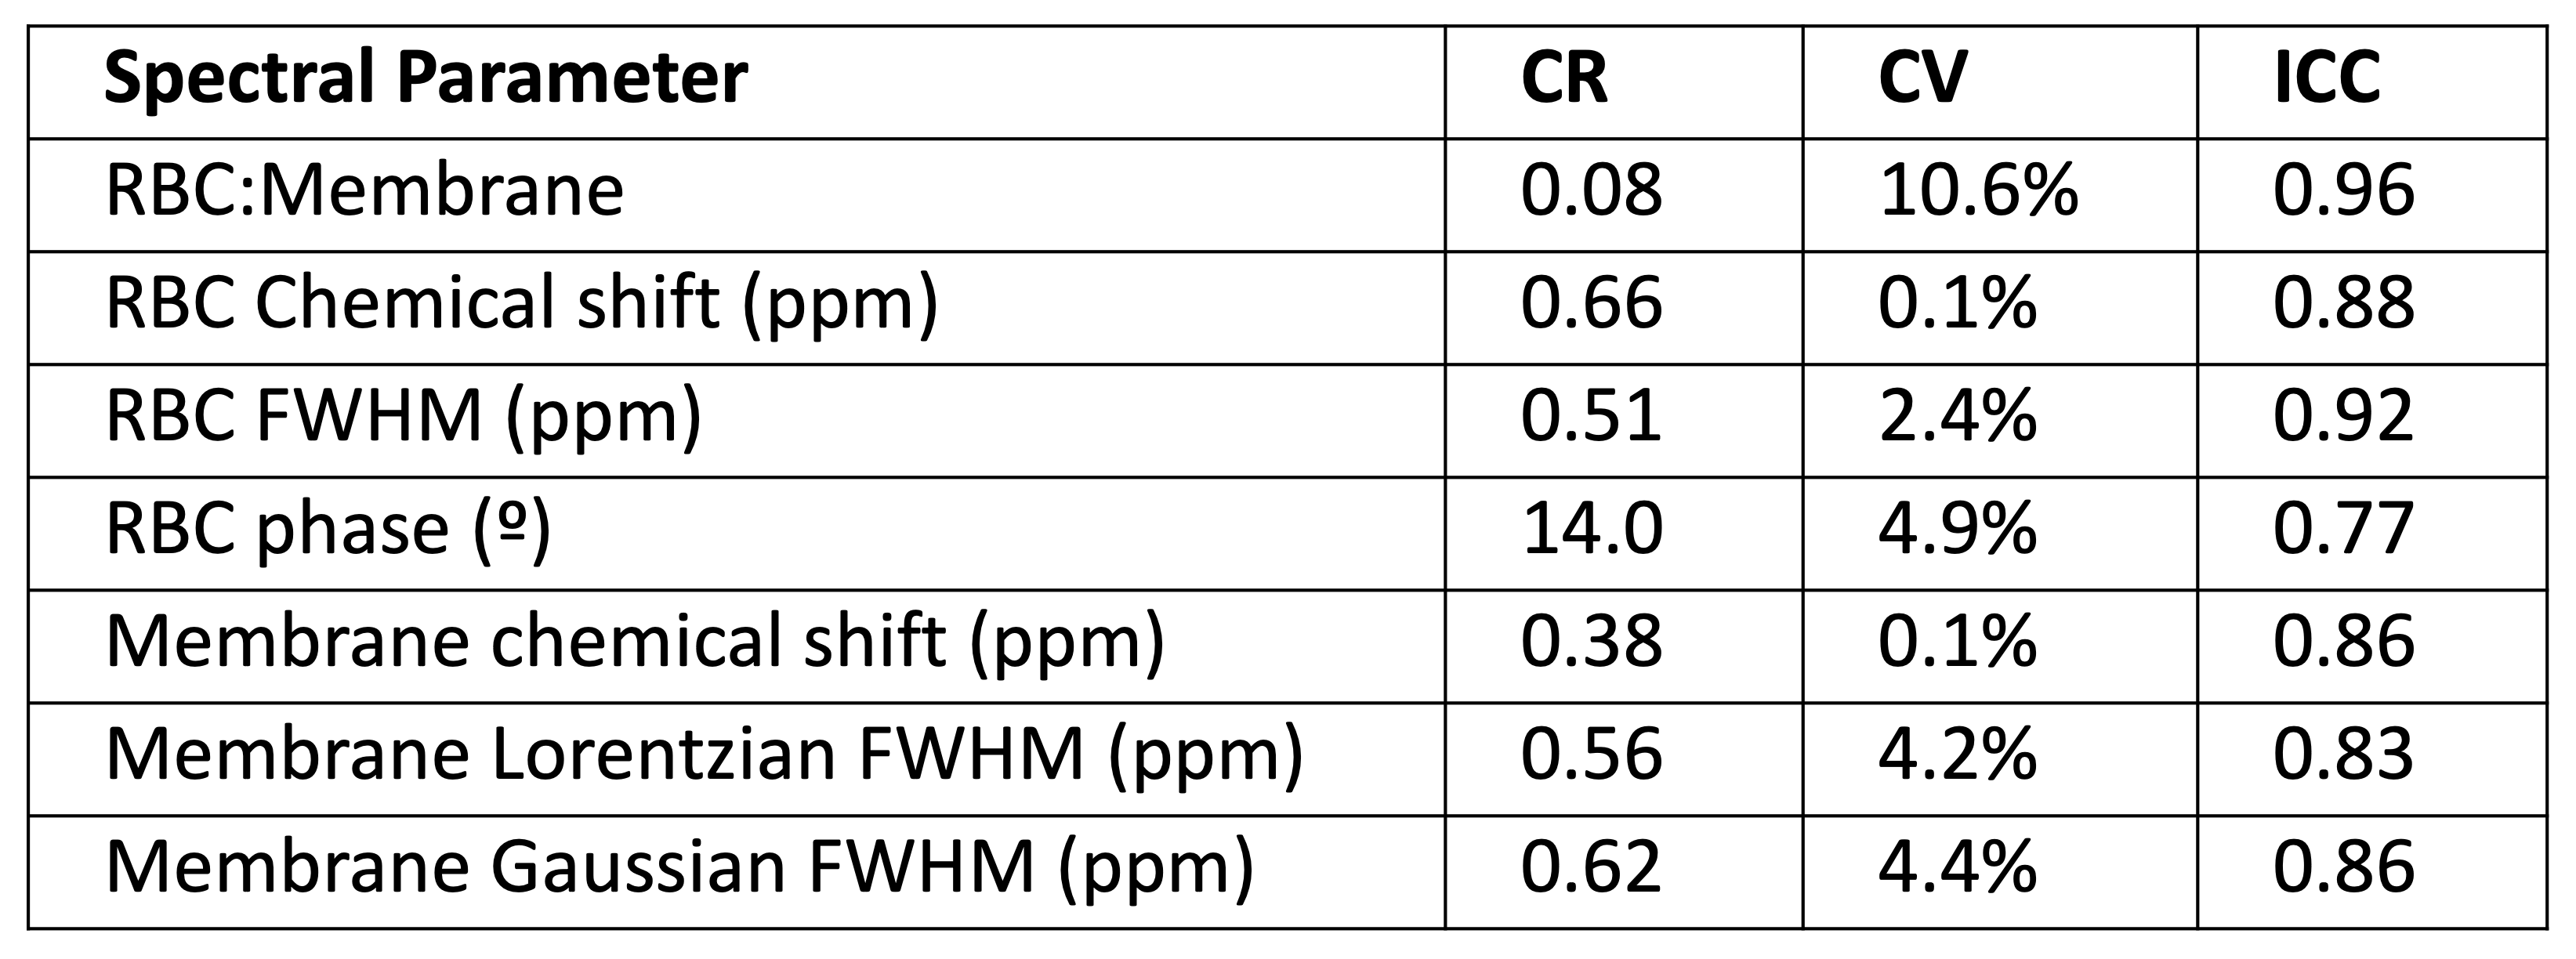
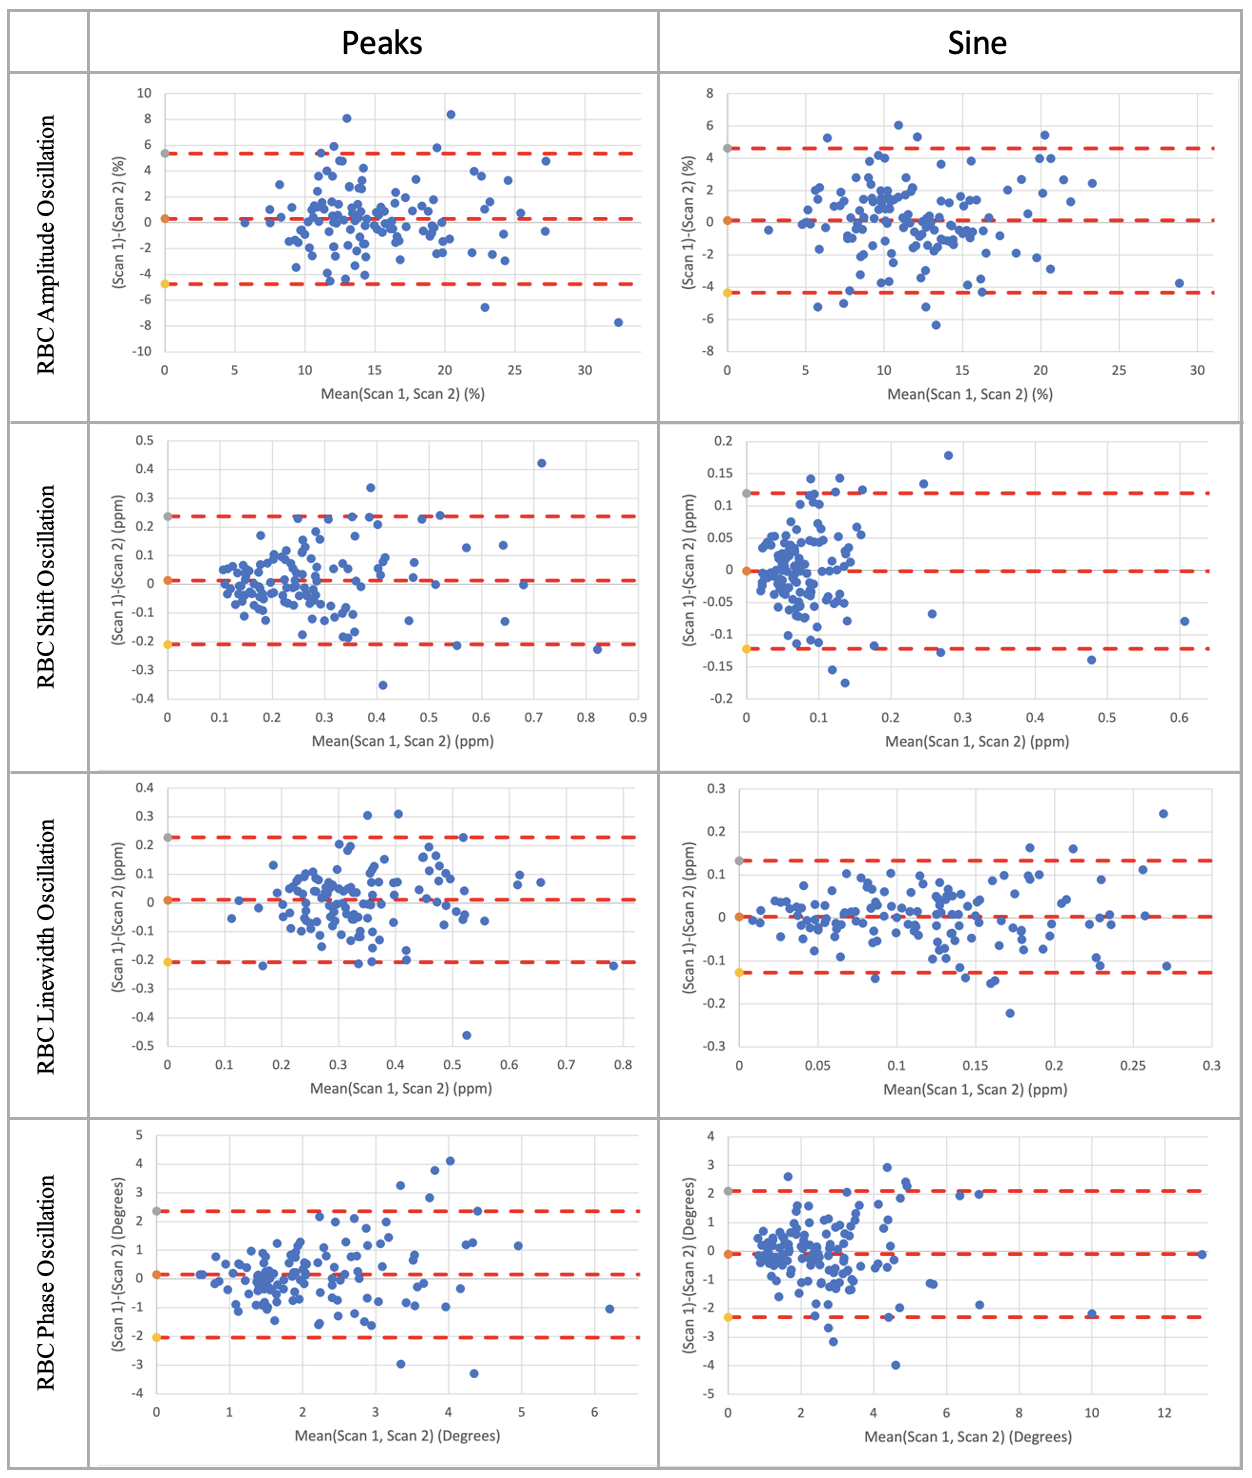
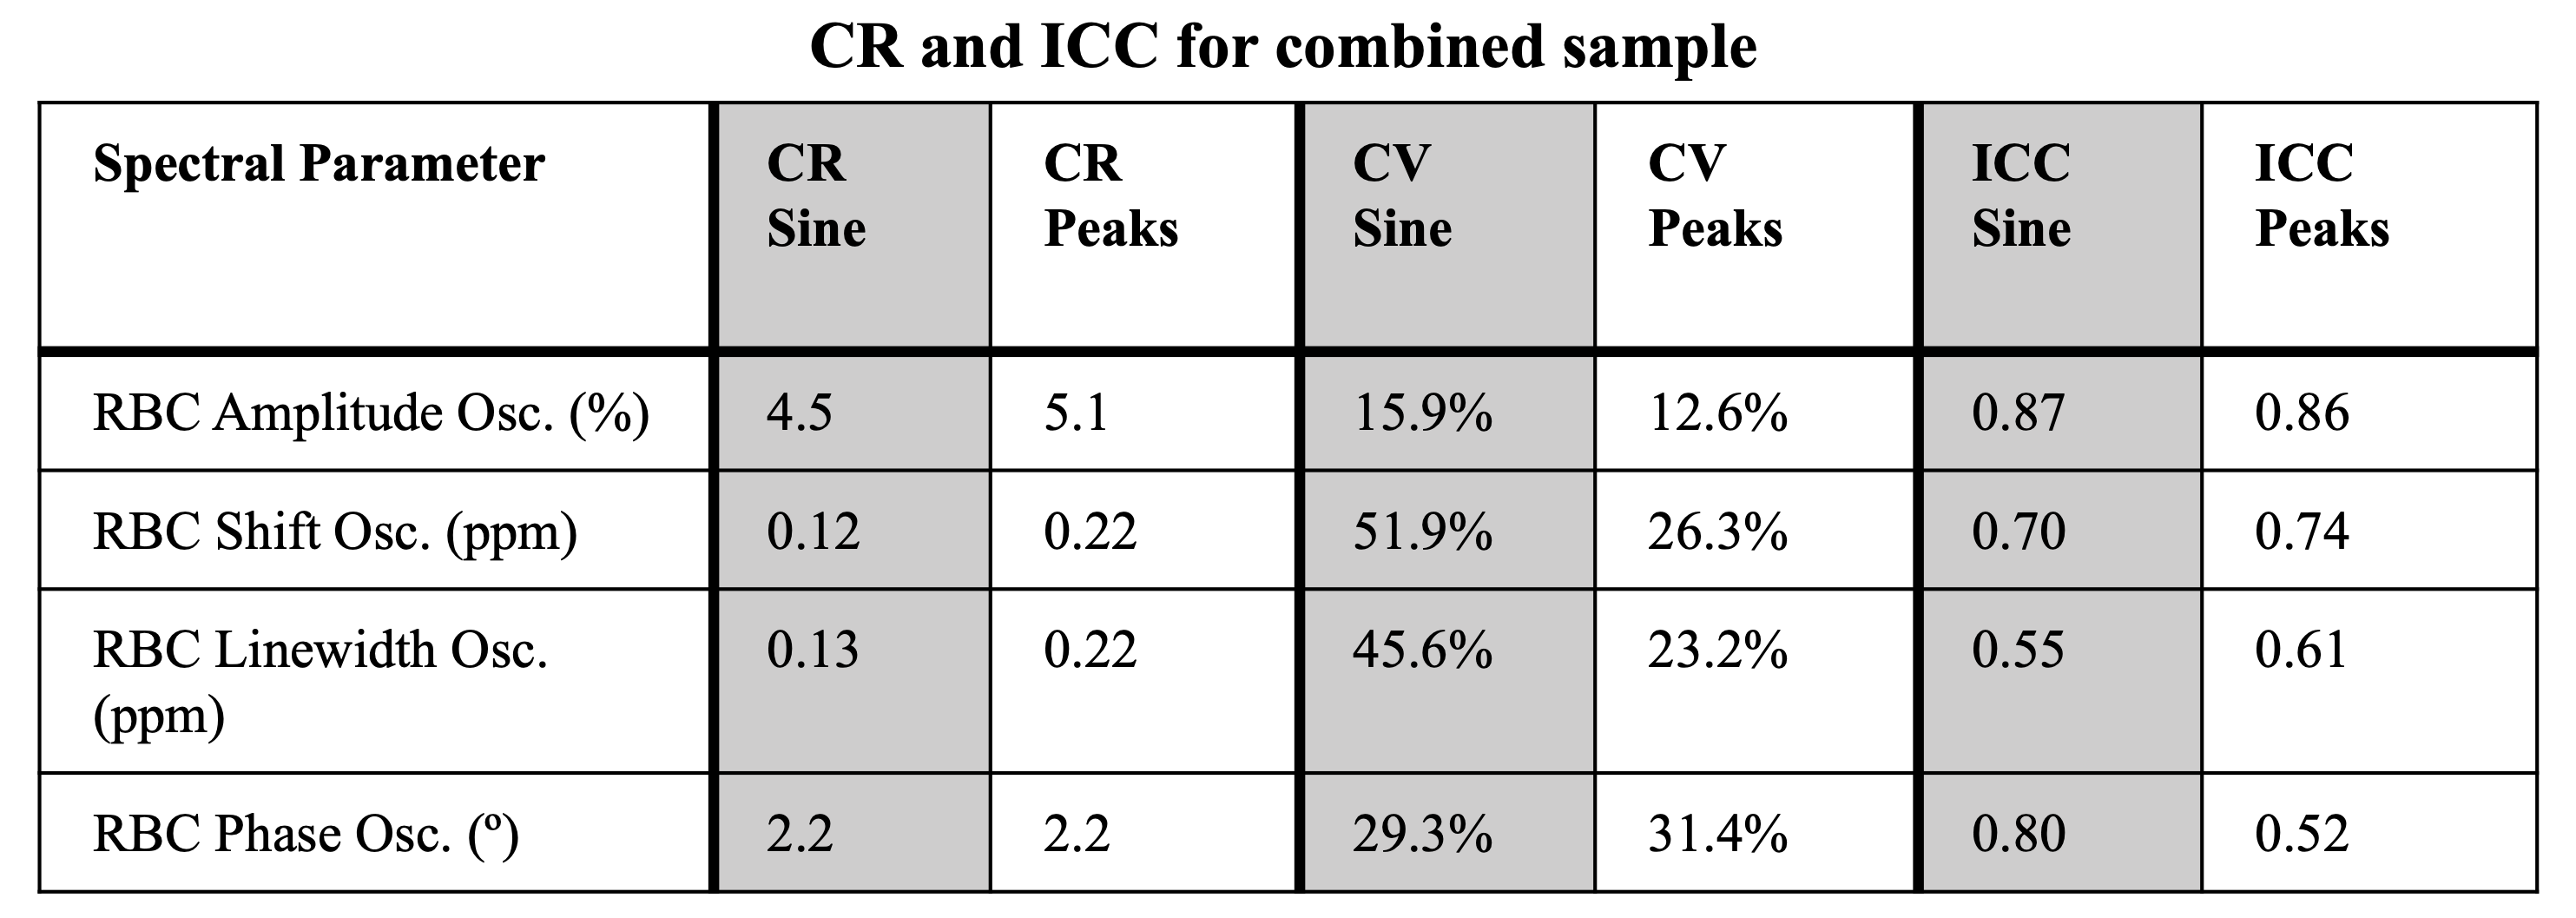
We observed relatively low CR and CV values and high ICC values for static parameters, suggesting high repeatability (Figure 2). The proximity of the average scan difference to zero and lack of pattern in Bland-Altman plots (Figure 3) suggests minimal bias in repeated dynamic measurements, regardless of fit method. Figure 4 tabulates the CR, CV, and ICC values of dynamic parameters for both fitting methods. ICC values suggest a strong correlation between repeated measurements of all parameters, regardless of fit method. The sine-fit method had a lower CR for all dynamic parameters aside from RBC phase oscillations. The peak-finding method had a stronger ICC value for both the RBC shift oscillations and the RBC linewidth oscillations and a comparable ICC value for RBC amplitude oscillations. The peak-finding method also had lower CV values for all parameters except phase oscillations.Discussion
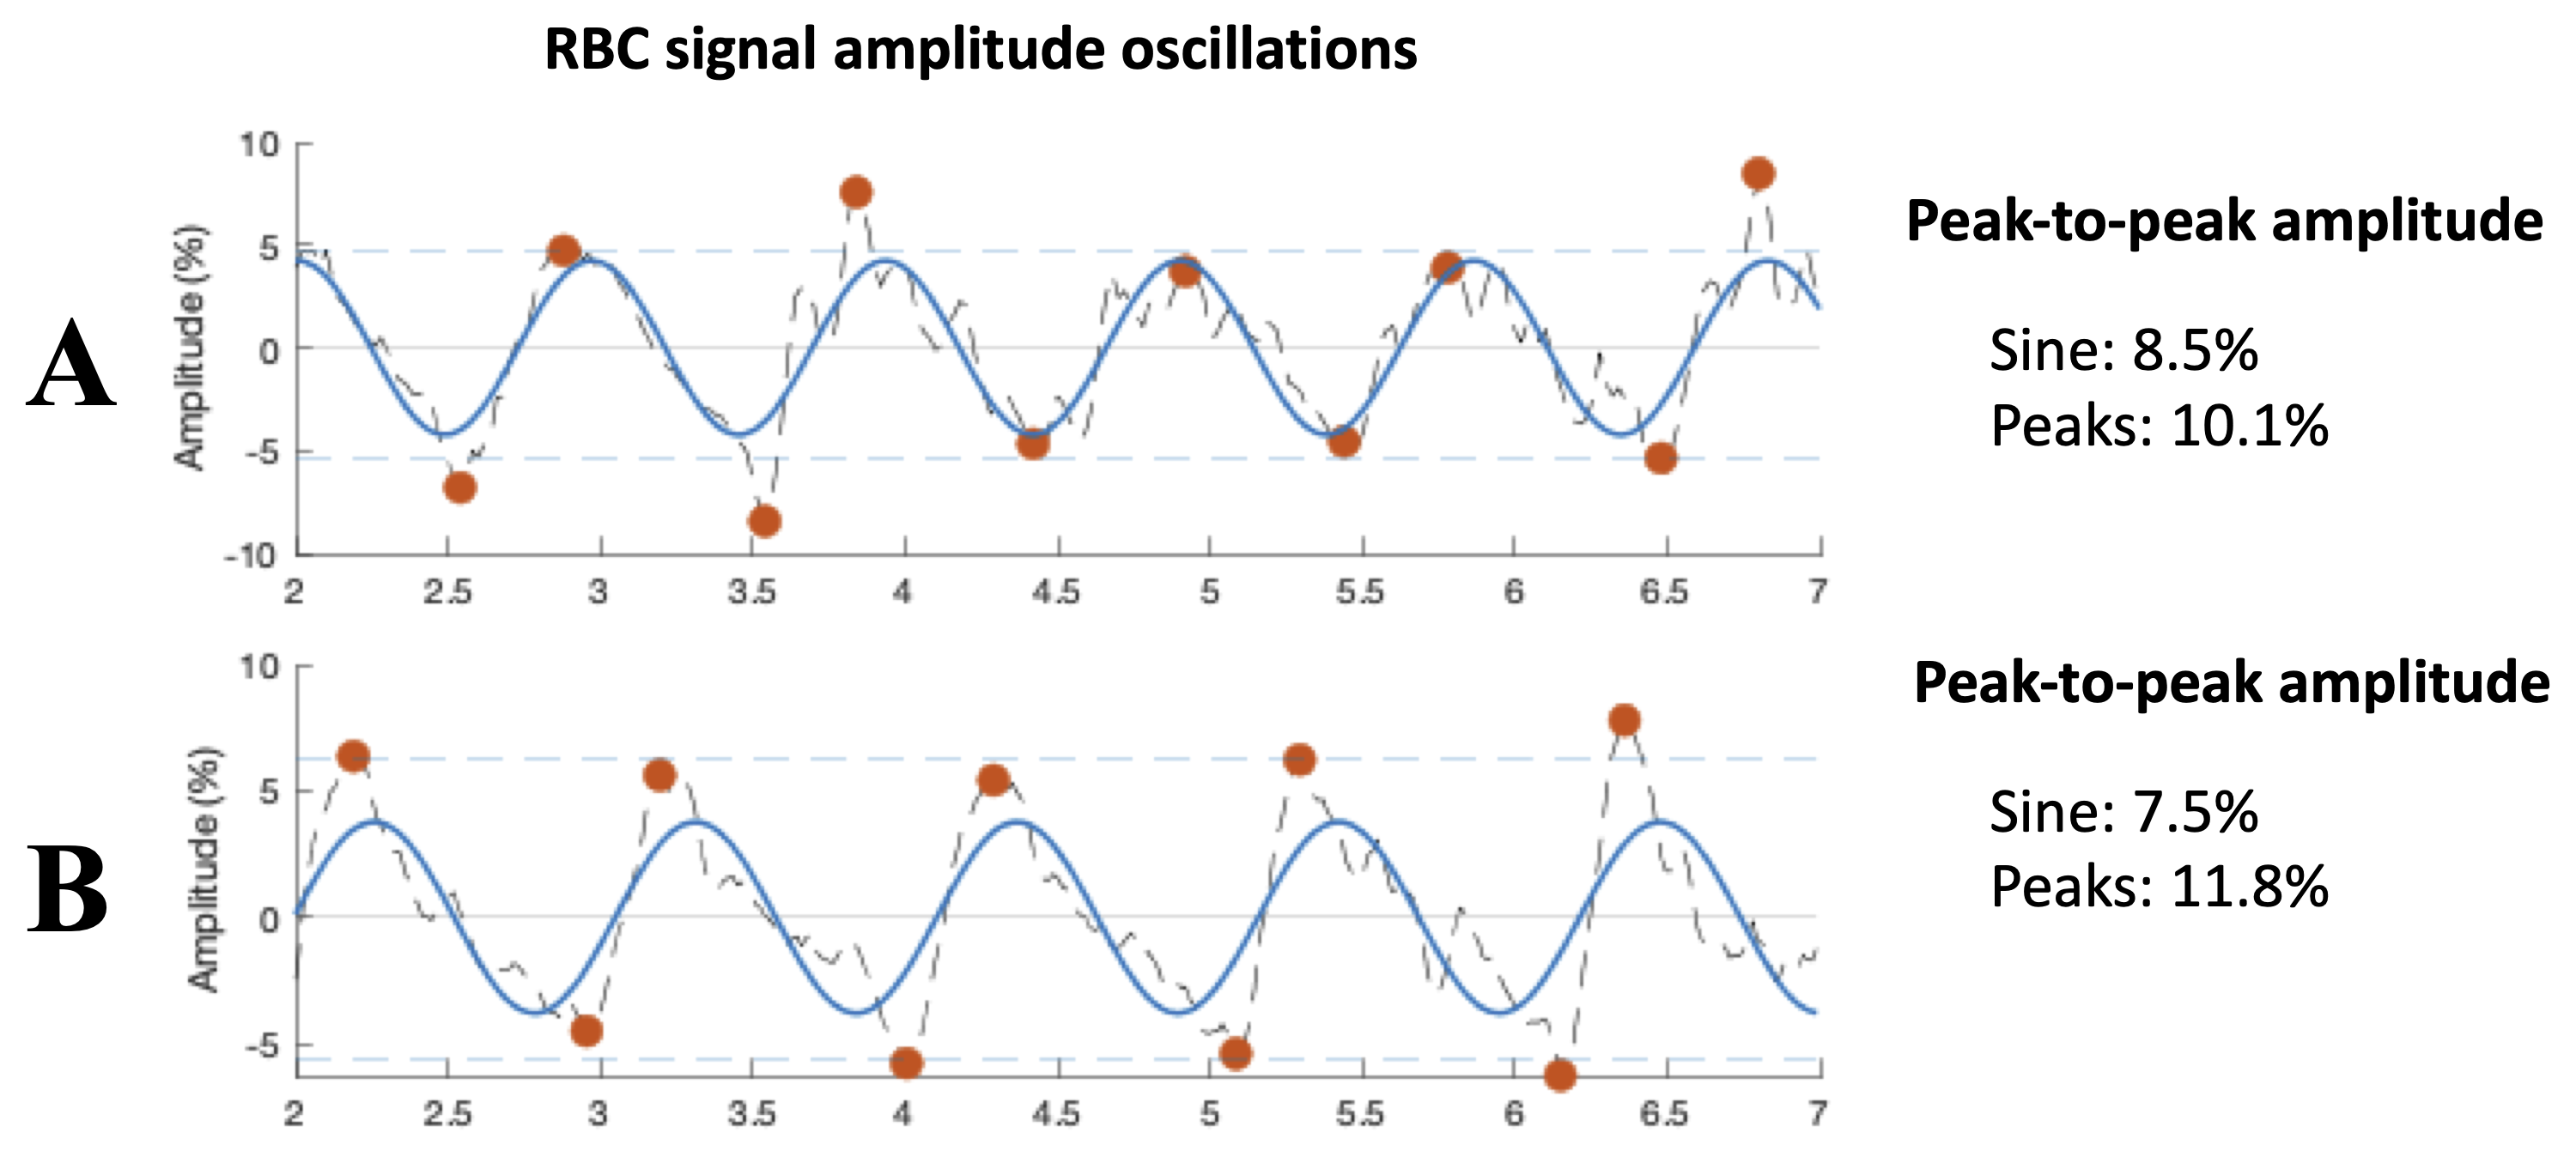
CR and ICC values for static spectroscopy derived using reader-based exclusion criteria suggest good repeatability between measurements. Lower CR values with the sine method may be the result of fewer degrees of freedom in the sine fit, making it less susceptible to noise. The sine function is restricted to a singular amplitude that best matches the collection of oscillation amplitudes in the signal, whereas the peak-finding algorithm can converge on a different peak-to-peak amplitude in every period, as exhibited in Figure 5A. However, lower CR values with the sine fit may also be the result of generally lower amplitude measurements than the peak-finding method. Repeatability measures that aren't sensitive to the magnitude of measurements, like the CV and ICC, are likely to provide a more appropriate comparison of the sine and peak-finding methods. Thus, the generally lower CV values and higher ICC values for the peak-finding method suggest that it may provide more repeatable measurements. The inability of the sine function to properly fit asymmetric oscillations may contribute to the higher associated CV values. Figure 5B demonstrates how sine fits can often underestimate the amplitude of oscillations with asymmetric crests/troughs, as is the case with the fast rise and slow decay of the RBC amplitude in patients with pulmonary vascular disease5,6.Acknowledgements
R01HL105643, R01HL12677, NSF GRFP DGE-1644868References
1. Bier, E., Mummy, D., Lu, J. & Driehuys, B. Within-session repeatability of pulmonary 129Xe static and dynamic spectroscopy. in ISMRM 2021 Annual Meeting and Exhibition (2021).
2. Bier, E. A. et al. A protocol for quantifying cardiogenic oscillations in dynamic 129 Xe gas exchange spectroscopy: The effects of idiopathic pulmonary fibrosis. NMR Biomed 32, (2019).
3. Bier, E. A. et al. Noninvasive diagnosis of pulmonary hypertension with hyperpolarised 129Xe magnetic resonance imaging and spectroscopy. ERJ Open Res 8, (2022).
4. Niedbalski, P. J. et al. Protocols for multi-site trials using hyperpolarized 129Xe MRI for imaging of ventilation, alveolar-airspace size, and gas exchange: A position paper from the 129Xe MRI clinical trials consortium. Magn Reson Med 86, 2966–2986 (2021).
5. Saouti, N., Westerhof, N., Postmus, P. E. & Vonk-Noordegraaf, A. The arterial load in pulmonary hypertension. Eur Respir Rev 19, 197–203 (2010).
6. Lankhaar, J. W. et al. Quantification of right ventricular afterload in patients with and without pulmonary hypertension. Am J Physiol Heart Circ Physiol 291, (2006).
Figures