4503
Effect of glucose on the HP 129Xe dissolved phase blood resonances1Faculty of Physics, Astronomy and Applied Computer Science, Jagiellonian University, Kraków, Poland, 2Chemistry and Material Science Program, Lakehead University, Thunder Bay, ON, Canada, 3Thunder Bay Regional Health Research Institute, Thunder Bay, ON, Canada, 4Chemistry Department, Lakehead University, Thunder Bay, ON, Canada, 5Xemed LLC, Durham, NH, United States, 6Applied Life Sciences Program, Lakehead University, Thunder Bay, ON, Canada, 7Department of Engineering/Physics/Technology, Nassau Community College, Garden City, NY, United States, 8Northern Ontario School of Medicine, Sudbury, ON, Canada
Synopsis
Keywords: Hyperpolarized MR (Gas), Spectroscopy, blood, hemoglobin, dissolved phase imaging
We examined the impact of elevated glucose levels on the chemical shift and T2* relaxation of hyperpolarized 129Xe dissolved in sheep blood. The addition of glucose did not affect the 129Xe-plasma resonance. For the first time, however, we have observed an additional 129Xe dissolved phase resonance attributed to 129Xe bound to glycated hemoglobin. A glucose-related linear downfield shift of the 129Xe resonance frequency was observed for 129Xe bound to native hemoglobin, whereas the T2* relaxation of 129Xe bound to glycated hemoglobin increased non-linearly with increasing glucose concentration.
Introduction
The hyperpolarized 129Xe (HP 129Xe) dissolved in blood has two resonances attributed to: xenon-hemoglobin interactions in red blood cells (129Xe-RBC) and xenon-albumin interactions in blood plasma (129Xe-Plasma)1. The 129Xe-blood resonances are a vital part of the in vivo HP 129Xe dissolved phase imaging such as: lung gas exchange examination2-4, perfusion imaging of the brain5,6 and kidney7. Therefore, it is important to understand the impact of particular blood components on the NMR signal of HP 129Xe. Previously, only the effect of blood oxygenation on HP 129Xe-blood resonances was studied thoroughly8-11. In the present study, for the first time, we have investigated the effects of another vital chemical element in the blood – glucose and its concentration – on the physical properties of HP 129Xe.Methods
The experiments were performed in vitro on samples obtained by mixing 20mL of fresh citrated sheep blood (Cedarlane, Burlington, CA, USA) with various volumes of d-glucose solution (0.5 M/L in PBS buffer) to obtain the following set of concentrations: 5,10,15,20,25,35,45,55 mM/L. The 20mL sample of pure blood served as a control. All samples were allowed to equilibrate to room temperature for approximately 1 hour. 129Xe gas was polarized up to 56% using a XeBox-10E polarizer (Xemed, Durham, NH, USA) and dispensed into a 1L Tedlar bag. The blood samples were mixed with HP 129Xe gas in an exchange module (Superphobic MicroModule 0.5×1G680, Membrana, North Carolina, USA) inside a clinical Philips Achieva 3.0T MRI scanner (Philips, Andover, MA) equipped with a custom-built dual 1H/129Xe quadrature MRI birdcage coil. The blood was pumped through the exchange module perpendicular to the 129Xe flow for ~6 sec. To measure the effect of glucose concentration on the chemical shift (CS) of the 129Xe dissolved in plasma (129Xe-plasma) and in RBC (129Xe-RBC) resonances, high-resolution single voxel spectroscopy was performed using the parameters listed in Table 1. The acquired data were preprocessed with custom MatLab scripts in Matlab 2020b (Mathworks, Natick, Massachusetts, USA) and then analyzed with Origin2021b (OriginLab, Northampton, Massachusetts, USA).Results and Discussion
The conventional three-peak Lorentzian model (3PL) was fitted to the gas, plasma and RBC peaks on the acquired MRS spectra. The 3PL fit of the 10mM/L glucose sample is shown on Fig. 1A. The increase in glucose concentration did not cause a significant change in the 129Xe-plasma CS (Fig.1B), whereas the spectral position of the 129Xe-RBC resonance increased linearly with a rate of (0.025±0.004)ppm/mM. The observed downfield shift of 129Xe-RBC resonance, may be explained by a glycation of hemoglobin that results in the accumulation of free OH- radicals due to an iron-mediated Fenton’s reaction12, yielding deshielding of the HP 129Xe nuclei. Moreover, the number of glycated hemoglobin molecules increases proportionally to the glucose concentration13, which is in agreement with the observed linear relationship between the CS and glucose concentration. No significant changes were observed in T2* values for HP 129Xe dissolved in both the RBC and plasma pools with an increase of glucose content (Fig.1C) using the 3PL fit.In addition, increasing the glucose concentration yielded an increase in the 129Xe-RBC resonance asymmetry, and even a slight splitting of the peak at the highest concentrations (Fig.2). The residual error analysis of the 3PL fit showed distinct peaks at 216, 218, and 222 ppm for the 10 mM/L sample, and at 216 and 219 ppm for the 45mM/L sample (Fig. 3C and 3D), indicating the presence of a new additional 129Xe-RBC1 resonance that was not taken into account by the conventional 3PL model. Once the spectra were fitted with a 4-Peak-Lorentzian model (4PL) (two peaks fitted to 129Xe-RBC resonance instead of one (Fig. 3A,3B), the residual error becomes flat at the RBC resonance position. This indicates that 4PL model is more accurate compared to the conventional 3PL. Appearance of the additional Xe-RBC1 resonance may be associated with creation of a glycated hemoglobin (HbA1c). Therefore, we hypothesize that 129Xe binding sites might be affected by glycation and they may be different in HbA1c compared to native hemoglobin (HbA0). Therefore, two HP 129Xe resonances may be distinguished – one from 129Xe bound to HbA0 and another originating from 129Xe bound to HbA1c.
Once the 4PL model was implemented, a glucose-related change in CS was not observed for the HP 129Xe-HbA1c (Xe-RBC1) resonance (Fig.5A). However, the CS of 129Xe-HbA0 (Xe-RBC2) resonance, shifted downfield with a rate of (0.015±0.002) ppm/mM. This possibly may be explained by production of OH- radicals, as mentioned earlier.
The T2* relaxation time for the 129Xe-plasma resonance did not depend on the glucose concentration (Fig.5B). Conversely, the 129Xe-HbA1c T2* time increased non-linearly from (1.58±0.24)ms up to (2.67±0.40)ms over the range of the glucose concentrations. The 129Xe-HbA0 T2* relaxation time changed mildly over the 0–10 mM glucose concentration range and leveled out at higher glucose levels. These dynamics can possibly be explained by both the Fenton’s reaction-mediated iron release from HbA1c and/or conformational changes of the Hb molecule.
Conclusion
For the first time, we demonstrated glucose-induced changes in the CS and T2* relaxation of HP 129Xe dissolved in blood. We discovered evidence for a third dissolved-phase resonance, 129Xe-HbA1c, which was attributed to HP 129Xe bound to HbA1c, produced by the glycation of native HbA0.Acknowledgements
This research was funded by Natural Science and Engineering Research Council (NSERC) Discovery grant (RGPIN-2017-05359) and by the Priority Research Area SciMat under the program Excellence Initiative – Research University at the Jagiellonian University in Kraków (PSP: U1U/P05/NO/03.35) YS was supported by the Mitacs Elevate Postdoctoral Fellowship (IT25574). Vira Grynko was supported by an Ontario Trillium Scholarship. Lutosława Mikowska was supported by Jagiellonian Interdisciplinary PhD Program.
References
- Albert MS, Balamore D, Kacher DF, Venkatesh AK, Jolesz FA. Hyperpolarized 129XE T1 in oxygenated and deoxygenated blood. NMR in Biomedicine. 2000;13(7):407-414.
- Matheson Bsc AM, Mcintosh Bsc MJ, Kooner Bsc HK, et al. Persistent 129 Xe MRI Pulmonary and CT Vascular Abnormalities in Symptomatic Individuals with Post-Acute COVID-19 Syndrome. Radiology . Published online 2022.
- Grist JT, Chen M, Collier GJ, et al. Hyperpolarized 129Xe MRI abnormalities in dyspneic patients 3 months after COVID-19 Pneumonia. Radiology. 2021;301(1):E353-E360.
- Li, H., Zhao, X., Wang, Y., Lou, X., Chen, S., Deng, H., ... & Zhou, X.. Damaged lung gas exchange function of discharged COVID-19 patients detected by hyperpolarized 129Xe MRI. Science advances, 2021, 7(1), eabc8180.
- Shepelytskyi Y, Hane FT, Grynko V, Li T, Hassan A, Albert MS. Hyperpolarized 129Xe Time-of-Flight MR Imaging of Perfusion and Brain Function. Diagnostics. 2020;10:630.
- Rao MR, Stewart NJ, Griffiths PD, Norquay G, Wild JM. Imaging Human Brain Perfusion with Inhaled Hyperpolarized 129 Xe MR Imaging. Radiology. 2017;286(2):659-665
- Chacon‐Caldera J, Maunder A, Rao M, et al. Dissolved hyperpolarized xenon‐129 MRI in human kidneys. Magnetic Resonance in Medicine. 2020;83:262-270.
- Albert MS, Kacher DF, Balamore D, Venkatesh AK, Jolesz FA. T1 of 129Xe in Blood and the Role of Oxygenation. Journal of Magnetic Resonance. 1999;140(1):264-273.
- Norquay G, Leung G, Stewart NJ, Wolber J, Wild JM. 129Xe Chemical Shift in Human Blood and Pulmonary Blood Oxygenation Measurement in Humans Using Hyperpolarized 129Xe NMR. Magn Reson Med. 2017;77:1399-1408.
- Norquay G, Leung G, Stewart NJ, Tozer GM, Wolber J, Wild JM. Relaxation and exchange dynamics of hyperpolarized 129Xe in human blood. Magnetic Resonance in Medicine. 2015;74(2):303-311.
- Wolber J, Cherubini A, Dzik-Jurasz ASKK, Leach MO, Bifone A. Spin-lattice relaxation of laser-polarized xenon in human blood. Proc Natl Acad Sci U S A. 1999;96(7):3664-3669.
- Sen S, Kar M, Roy A, Chakraborti AS. Effect of nonenzymatic glycation on functional and structural properties of hemoglobin. Biophysical Chemistry. 2005;113(3):289-298.
- Sacks DB. Correlation between Hemoglobin A1c (HbA1c) and Average Blood Glucose: Can HbA1c Be Reported as Estimated Blood Glucose Concentration? Journal of Diabetes Science and Technology. 2007;1(6):801-803.
Figures
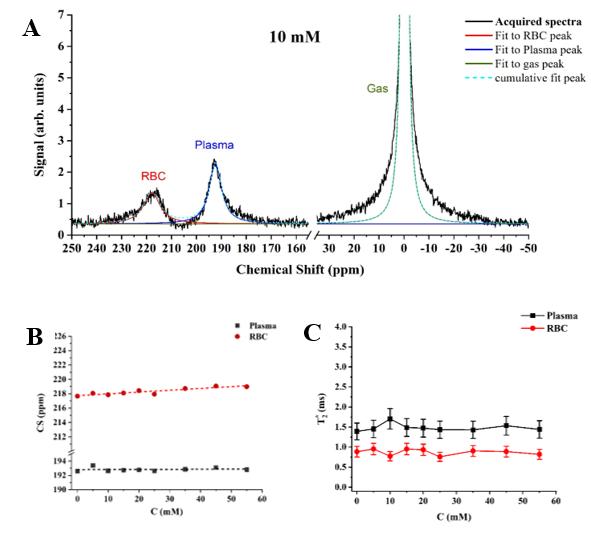

Figure 2. HP 129Xe MRS spectra acquired for a pure blood sample (black line) and for a 25 mM blood glucose concentration (red line). The RBC peak became asymmetrical and broader with the addition of glucose. A small splitting of the RBC peak can be noticed (green arrow).
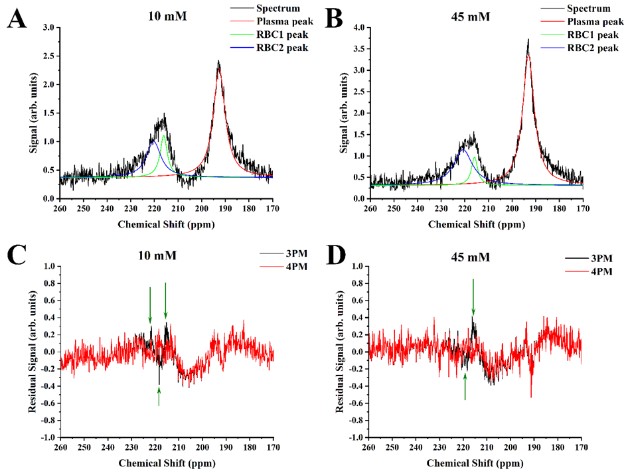
Figure 3. HP 129Xe MRS spectra of the 10 mM sample (A) and 45 mM sample (B) fitted to the proposed 4PL model. The black line corresponds to the acquired HP 129Xe spectra. The red, green and blue lines represent the Lorentzian fits of the 129Xe-plasma, 129Xe-RBC1, and 129Xe-RBC2 peaks, respectively. The residuals of the 3PL (black lines) and 4PL (red line) fits were plotted as a function of chemical shift for the 10 mM sample (C) and 45 mM sample (D).
