4502
Terminal Airspace Enlargement Measured Using Pulmonary Functional MRI Predicts CT Airway Loss in COPD
Paulina Victoria Wyszkiewicz1,2, Maksym Sharma1,2, Harkiran K Kooner1,2, David G McCormack3, Miranda Kirby4, and Grace Parraga1,2,3,5
1Department of Medical Biophysics, Western University, London, ON, Canada, 2Robarts Research Institute, London, ON, Canada, 3Division of Respirology, Department of Medical Biophysics, Western University, London, ON, Canada, 4Department of Physics, Toronto Metropolitan University, Toronto, ON, Canada, 5School of Biomedical Engineering, Western University, London, ON, Canada
1Department of Medical Biophysics, Western University, London, ON, Canada, 2Robarts Research Institute, London, ON, Canada, 3Division of Respirology, Department of Medical Biophysics, Western University, London, ON, Canada, 4Department of Physics, Toronto Metropolitan University, Toronto, ON, Canada, 5School of Biomedical Engineering, Western University, London, ON, Canada
Synopsis
Keywords: Hyperpolarized MR (Gas), Lung
The onset and progression of chronic obstructive pulmonary disease (COPD) is currently believed to initiate in the small-airways and progresses to emphysema or terminal airspace (alveolar) enlargement and destruction. MRI apparent-diffusion-coefficient (ADC) provides a way to measure subclinical emphysematous destruction in patients. Here we investigated the relationship between pulmonary functional MRI measurements of terminal airspace enlargement using 3He MRI-ADC and CT airway changes in ex-smokers with COPD. MRI-ADC values at baseline were uniquely predictive of worsening CT total-airway-count and airway wall-area after three-years. MRI captures evidence of mild or subclinical emphysema and its relationship with terminal airway obliteration in COPD.INTRODUCTION
In patients with chronic obstructive pulmonary disease (COPD), disease onset and progression are believed to initiate in the small airways,1 below the resolution of conventional computed tomography (CT) and prior to the manifestation of CT emphysema.2 Quantitative CT imaging techniques provide a way to segment the airway tree from the trachea down to approximately the 10th generation, where airway count was previously observed to diminish with increasing disease severity2 and was associated with the number of terminal bronchioles measured using micro-CT.3 Importantly, hyperpolarized noble gas MRI apparent diffusion coefficient (ADC) provides a highly sensitive and radiation-free measurement of terminal airspace enlargement and alveolar geometry, which may be a sign of early emphysema4 and/or small airways disease.5 These cross-sectional observations suggest that pulmonary functional MRI may provide supporting evidence of the mechanisms contributing to airway-related disease progression in COPD. Thus, we hypothesized that MRI-derived measurements of alveolar enlargement would relate to the change in the total number of CT-visible airways after three-years in ex-smokers with COPD.METHODS
We retrospectively evaluated 50 ex-smokers with COPD (>10 pack years, 40-85 years-of-age) who provided written informed consent (NCT02279329) to the Thoracic Imaging Network of Canada (TINCan) study and completed 3He MRI, CT and pulmonary function tests at baseline and three-year follow-up.6Data Acquisition:
Anatomical 1H and hyperpolarized 3He MRI were acquired using a whole-body 3T Discovery MR750 (General Electric Healthcare, WI, USA) with broadband imaging capabilities, as previously described.7 1H images were acquired during breath-hold after inhalation of 1.0 L of N2 from functional residual capacity (FRC) using a whole-body radiofrequency coil and a fast-spoiled gradient-recalled echo (FGRE) sequence (partial-echo-acquisition; 8 sec data acquisition; repetition-time(TR)/echo-time(TE)=4.7/1.2 msec; flip-angle=30°; field-of-view (FOV)=40×40 cm2; bandwidth=24.4 kHz; 128×80 matrix, zero-padded to 128×128; partial-echo-percentage=62.5%; 15–17 slices; slice-thickness=15 mm; no-gap). 3He images were acquired during breath-hold of 1.0 L of diluted hyperpolarized gas from FRC using a single-channel rigid elliptical transmit-receive chest coil (RAPID Biomedical, Wuerzburg, Germany). Diffusion-weighted images were acquired using an FGRE sequence with centric k-space sampling (14 sec data acquisition; TR/TE=7.6/3.7 msec; flip-angle=8°; FOV=40×40 cm2; 128×80 matrix, zero-padded to 128×128; 7 slices; slice-thickness=30 mm) with and without additional diffusion sensitization (maximum-gradient-amplitude=1.94 G/cm; rise-and-fall time=0.5 msec; gradient-duration=0.46 msec; diffusion-time=1.46 msec; b-value=1.6 sec/cm2). Static ventilation images were acquired using an FGRE sequence (partial-echo-acquisition; 11 sec data acquisition; TR/TE=3.8/1.0 msec; flip-angle=7°; FOV=40×40 cm2; bandwidth=48.8 kHz; 128×80 matrix, zero-padded to 128×128; partial-echo-percentage=62.5%; 15–17 slices; slice-thickness=15 mm; no-gap).
Thoracic CT scans were acquired using a 64-slice Lightspeed VCT scanner (General Electric Healthcare, Milwaukee, WI) during breath-hold after inhalation of 1.0 L of N2 from FRC (beam-collimation=64×0.625 mm; tube-voltage=120 kVp; effective-current=100 mAs; tube-rotation-time=500 ms; 1.0 pitch; standard convolution kernel; slice-thickness=1.25 mm). The mean total effective dose was 1.8 mSv.
Data Analysis:
Diffusion-weighted MR images were used to measure ADC, as previously described.8 3He MRI ventilation defect percent (VDP) was semi-automatically segmented using MATLAB (R2019a, Natick, Massachusetts).9 Thoracic CT images were analyzed using VIDAvision software (VIDA Diagnostics Inc., Coralville, IA) to quantify total airway count (TAC) and airway wall area (WA).
Statistical analyses were completed using SPSS (ver. 28; IBM Statistics, Armonk, NY). Paired samples t-tests were used to determine significance between time points. Univariate relationships were evaluated using Spearman (ρ) correlations. Multivariable models were generated using the enter approach to predict the three-year change in TAC and WA.
RESULTS
In 50 ex-smokers with COPD (13 female/37 male, 70±9 years), there were significant differences in VDP (p<.001), TAC (p<.001) and WA (p=.04) after three-years (2.6±0.6, range=1-4years), but not ADC (p=.2), as shown in Table 1. Representative MRI ventilation, ADC and CT airway tree images for a participant with severe COPD at baseline and follow-up are shown in Figure 1. Baseline ADC was significantly correlated with baseline WA (ρ=-.34, p=.02), the longitudinal change in TAC (ΔTAC) (ρ=-.40, p=.005) and the longitudinal change in WA (ΔWA) (ρ=.40, p=.004), shown in Figure 2. In multivariable models, baseline ADC was a significant predictor for both the longitudinal change in TAC (p=.005) and WA (p=.02), while baseline VDP (ΔTAC: p=.6; ΔWA: p=.8) also contributed to the models, shown in Table 2.DISCUSSION
We identified MRI measurements that predicted the change in CT airways after three-years in ex-smokers with COPD. At baseline, ADC was positively correlated with WA, suggesting that increased alveolar destruction is related to thinner airway walls in COPD. Interestingly, ADC was a significant predictor of the longitudinal change in TAC and WA, suggesting that alveolar enlargement and/or destruction may contribute to airway obliteration and wall thickening over time. Thus, MRI-derived measurements of subclinical emphysema may capture early evidence of airway-related disease progression.CONCLUSIONS
In ex-smokers with COPD, hyperpolarized noble gas MRI-ADC was a significant predictor for the change in TAC and WA after three-years. MRI captured evidence of mild or subclinical emphysema and its relationship with terminal airway obliteration in COPD. This important finding has relevance for the working hypothesis that COPD initiates, based on CT and micro-CT pathologic findings, as small airways disease and not as emphysema. The sensitivity of MRI-ADC to subclinical terminal airway distention has implications for our understanding of the mechanisms of COPD progression.Acknowledgements
No acknowledgement found.References
- Hogg, J.C. N Engl J Med (1968).
- Kirby, M. Am J Respir Crit Care Med (2018).
- Kirby, M. Am J Respir Crit Care Med (2020).
- Swift, A.J. Eur J Radiol (2005).
- Wang, C. J Magn Reson Imaging (2008).
- Kirby, M. Chronic Obstr Pulm Dis (2014).
- Parraga, G. Invest Radiol (2007).
- Kirby, M. J Appl Physiol (2012).
- Kirby, M. Acad Radiol (2012).
Figures
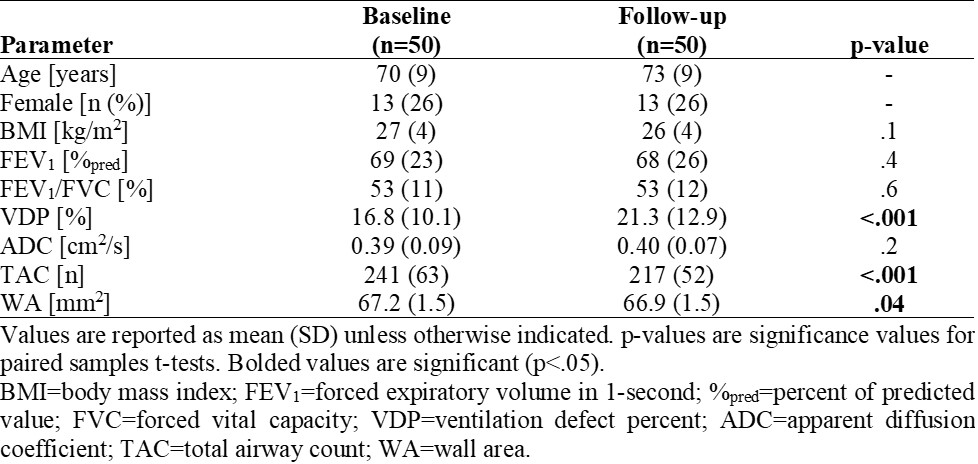
Table 1. Participant Demographics, Pulmonary Function and Imaging
Measurements
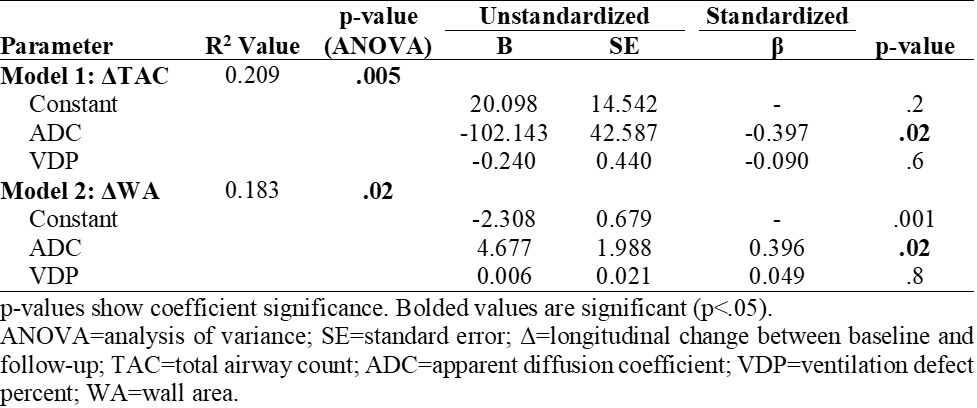
Table 2. Multivariable Linear Regression Models
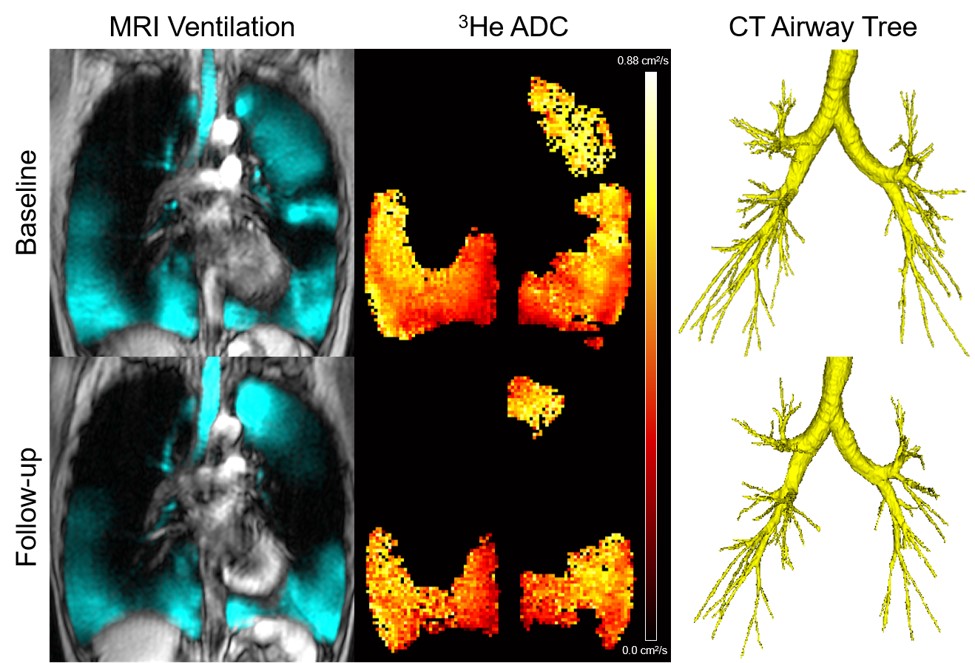
Figure 1. Qualitative results of MRI ventilation, ADC and CT airway tree at baseline and follow-up for a participant with severe COPD.
The participant is a 67 year old female with a follow-up time of 2.2 years and baseline/follow-up VDP of 33.8/43.6 %, ADC of 0.51/0.52 cm2/s, and TAC of 206/174.
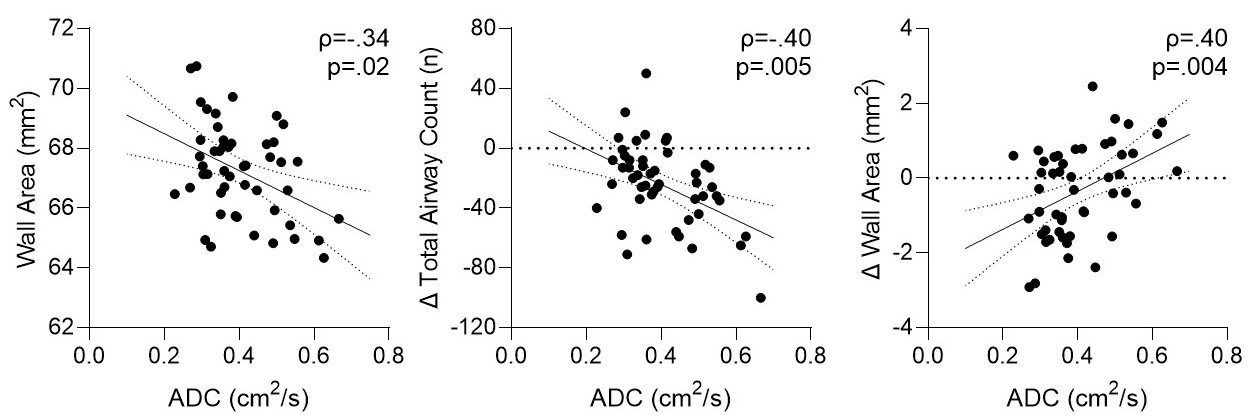
Figure 2. Relationships between MRI ADC with CT airway measurements at baseline and over time.
In ex-smokers with COPD, baseline ADC significantly correlated with baseline wall area (ρ=-.34, p=.02), ΔTAC (ρ=-.40, p=.005) and ΔWA (ρ=.40, p=.004).
DOI: https://doi.org/10.58530/2023/4502