4500
Healthy reference distributions for 129Xe gas exchange MRI with consideration of sex and hemoglobin1Radiology, Duke University, Durham, NC, United States, 2Medical Physics, Duke University, Durham, NC, United States, 3Biomedical Engineering, Duke University, Durham, NC, United States
Synopsis
Keywords: Hyperpolarized MR (Gas), Lung
129Xe gas exchange MRI is commonly quantified by binning images of ventilation, membrane uptake (M/gas), and red blood cell transfer (RBC/gas) according to thresholds established using healthy reference distributions. To date, reference values have been based on small samples and do not account for hemoglobin concentration (Hb), which is known to vary by sex. We apply a Hb correction to data from 15 young, healthy volunteers (age=25.2±3.3 yrs., 6 female). After correction, there was no significant difference in individual mean M/gas and RBC/gas between males and females. The resulting reference distributions have less dispersion and skew than previously established distributions.Introduction
Hyperpolarized 129Xe MRI maps 129Xe signal distribution within airspaces (gas), membrane tissues (M), and red blood cells (RBCs) and has emerged as a means of characterizing pulmonary diseases1-3. A common method of quantifying these images involves classifying the M/gas and RBC/gas maps into color bins according to thresholds established by healthy reference distributions4,5. Recent findings show that 129Xe gas exchange metrics are affected by age and hemoglobin concentration (Hb) and may differ between males and females6–8. However, current reference thresholds are based on small population samples with a wide range of ages and no consideration of differences in sex and Hb4,5. Since males tend to have higher Hb than females, accounting for Hb is essential to examining sex differences in 129Xe MRI9. Here we apply a Hb correction8 to images from 15 young, healthy subjects to assess sex-specific differences in measures of gas exchange and establish improved reference distributions.Methods
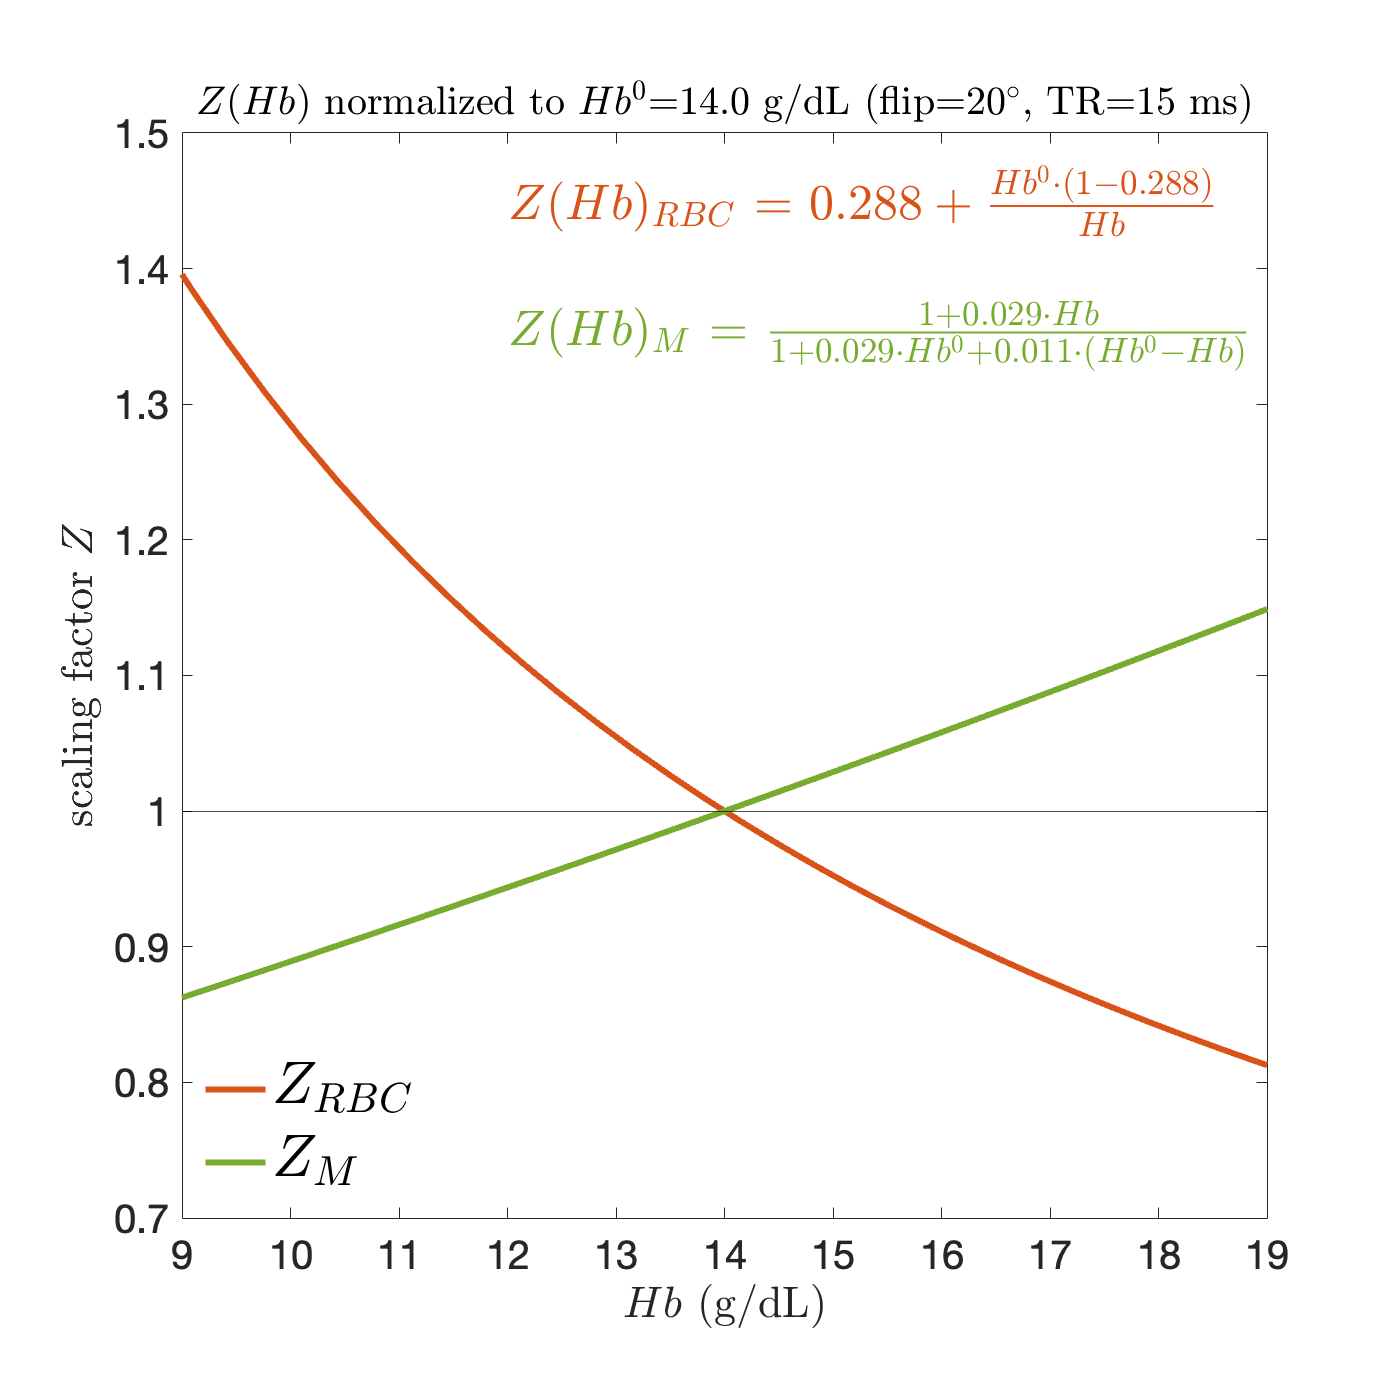
22 healthy subjects underwent pulmonary function tests (PFTs) and 129Xe gas exchange MRI according to established protocols10. Hb was measured using an optical sensor at the finger. Seven subjects were excluded due to abnormal PFTs, poor scan SNR, insufficient Hb sensor signal, or subsequent pulmonary disease diagnosis, leaving a final sample of 15 (age=25.2±3.3, 6 female).Ventilation maps were corrected for B1 inhomogeneity using the N4ITK method and then normalized11. Maps of M/gas and RBC/gas were constructed using the RBC/M ratio from spectroscopy, as described previously4. These maps were then corrected for T2*, which for the gas signal was approximated as a constant 18ms12 and for the membrane and RBC signals was estimated by 1/(πw), where w is the FWHM of Lorentzian fits to their respective spectral peaks (T2*M=1.20±0.05ms, T2*RBC=1.09±0.02ms). Maps were corrected for Hb using previously established correction factors derived from the model of xenon gas exchange (MOXE) (Figure 1)8. Each voxel of the M/gas and RBC/gas images was multiplied by the corresponding membrane ($$$Z_{M}$$$) and RBC ($$$Z_{RBC}$$$) Hb scalar correction factor. To compare to previously established reference distributions5, the previous non T2*-corrected M/gas and RBC/gas data5 were scaled by the average T2* factors from our sample. Sex-specific distributions were compared using a t-test on the set of subject means.
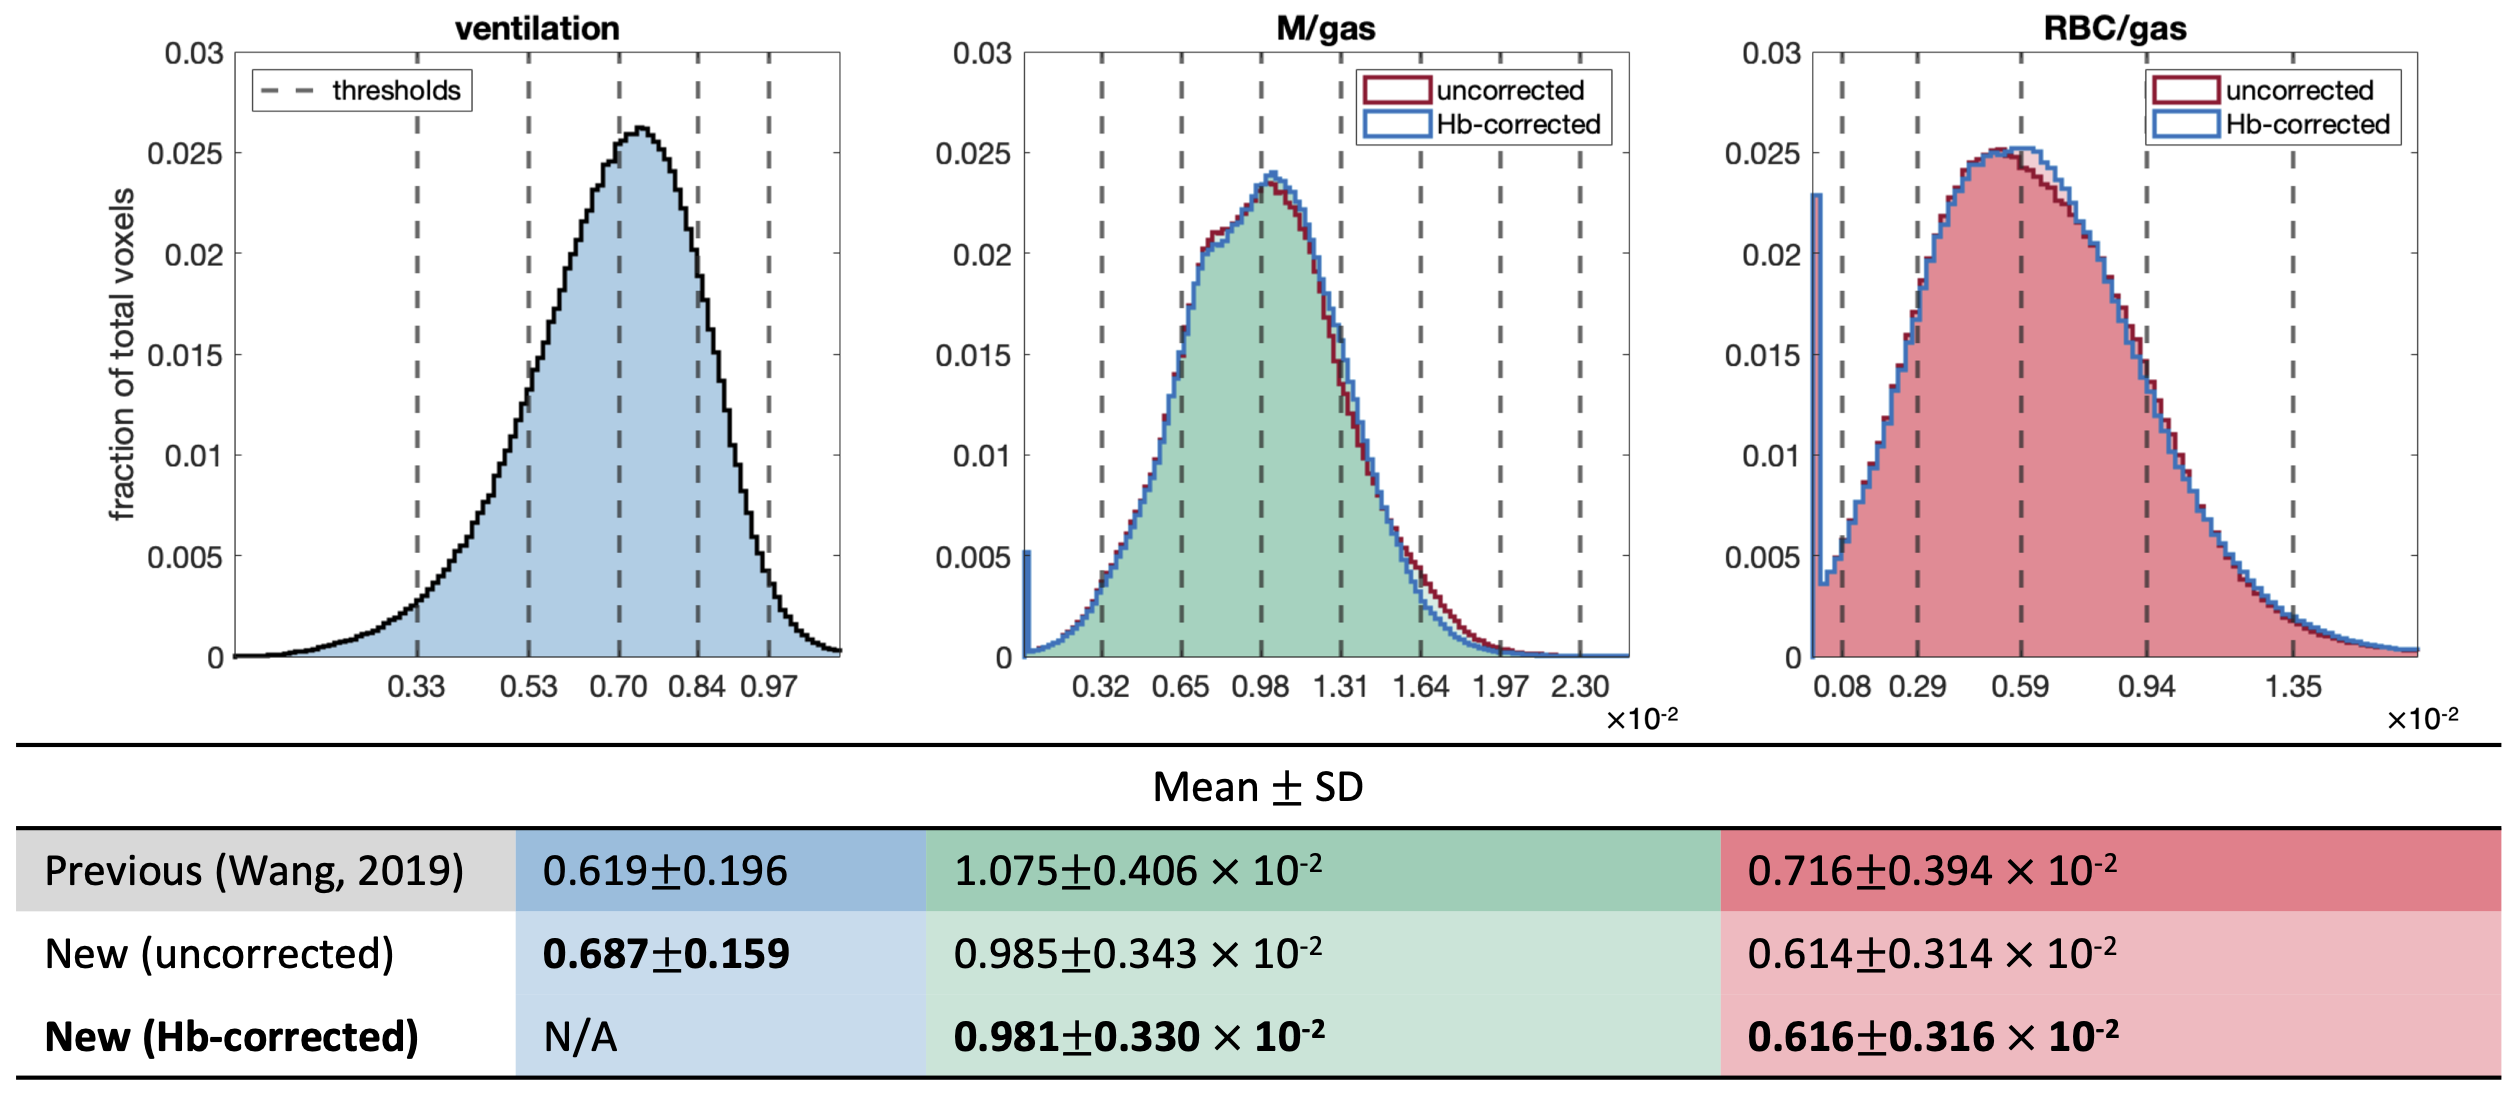
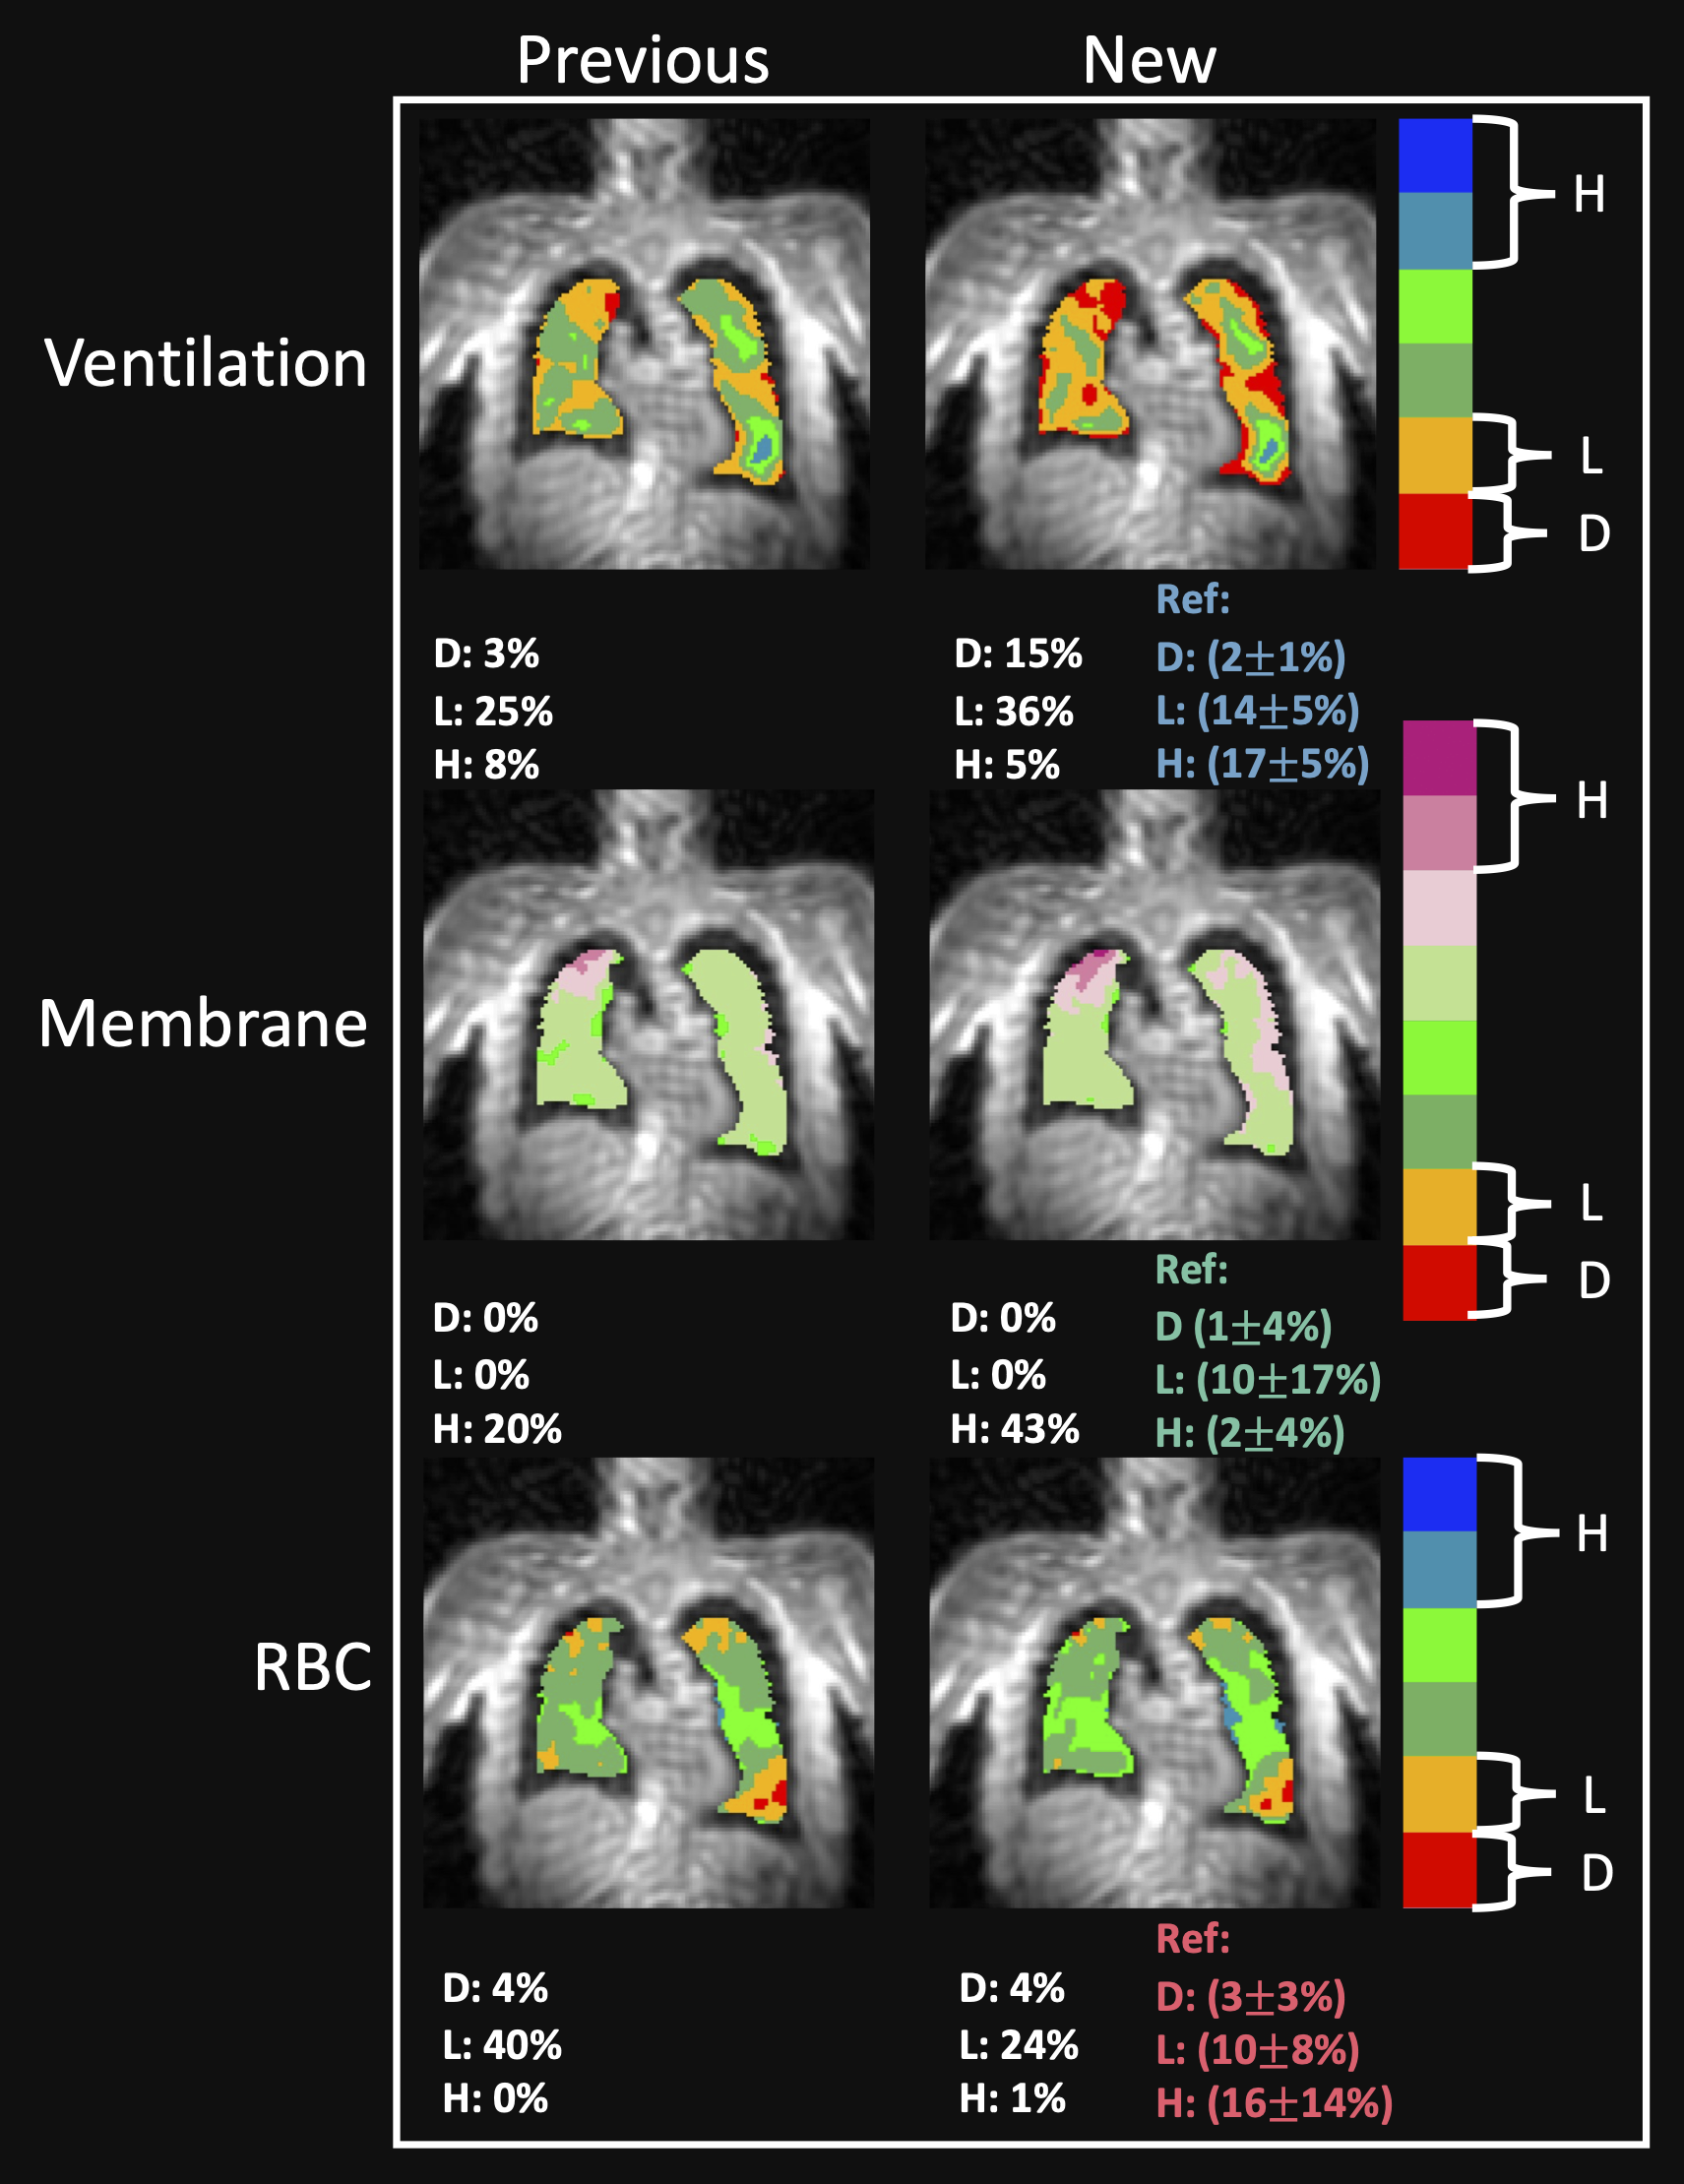
Thresholds for color binning were calculated from normalized cumulative distributions of all subjects, as done previously5. The ventilation and RBC/gas distributions were Box-Cox transformed to account for skew, thresholds were calculated from the mean and standard deviation of the transformed data and then inverse transformed5. These final thresholds were used to identify regions of defect (<two SD below mean), low intensity (<one SD below mean), and high intensity (>two SD above mean). To illustrate the impact of these new thresholds, we applied T2* and Hb corrections to images from a 69 y/o patient with idiopathic pulmonary fibrosis (IPF) and compared the resulting color-binned images with the uncorrected images binned using the previous thresholds5.
Results
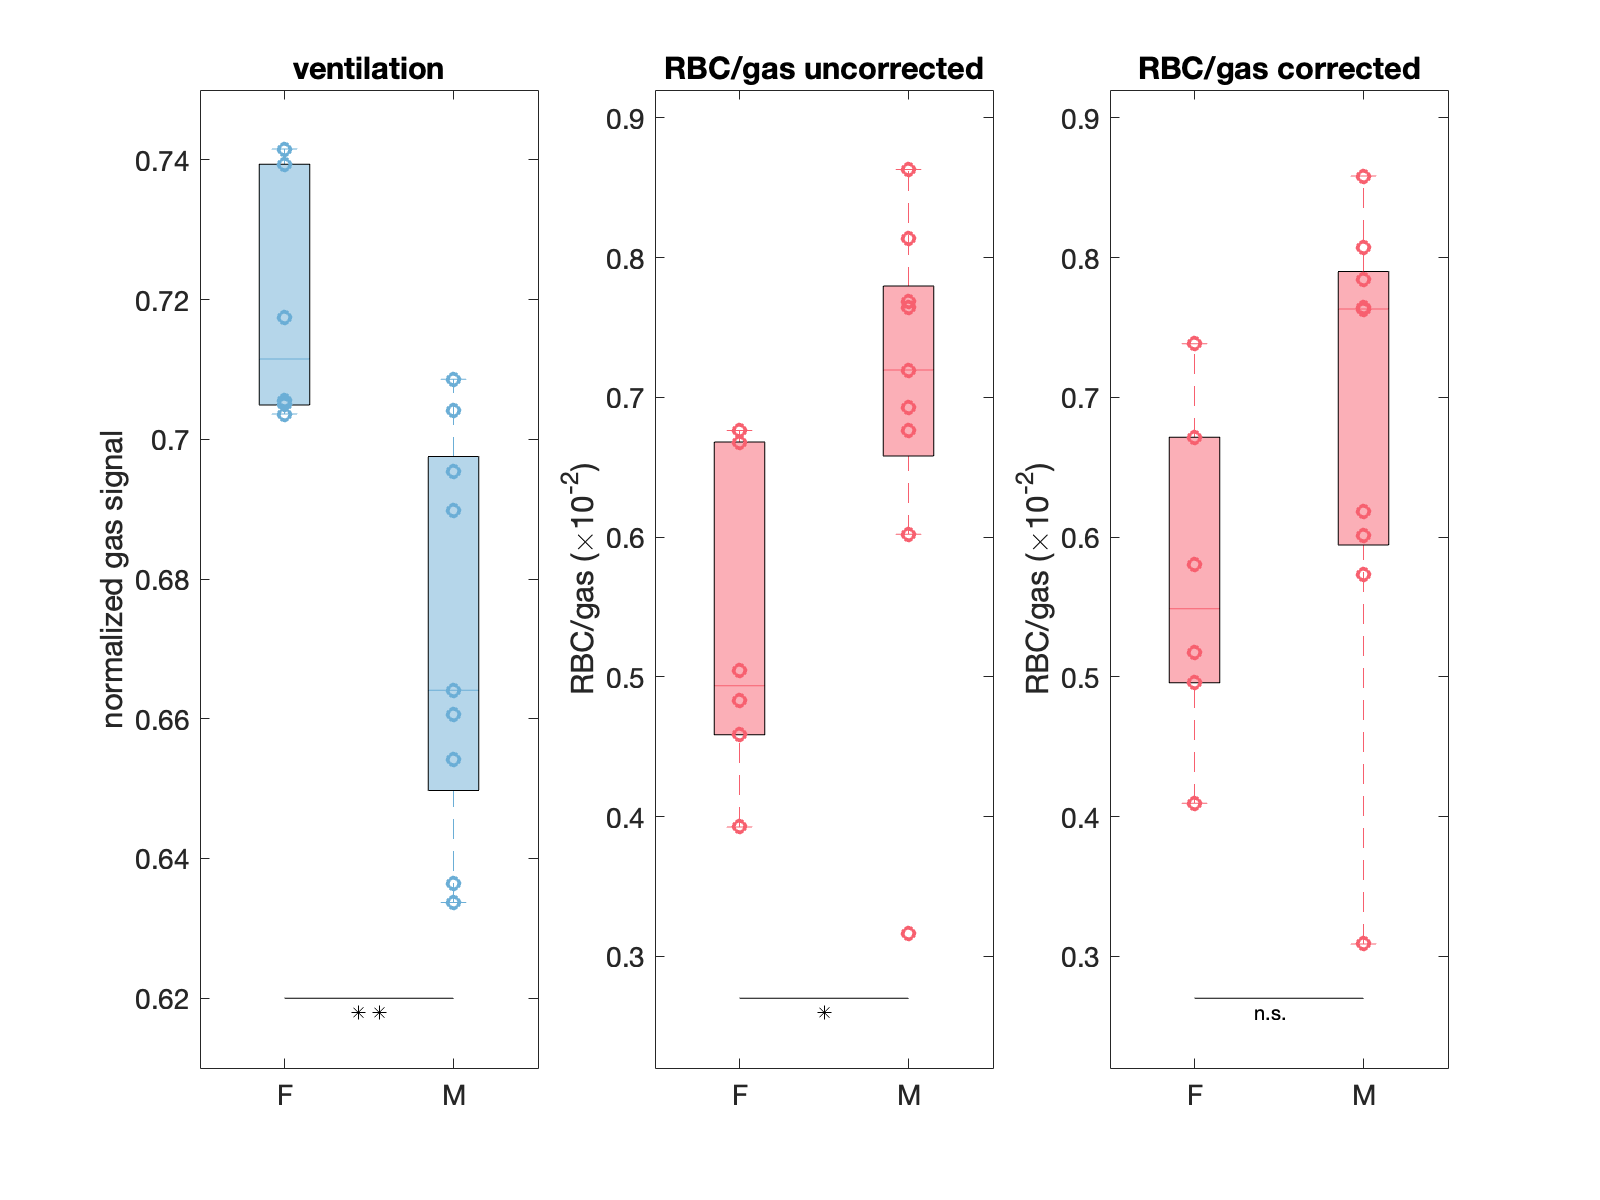
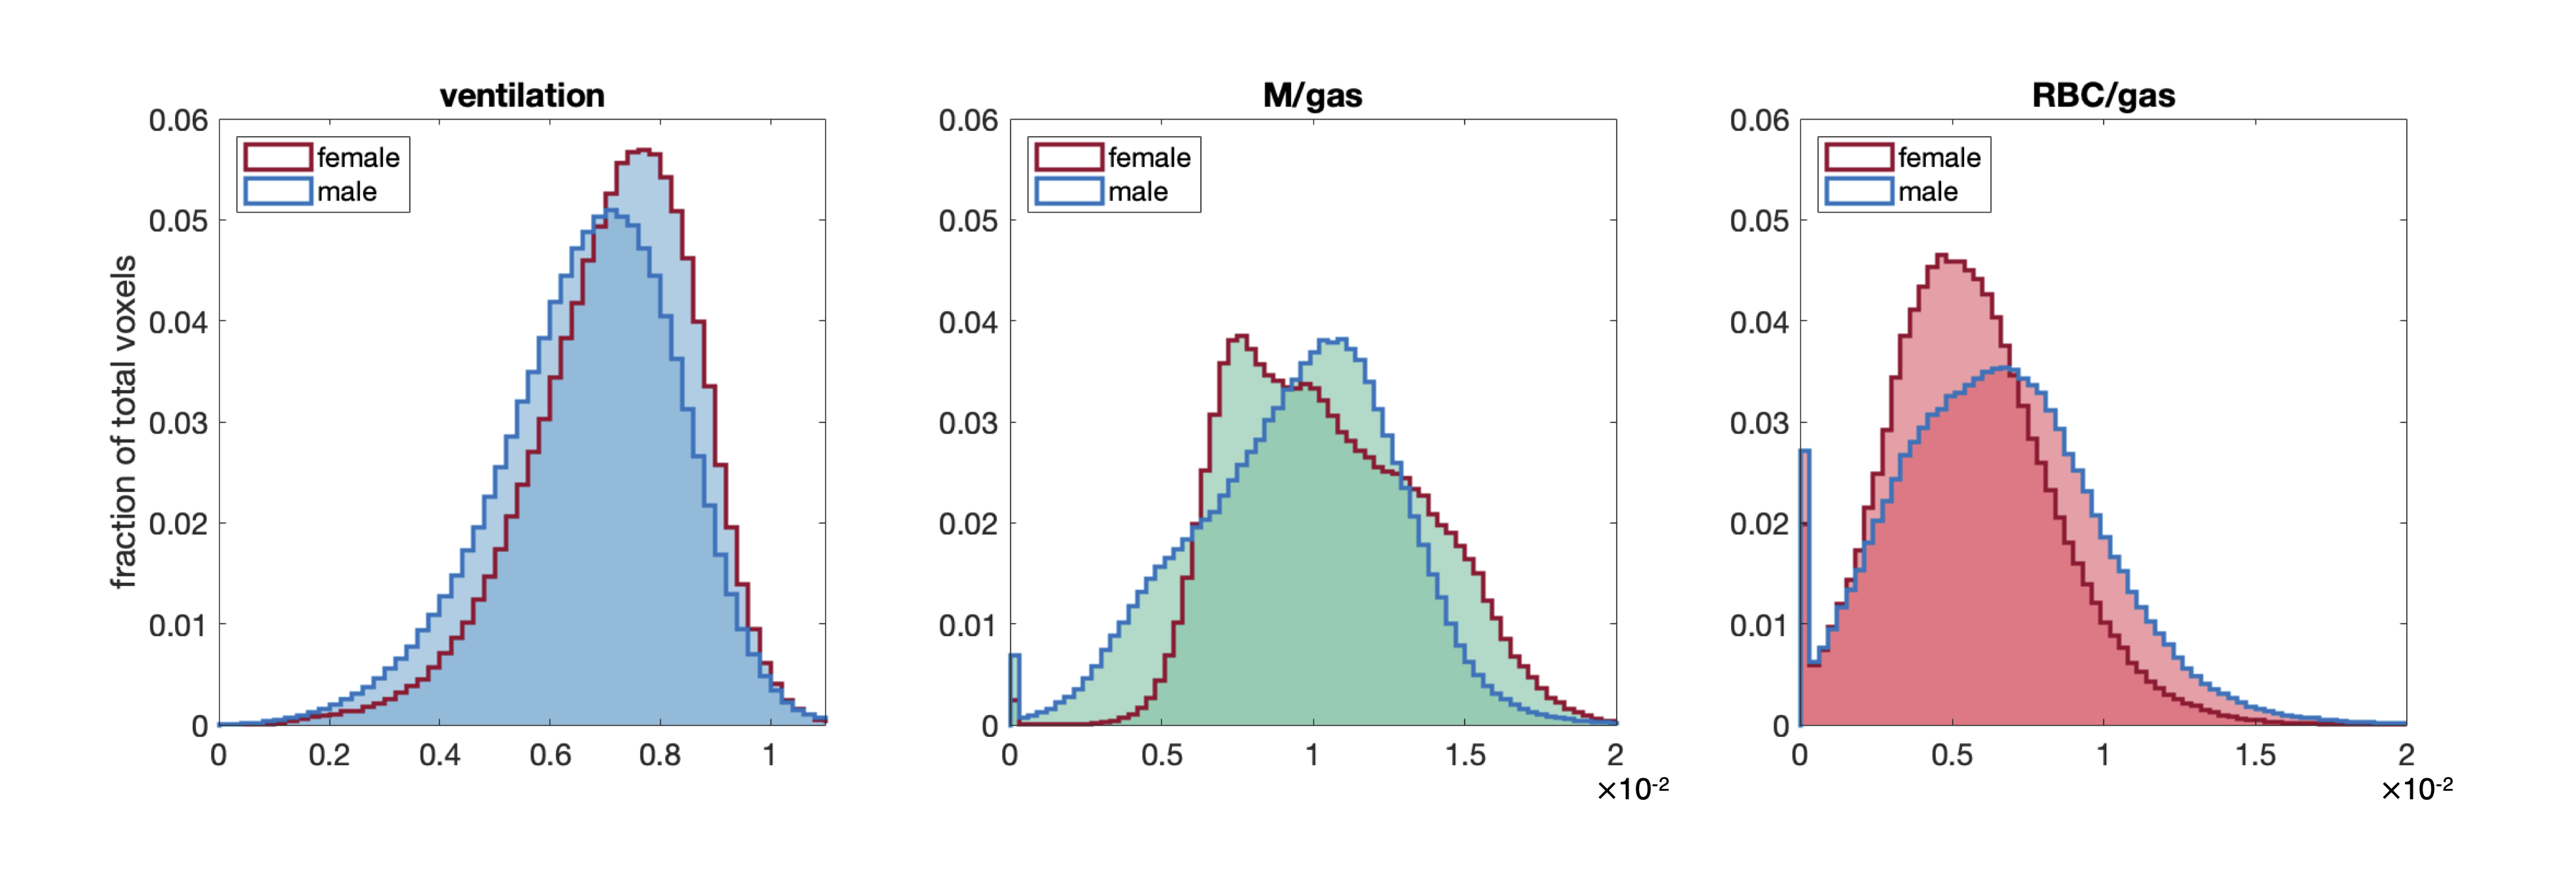
Figure 2 shows the cumulative ventilation, M/gas, and RBC/gas distributions with and without Hb correction, along with the thresholds and mean±SD determined from the Hb-corrected distributions. Hb correction changed individual M/gas and RBC/gas signal by an average of 3.4% and 6.4%, respectively, but had minimal impact on the cumulative distributions. The new distributions have less spread and skew than previous distributions5. Figure 3 shows images from the example IPF patient binned using the new and old methods. The new method reveals more ventilation defects, higher membrane uptake, and improved RBC transfer.Figure 4 shows sex-specific distributions of individual ventilation means along with RBC/gas means both pre and post Hb correction. The gas signal averages were lower in males than females (p<0.01). Hb was significantly higher in the male cohort (14.6±1.4 vs 12.8±1.4 g/dL, p<0.05). Before Hb correction, the individual subject means of the RBC/gas distributions were higher for males (p<0.05), although there was no significant difference in M/gas means. After Hb correction, there was no significant difference in either metric across sexes. However, even with Hb correction, the cumulative sex-specific distributions suggest lower membrane uptake and higher RBC transfer in males (Figure 5).
Discussion
While Hb correction can cause large changes in some individual distributions (greater than 10% in 3/15 subjects), most subjects demonstrated only minor changes and the effect on the cumulative distributions was minimal. We suspect that this is primarily the result of the relatively tight distribution of sample Hb (13.9±1.6 g/dL) about the reference Hb0=14 g/dL.We expect that these narrower distributions will allow greater sensitivity to abnormalities in ventilation, membrane uptake, and RBC transfer. This is demonstrated in the IPF patient images where the new thresholds reveal higher membrane uptake, a key biomarker of interstitial lung disease13–15.
The reason for the observed higher gas signal in females is unclear but could relate to differences in lung inflation states, which can impact 129Xe imaging markers7,16. Increased RBC/gas in males was only observed prior to Hb correction, indicating that this apparent difference was likely driven by sex differences in Hb and highlights how Hb correction reduces perceived sex-specific differences. Hemoglobin correction is an essential step to ensure meaningful comparisons of 129Xe MRI measurements of gas exchange function across subjects.
Acknowledgements
R01HL105643, R01HL12677, NSF GRFP DGE-1644868References
1. Wang, Z. et al. Using hyperpolarized 129Xe gas-exchange MRI to model the regional airspace, membrane, and capillary contributions to diffusing capacity. J Appl Physiol 130, 1398–1409 (2021).
2. Marshall, H. et al. In vivo methods and applications of xenon-129 magnetic resonance. Prog Nucl Magn Reson Spectrosc 122, 42–62 (2021).
3. Qing, K. et al. Assessment of lung function in asthma and COPD using hyperpolarized 129Xe chemical shift saturation recovery spectroscopy and dissolved-phase MRI. NMR Biomed 27, 1490–1501 (2014).
4. Wang, Z. et al. Quantitative analysis of hyperpolarized 129 Xe gas transfer MRI. Med. Phys 44, (2415).
5. Wang, Z. et al. Quantifying Hyperpolarized 129Xe Gas Exchange MRI Across Platforms, Field Strength, and Acquisition Parameters. in ISMRM 27th Annual Meeting and Exhibition (2019).
6. Mummy, D. et al. Hyperpolarized 129Xe MRI and spectroscopy in healthy control subjects reveals age-related changes in measurements of pulmonary gas exchange. in Joint Annual Meeting ISMRM-ESMRMB 2022 and ISMRT Annual Meeting (2022).
7. Collier, G. J. et al. Age and lung volume dependence of dissolved xenon-129 imaging parameters. in Joint Annual Meeting ISMRM-ESMRMB 2022 and ISMRT Annual Meeting (2022).
8. Bechtel, A. et al. Establishing a hemoglobin correction for 129Xe gas exchange MRI. in Joint Annual Meeting ISMRM-ESMRMB 2022 and ISMRT Annual Meeting (2022).
9. Munkholm, M. et al. Reference equations for pulmonary diffusing capacity of carbon monoxide and nitric oxide in adult Caucasians. Eur Respir J 52, (2018).
10. Niedbalski, P. J. et al. Protocols for multi-site trials using hyperpolarized 129Xe MRI for imaging of ventilation, alveolar-airspace size, and gas exchange: A position paper from the 129Xe MRI clinical trials consortium. Magn Reson Med 86, 2966–2986 (2021).
11. Tustison, N. J. et al. N4ITK: Improved N3 Bias Correction. IEEE Trans Med Imaging 29, 1310 (2010).
12. Xu, X. et al. Hyperpolarized 129Xe gas lung MRI–SNR and T2* comparisons at 1.5 T and 3 T. Magn Reson Med 68, 1900–1904 (2012).
13. Wang, J. M. et al. Using hyperpolarized 129Xe MRI to quantify regional gas transfer in idiopathic pulmonary fibrosis. Thorax 73, 21–28 (2018).
14. Wang, Z. et al. Diverse cardiopulmonary diseases are associated with distinct xenon magnetic resonance imaging signatures. European Respiratory Journal 54, (2019).
15. Mummy, D. G. et al. Hyperpolarized 129Xe MRI and spectroscopy of gas-exchange abnormalities in nonspecific interstitial pneumonia. Radiology 301, 211–220 (2021).
16. Qing, K. et al. Gas Uptake Measures on Hyperpolarized Xenon-129 MRI are Inversely Proportional to Lung Inflation Level. in ISMRM 23rd Annual Meeting and Exhibition (2015).
Figures